XRPUSD support and ressistance zoneNow we are in resistance zone.
decrease is probably.
Buy zones are: 0,55, 0,52, 0,50, 0,44 ...
Zonetrading

CHF/JPY AnalysisWelcome back! Please support this idea with a LIKE if you find it useful.
*** CHF/JPY - Play the recorded analysis and comment below with your thoughts or questions! Thanks for growing the community! :)
We recommend that you keep this pair on your watchlist and enter when the entry criteria of your strategy is met.
Click "Follow" on our profile if you'd like these trade ideas delivered straight to your email in the future.
Thanks for your continued support!
Brian Kenya Horton, BK Forex Academy

KOTAK MAHINDRA BANK AnalysisKotak Mahindra Bank Limited is an Indian private sector bank headquartered in Mumbai, Maharashtra, India. It offers banking products and financial services for corporate and retail customers in the areas of personal finance, investment banking, life insurance, and wealth management.
Right now, According to the wave theory, Impulsive waves are countered recently by the Corrective wave by making lower low than the previous corrective wave.
Also, there is a Demand zone below from where we can expect a bounce.
There is a Resistance level at the top. This level is fresh and thus may be broken also.
So, wait for the price to bounce at the Resistance level, and then we can short our stock.


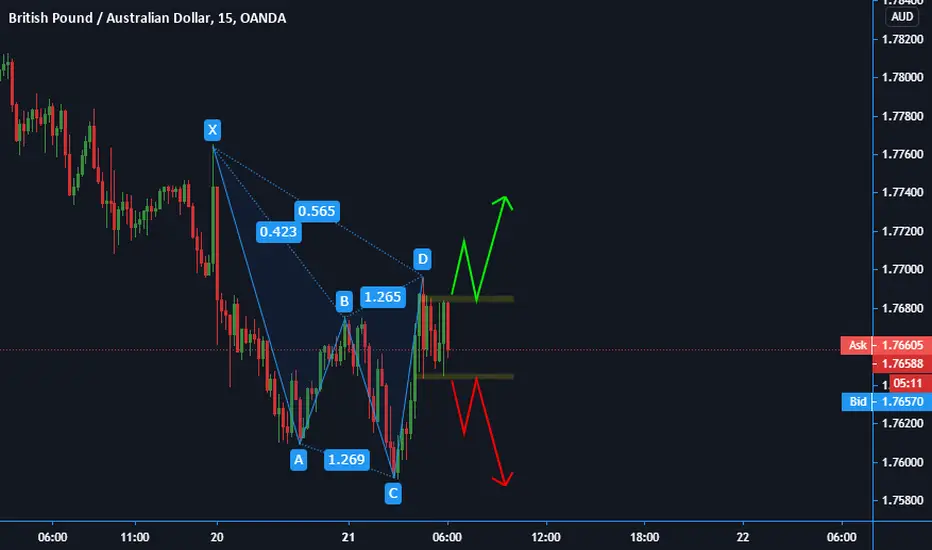
AU is approaching a good Sell ZoneConfluences:
-Downward channel
-Price will be near a zone
-Will look for continuation and a lower high being formed before entering on the 30 min or 1 hour candle
-the dollar will still be strong for at least a week or two (as seen from the dxy) so my bias will be short for swing trades like this.
I will keep this updated if and when ill take a trade

US30 DOW JONES sell continuationHi traders, US30 nicely reject on our supply zone and droped down. It breaked below trendline agressively, and shows that price is gaining on bearish momentum. I expect price now to correct so we might see price retrace back to fib levels. There is still a lot of uncertaintes in America, so we might also get price to push back and retest zone with taping on 0.786. Anyway i think that price will continue to the downside, i expect weaker DOW in next days. And there is still daily divergence on macd which can push price down realy agressive. Keep your eyes on it and wait for correction, and stay patient!

XAUUSD, 1hr tf, buy on EMA-200 bounceHello my friends,
Another trade setup for today before i am going offline.
As you can see, XAUUSD recently dropped 580 pips in only 1 day.
It finally find support at EMA-200 of 1hr timeframe.
In my opinion, we could see some bounce to the upside. Maybe to test 1936 area.
Notice also there is an inside bar pattern occurs at support.
When an inside bar occur at support/resistance, it usually could be a reversal pattern.
So after the hard drop, we might see some upwards movement.
Buy XAUUSD 1916
Stop loss 1908
Take profit 1936 (2.5R)
RR Ratio 1 : 2.5
Use only 1-2% risk
Good luck

USDJPY, 4hr tf, sell on area of confluence resistanceHello my friends,
As you can see, USDJPY just rally for 100 pips in the last 2 days.
In my opinion, this rally will be short lived as long as price below 103.70 on daily and 4hr tf basis.
We could see further upside if price managed to closed above 103.70 on the daily tf.
So as long as price below it, we will only sell on every rise (SOER).
As you can see 103.70 is an important level because it previously served as horizontal support.
Now that price already broken below it, this level will now become a resistance.
Right now the 4hr tf EMA-200 also located at 103.70 area so we could say this is an area of confluence.
I provide 2 trading plan where you could set your take profit.
Feel free to choose either one.
Sell USDJPY 103.70
Stop loss 104.00
Take profit 1 at 102.60 (3.6R)
Take profit 2 at 101.20 (8.3R)
Use only 1-2% risk
Good luck

EURUSD, 4hr tf, buy on retest of ascending trendlineHello my friends,
Today i am gonna trade EURUSD.
I am taking a buy position for this pair.
As you can see, EURUSD respecting this ascending trendline from the beginning of Desember until now.
As long as price above this trendline, we will only look to buy EURUSD on every dip.
Notice also price above EMA-200 so, we could say EURUSD is bullish.
I also marked potential horizontal support level with those yellow area.
This area is an area where price open with a gap. Usually this kind of gap will turn into support or resistance.
Buy EURUSD 1.2250
Stop loss 1.2215
Take profit 1.2470 (6.3R)
RR Ratio 1 : 6.3
Use only 1-2% risk
Good luck

usdchf 4h buyusdchf 4h Price comes down quite a lot. There is a significant support line at 0.872, there is an interesting reversal opportunity. BUY has resistance at 0.891 and 0.900 MM as well.
If you find this analysis useful, please support me with your likes and comments.
If you have another analysis on this pair, please share it in the comments.
Good luck.

EURCHF, 4hr tf, buy bullish flag breakout at EMA-200Hello my friends,
Today i found a nice setup on EURCHF pairs.
As you can see there is a possibility the recent downward movement looks like a bullish flag.
The downward movement also stop at 61.8 fibonacci retracement so i think we will see upwards movement again soon.
Our target will be the recent top of EURCHF at 1.0885
This is simple analysis and don't need to overcomplicated it.
Buy EURCHF 1.0807
Stop loss 1.0785
Take profit 1.0885 (3.5R)
RR Ratio 1 : 3.5
Use only 1-2% risk
Good luck

GBPNZD DAY Pinbar candles In the support zone BUYHello traders GBPNZD DAY Pinbar candles. Price reversal In the support zone There is a chance to go up to the key resistance at 1.983.
If you find this analysis useful, please support me with your likes and comments.
If you have another analysis on this pair, please share it in the comments.
Good luck.

GBPAUD, 4hr tf, sell on retest of potential reversal zoneHello everyone,
GBPAUD pairs gonna be my 3rd trading plan for next week.
This pair trading plan gonna be like GBPNZD.
Both of it aiming for a potential downward movement to fill the gap.
This gap have now been left open for 2 weeks.
It is not fully closed yet and i think we could see it sooner or later.
The best place to enter sell will be arond 1.7900-1.7920 because it has acted as resistane for 2 times.
I am waiting or price to test it once again and enter sell with a pending sell limit order.
Sell limit GBPAUD 1.7900
Stop loss 1.7960
Take profit 1.7570 (5.5R)
RR Ratio 1 : 5.5
Use only 1-2% risk
Good luck

GBPNZD, 4hr tf, sell on retest of resistance levelMy second trading plan for the next week is GBPNZD pairs.
As you can see there is a gap which has not been filled for 2 weeks.
It's quite a big gap and i think it will be fulfilled sooner or later.
GBPNZD finally broken below the ascending trendline which supporting it since 15th December.
I am now waiting for price to retest that trendline before taking a sell position.
I would prefer if price also retest 1.9080-1.9100 resistance level before going down because this area could be a crucial supply and demand zone.
If price really touch 1.9080-1.9100 area and reverse to the downside, we could also see it as a potential shoulders head pattern.
A sell limit position will be placed at 1.9080 just in case i was not watching the pairs when price come to this area.
Sell limit GBPNZD 1.9080
Stop loss 1.9160
Take profit 1.8690 (4.8R)
RR Ratio 1 : 4.8
Use only 1-2% risk
Good luck

GBPAUD- Weekly AnalysisHappy Sunday to you all,
Definitely was a weird week last week for GBP. What I think will happen when the market opens is price will gap back down to where it gapped from last week, which it never retraced back to. Even if it doesn't price will rise then eventually retrace to that area for sure! I personally have never seen anything happen like this, where price doesn't retrace to where it gapped from within the same week. So what i'm expecting this week is price will retrace and rise just like it has previously at this area a few other times. If price was to take on the bulls price is definitely headed to 1.80000+. I will be updating/posting this pair all week so stay tuned, I feel a good week is ahead of us!

USDCHF, 4hr tf, sell on weekly resistanceHello everyone,
USDCHF also on interesting level to sell as well.
As you can see 0.8900 acted as weekly resistance for now.
We might see price rejected to the downside so a sell position looks favorable.
Notice also the last 4hr candle also a bearish pinbar candle so i am pretty sure bears in control for now
Sell USDCHF 0.8890
Stop loss 0.8925
Take profit 0.8830 (1.7R)
RR Ratio 1 : 1.7
Use only 1-2% risk
Good luck

CHFJPY, 4hr tf, buy on double bottom near EMA-200Hello my friends,
Another setup for today is CHFJPY pairs.
I found price moving towards strong EMA-200 support.
It looks like a double bottom pattern or bullish flag pattern in the long run.
Buy CHFJPY 116.45
Stop loss 116.00
Take profit 117.15 (1.5R)
RR Ratio 1 : 1.5
Use only 1-2% risk
Good luck

USDJPY, 4hr tf, sell on retest of resistanceHello my friends,
This is the last week of 2020 and i hope we could book some profits before this year ends.
It has been a hella ride for this year and the market was in high volatility through the year.
After marking our support and resistance zone you will find out that 103.60 has acted as strong support previously.
It could turn into strong resistance for USDJPY and we will sell USDJPY as long as price hold below it.
I also draw an ascending trendline to marked the recent movement but price now breaking below it.
Sell USDJPY 103.60
Stop loss 104.10
Take profit 102.85 (1.5R)
RR Ratio 1 : 1.5
Use only 1-2% risk
Good luck

EURAUD, daily tf, buy upside ABC correctionHello my friends,
Another trade i took today is EURAUD pairs.
As you can see, i've marked the elliott wave movement and in my opinion we're now done with all five waves.
Wave-5 usually end at the 127% fibonacci retracement of Wave-4.
We can expect an ABC correction to the upside from this point.
Notice that price actually broken above the descending trendline but only retested it down below at 1.6070.
It looks like there is also horizontal support here as well.
In conclusion it is an area of confluences.
I already take a buy position from 1.6070 and still holding it.
Buy EURAUD 1.6070
Stop loss 1.6000
Take profit 1.6210 (2R)
RR Ratio 1 : 2
Use only 1-2% risk
Good luck

EURCHF H4 - Long SetupEURCHF H4 - Another fresh low set and we are fast approaching support, this next bearish wave could be the start of the reversal as we enter 1.07200 support region.

EURGBP Multi-timeframe analysis Daily - Since 24th of November market rejected the 0.88610 zone and moving from HL to forming a possible HH.
Our target is to catch a buy in this move.
4H-Break the downtrend structure and now we are at the 0.89958 key zone with market forming a second HL. We already have a bullish engulfing as a confirmation and with more bullish elements we could get our Buy setup on Lower Time Frames (LTF).
Using 1H for confirmation and 30m for our entry, since both are on a downtrend forming a LH, will wait probably another 3 to 6 hours until market find a new HH and HL, otherwise the Scenario 2 (S2) will be our future setup.
Will keep you updated.
Please follow us for future analysis and ideas.
Sam
