Possible Bearish ContinuationThe bearish trend may continue for this pair. This will be marked up to make it to key levels.
Not much to say but trade to the next zones until it reaches a key level.
BEAR TPS:
• 1.29393
• 1.28824
• 1.28393
• 1.28055
BULL TPS:
• 1.29802
• 1.30550
Zonetrading

Consolidation May Lead To A PullbackThis looks like a higher low is due before continuing up. So this may begin as a pullback before continuing up. Let's see how the markets play out. When it resumes the long, taking it to the weekly at 85.691.
BEAR TPS:
• 83.956
• 83.624
• 83.136
BULL TPS:
• 84.478
• 84.889
• 85.691

Currently In the Mist of A PullbackIf you weren't paying attention to this pair, you missed one heck of a drop! We are currently in pullback mode, but it won't last for too much longer since this pair actually broke out of multiple weeks long range.
So we'll be trading this pair until the pullback is complete or, if you want, when the continuation begins.
BEAR TPS:
• 1.42917
• 1.41912
• 1.40732
BULL TPS:
• 1.43824
• 1.44566


Major Key Level Reached For Strong SetupThis pair will be important to look at this week because of the weekly SR it made to… it hasn't been there since 2010. So that means this is a major setup forming.
This key level has delivered strong respect off support the last time it was hit. Let's see will it do it again. If not, I have one short TP that I'm aiming for… that is, if it can breakthrough.
BULL TPS:
• 0.88893
• 0.89372
• 0.89801
BEAR TPS:
• 0.86927

AUDCAD Explained Analysis!Sorry for the poor speaking quality, this was my first ever video analysis, so don't expect to much.
Anyway, the AUDCAD is in a perfect zones parallel channel, so please wait for a confirmation before buying this.

EURUSD LONGEURUSD to hit demand zone and retest back up to supply aiming 20 pip tp and swing for 1.1117
COMMENT YOU'RE THOUGHTS BELOW

Looks Like a Pullback Due For ContinuationNot much to look at with this pair. Still has the legs to keep moving up. Looks overbought on the RSI, so could do a pullback before continuing, or make a run for the short.
So, with this pair waiting on a pullback to confirm the continuation or reversal.
BULL TPS:
• 110.784
• 111.164
• 112.193
BEAR TPS:
• 109.776
• 109.127
• 108.420

Bull Still StrongCADJPY is in the middle of a strong bull run so we're just gonna follow the trend until it shows signs that it's turning around or committing a pullback.
BULL TPS:
• 84.088
• 84.407
• 84.818
• 84.889
BEAR TPS:
• 83.598
• 83.320
• 82.895

Strong Doji on Weekly Can Possibly Signal The Bull MoveAUDCAD looking like a buffet with that super-strong doji on the weekly. The strong bearish move was unphased last week and barely made a juke at all. It did a rejection at the daily and it looks to be forming a pullback on the 4hr.
The weekly shows a large rejection like the downward move has come to a screeching halt. But one way to know for sure is to see how the market plays out. Trade well this week. This may be the one I keep an eye on this week.
BULL TPS:
• 0.90314
• 0.90955
• 0.91256
BEAR TPS
• 0.89873
• 0.89467
• 0.89025

Trade Idea: EURUSD — Zone TradingMarket Structure: Day. Uptrend
Strategy: Zone
Trade Action: Buy. Trend Trading
RSI: Bullish Divergence
Entry Trigger: Doji + Confirmation

EURAUD touching support-zone!EA bounced once of the support, and now its looking to retest. This could go either way, but i will be having my eyes open for a long entry here:)

AU ZONE PLAY! AU is hitting strong resistance, and i think this is a good short setup. I will be keeping a close watch though, as this might be a zone-break followed by a retest on the upper side of the resistance, creating support.

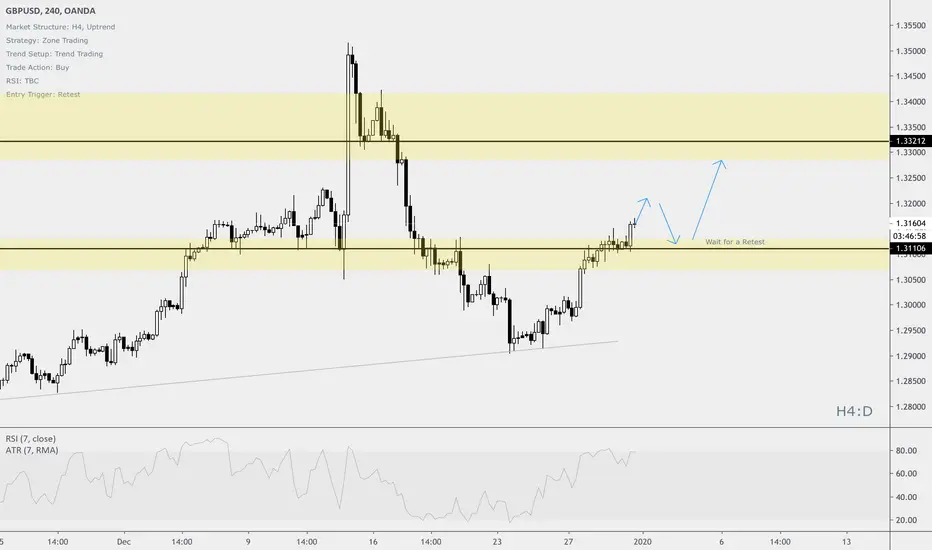
Trade Idea: GBPUSD — Zone TradingMarket Structure: H4, Uptrend
Strategy: Zone Trading
Trend Setup: Trend Trading
Trade Action: Buy
RSI: TBC
Entry Trigger: Retest
NFLX Long set up - for Christmas binge watchers.. See chart for zones of interest. Daily if we break out of the correction - wave traders would call this a completed abc flat with a short c leg. Can not rule out D Triangle setting up so watch that TL above, or C leg continuation so stop out is possible.. 240 looks Bullish with buyers in this area with a nice stop level to give an attractive near 10x R:R scenario. If the stop hits.. watch zone below for next move up option. First level goes, then trail it for profits..
Happy Trading!

Looking for BuyWaiting for Break of Resistance/Ceiling on 1 hr Candle Retest on the 1-hour candle and 2 consecutive 15 min Buy Candles

DIS LONG - wave pattern playSmall position with plan to exit if the lower level downtrend remains intact - break out.. will add on to get full position. Lower entry alert is ready to go - hard stop below (red dashed). Wave traders know this as the running flat pattern - we also have a weekly breakout and retest for those looking at larger timeframes. **note trendlines, patterns, areas of interest (zones,colors etc.) are questions that I am happy to entertain but recommend DM as that is more involved than reasonable to do in comment of an idea.. glad to do so, but give me a little time** happy trading, stay green!!

UPS long Trend line playMissed the perfect entry as we gapped up. small position in already, will add on if we hold the current zone. If you have questions about the trendlines and horizontal area of interest (zones/colors/ meanings etc) you will have to DM me as it is too involved to go over in a comment. Happy to communicate though, just give me a little time.. Happy trading and stay green!

ULTA - Will December be BEAUTY-ful month? buy set upsChart pretty well tells the story - note that this set up has possibility for 2 entries, so you pick - take first, take lower, take both? Keep good money management as we are looking for trend break and buying a low.. risky, but much possible reward. If we just break out now without coming back to pick me up.. will have to look for entry/stop above after breakout.. not as good, but still on radar.. Happy Trading!

RISKY long on HD.. are you in?..Recommended 30% risk only .. i.e. usual trade for this size ticker is 1000 shares, go in small at 300 shares and trail this one on the way up.. catching a sharp knife, trying to pick the bottom - so relatively tight stop and either it goes or it doesn't!.. see chart -- close up view in comment section.. Happy trading!


Roku ZONE to ZONE - Bull PenantZone Traders! How Sweet was this one.. as we predicted in the Mentorship Discord Chat ROKU continues and break up bullish out of the penant - see chart.. we are D/240/60 traders that day and swing trade.. just on example of 20 plus ETF / TIckers we break down and plan nightly for the next days trades.. GET IN THE ZONE! .. Don Fron Show Zones ..

EURCHF ShortEURCHF, wick, wick, wick.
Probably, short after breaking H1 downflag.
One of my looking chart.
