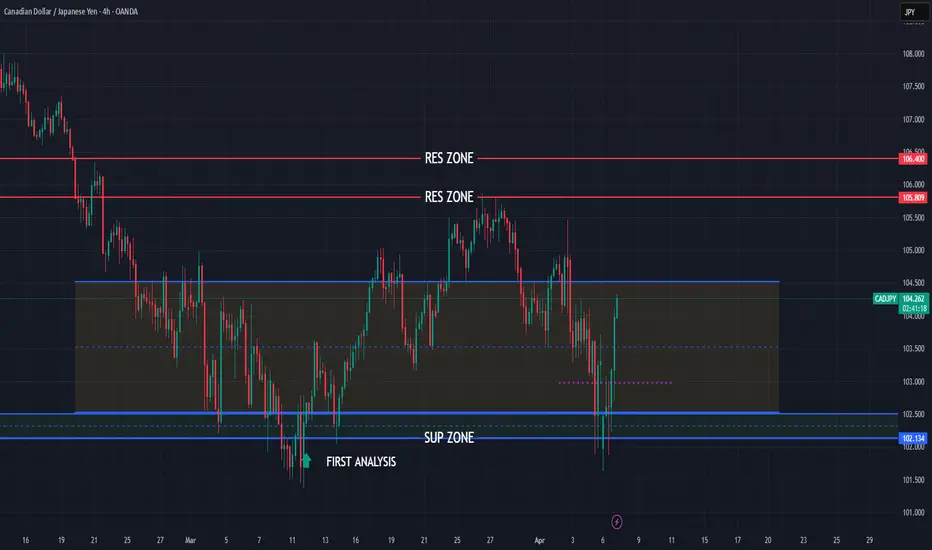
CADJPY still bullish expecting
OANDA:CADJPY first analysis highly accurate it's attached.
In first analysis i am share bullish view, having op we are not see some special big bullish move and based on PRICE ACTION analysis expecting here new bullish push.
SUP zone: 102.500
RES zone: 105.800, 106.400
Zonetrading
USDCAD bearish strong
OANDA:USDCAD trend based trade, after strong events in last periods here strong bearish expectations for this week.
SUP zone: 1.45500
RES zone: 1.40500, 1.39600

GBPJPY still bullish view
OANDA:GBPJPY in first analysis RES zone reached, what's next here is still bullish for expect. First analysis attached, currently price is in ASCENDING CHANNEL. Technicals are still bullish to see.
SUP zone: 192.500
RES zone: 195.900, 196.900

EURCHF bullish view
OANDA:EURCHF in first analysis price in moment is make break of crucial zone, at end soon after price is start testing zone again and its make bullish push, currently here now still bullish we can exepct for next periods.
SUP zone: 0.95400
RES zone: 0.96400

AUDCHF time to see changes?
OANDA:AUDCHF much upsides-downsides we are not see some special moves here from start of Mart.
Today we are have RBA, AUD looks like its gather power, currently price exepcting to come in zone and break of same expecting in this week.
CHF showing self weak and with other pairs, like CAD and GBP.
SUP zone: 0.55000
RES zone: 0.56200, 0.56600

EURCAD time for revers?
OANDA:EURCAD whats next, EC last one month we are have bullish run, currently price is in zone, technicals lower TFs are strong bearish, +we are have and BOC week before.
My view here is price is saturated and we can see fall now.
SUP zone: 1.57500
RES zone: 1.53900, 1.53400

GBPCHF still bullish to see?
OANDA:GBPCHF what's next, in first analysis (attached) highly accurate, we are have nice strong bullish push.
Long strong zone is breaked, technicals are still strong bullish, CHF still what can see is to expect bearish and with some other pairs.
Currently price is in ASCENDING CHANNEL, having good sup zones, personally here expecting one more bullish push.
SUP zone: 1.13800
RES zone: 1.15100, 1.15550

3/24/25Happy Monday
@ 9:45am we have news:
US Flash Manufacturing PMI
US Flash Services PMI
As long as this long trend line isnt broken, I will look for an entry at 3038 AFTER 10:00am

GBPJPY still bullish for expect
GBPJPY price is bounce 3 times on trend line, we are have and strong, long zone, which is be and breaked, we are not see some to long bullish push, price is revers what is done, currently from here expecting to see new bullish trend.
SUP zone: 190.150
RES zone: 194.250, 195.400

AUDJPY bullish continuation to expect
OANDA:AUDJPY trend based analysis, we are can see price is make break of zone on 11.Feb, its make strong bullish push, price is also break and CHANNEL pattern, currently price is on valid sup zone, technicals are strong bullish also. Personally here strong bullish expectations.
SUP zone: 96.200
RES zone: 98.100, 98.600

GBPJPY strong bearish expectations
GBPJPY CHANNEL pattern visible, price is break zone and here now expecting to see bearish strong push.
SUP zone: 192.100
RES zone: 188.000, 187.100

EURGBP new bearish?
OANDA:EURGBP we are have strong bearish push, currently we can see BEARIS HFLAG patter and zone is in BF, bouth are breaked, +price is bounce few times on strong sup zone 0.83600, here still higher bearish expecting.
SUP zone: 0.83600
RES zone: 0.82500, 0.82300

GBPCHF new bullish expectations
OANDA:GBPCHF trend based analysis, we are have CHANNEL pattern which is be breaked, price is make strong bullish push, at end now we are on new trend.
Price is in zone, its bounce few times, CHF showing self with many the weakest, on some other pairs can see bullish confirmations, here expect same soon confirm and new bullish push.
SUP zone: 1.12500
RES zone: 1.13500, 1.14000

GBPAUD new bearish expecting here
OANDA:GBPAUD strong bearish in last periods, currently price in zone, its bounce 4-5 times on SUP zone, looks like DIAMOND pattern here is created, based on past for me still here having enough bearish volumen gathered for one more push.
SUP zone:1.97800
RES zone: 1.95000, 1.94500, 1.93900

EURAUD complex structure, high chance for bearish push and break
OANDA:EURAUD analysis, complex structure which i love to see, price is break trend lines, its in ASCENDING CHANNEL, bouncing and on line of BEARISH FLAG pattern, currently moving in zone, AUD with many having strong bullish expectations for next periods.
Here having strong bearish expectations after long time of bullish push.
SUP zone: 1.67200
RES zone: 1.64900, 1.64200, 1.63200

AUDCHF price reversing,- new bullish?
OANDA:AUDCHF analysis, we are have ROUNDED TOP pattern, which is be confirmed last week on Friday, after Nonfarm and zone is be breaked.
But today on Monday, new week, can see price reversing and pushing again back in zone, after this moves expecting to see stronger higher bullish push in this week.
SUP zone: 0.56200
RES zone: 0.57000, 0.57200

New analysis on CADCHF
OANDA:CADCHF we are have bullish push in last periods, ASCENDING CHANNEL is visible, its be breaked, price is make push around 40PIPS and its start reversing at end my ex. analysis on CADCHF i am CANCEL.
Currently price again pushing on same zone from last idea-strong zone(violet line), +H&S pattern looks like will not be continued after its have confirmation, which for me here is one more sign for bullishness.
NOTE: Analysis on CADCHF before this one will be attached
SUP zone: 0.63200
RES zone: 0.64000, 0.64200

NZDCHF new bearish?
OANDA:NZDCHF in moment we are have break of zone and strong bullish push.
At end price is come again in zome, which can have strong bearish expectations. +And CUP and HANDLE pattern is created.
Currently after yesterday and todays events dont expecting here some big changes, still bearish expectations.
NOTE: My NZDCHF idea before this one is attached, having some other informations.
SUP zone: 0.51200
RES zone: 0.50500, 0.50300

NZDCHF still bearish expectations
OANDA:NZDCHF in moment we are have break of zone and strong bullish push.
Currently after yesterday and todays events dont expecting here some big changes.
Here now still bearish expecting
SUP zone:0.51300
RES zone:0.50500, 0.50300

EURCHF strong bullish expectations
OANDA:EURCHF in my EC idea before this one price is start moving bearish, at end i am make update and say will make new idea on OANDA:EURCHF when price start moving again bullish.
Today we have strong bullish push, price is come again in zone and SYMMETRICAL TRIANGL pattern is visible.
Technically on higher TFs are strong bullish, personaly strong bullish here
SUPP zone: 0.93500
RES zone: 0.94800, 0.95300

EURGBP whats next, continuation?
What next with OANDA:EURGBP , price is come back in zone, zone looks valid, strong and today we are have BOE rate cut, which is result with moving price back in zone, here personaly bullish,
can wait and for some pattern, or some consolidation above zone for better confirmation lvl.
SUP zone: 0.82500
RES zone: 0.83420, 0.83620

XAUUSD Overview (03-Nov)PEPPERSTONE:XAUUSD fell from 2780.
Watch 2740 for selling opportunities towards Zone 2.

US's Resilient Economy Attracts European InvestorsHello!
Chart Explanation & Indicators
EURUSD has been bearish since the weak higher high on 25 September. You find this level in the upper zone. When MACD crossed to the bearish side on 30 September, EUR started a spectacular crash into the bottom zone. EUR pierced the bottom zone and now sits on the trendline. Historically, EUR rallied from this trendline on 27 June and 02 August, as the red circles demonstrate. Rising trendlines, however, tend to break downward eventually. MACD has an active bearish cross and a definite bearish trend. Momentum is growing more hefty to the bearish side. Bears could target the white zone at $1.088 or lower.
Technical Zones
There are two horizontal, red rectangular zones on the chart. The upper zone and the bottom zone . The bottom zone contained support levels where the EUR could bounce on 16 August and 12 September and hit the resistances of the upper zone. However, the EUR lost the support zone. The bottom zone might have become another resistance. The price sits on a rising, red support trendline now. The next zone that might function as a support is around $1.088.
Conclusion
The setup suggests a short position. The price resting on a supportive trendline casts a shadow on the suggestion. The signal might be bearish, but the entry doesn't seem ideal. I'll wait for the setup to change for a new assessment or the price action to align with the setup to catch a neat entry.
Thankfully to all followers,
Ely
