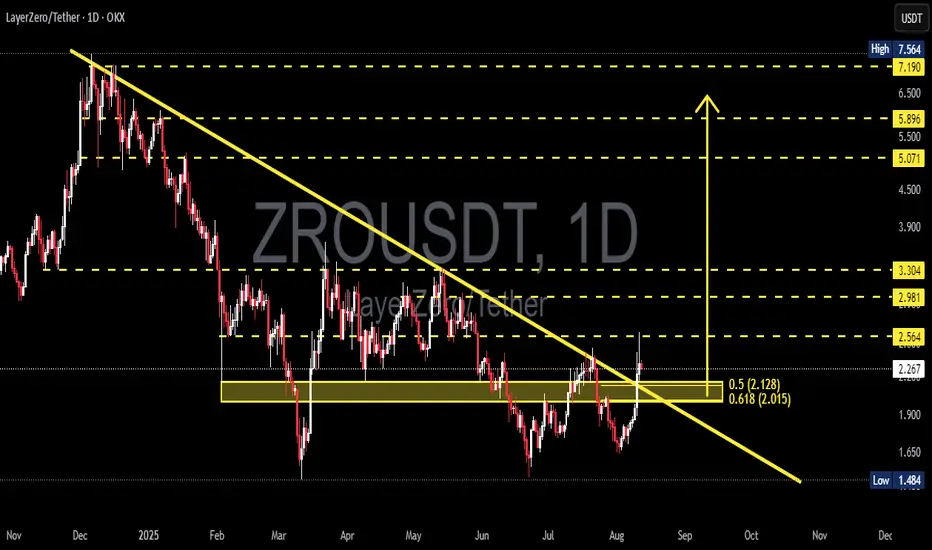
ZRO/USDT — Daily Breakout from Downtrend + Golden Fib Zone!Pattern & Structure
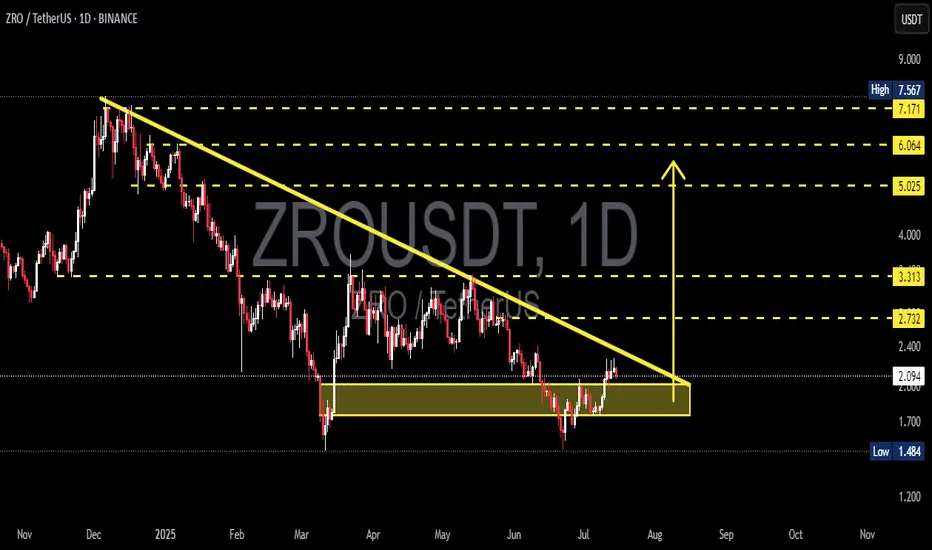
Medium-term trend: Clear downtrend since late last year (yellow diagonal line) with multiple touch points, making it a valid resistance line.
Breakout: Daily candle has closed above the downtrend line and above the yellow box (previous resistance zone). This is an early signal that medium-term selling pressure is weakening.
Golden Fibonacci zone: The yellow box marks the 0.5 = 2.128 and 0.618 = 2.015 retracement levels. This area acted as a supply/resistance and now becomes a potential retest zone (resistance turning into support).
Key horizontal levels (dashed lines):
Near-term: 2.564
Mid-term: 2.981, 3.304
Higher targets: 5.071, 5.896 (major resistance near 7.19)
Major structural low: 1.484
---
Bullish Scenario (if confirmed)
Main confirmation: Sustained daily close above the trendline + yellow box, ideally followed by upward continuation or a successful retest.
Possible target sequence:
First target: 2.564 → ~+12.8% from 2.273
Mid targets: 2.981 → +31.15%, then 3.304 → +45.36%
If momentum continues, possible extension toward 5.071 / 5.896 (>100% from current price).
Extra bullish sign: A retest of the yellow box (2.015–2.128) holding as support and forming higher lows.
---
Bearish Scenario (if failed)
Bearish invalidation trigger: Strong rejection in the breakout zone, followed by daily close back below the 0.5–0.618 range.
Downside risk levels:
Failed retest → drop to 2.128 (−11.4%).
Break below 2.015 → next major support 1.484 (~−34.7% from 2.273).
Losing the trendline + box would likely resume the downtrend.
---
Technical Notes
Breakout validation is key — one daily candle above is not enough, look for 1–3 days of follow-through or a clean retest.
Volume confirmation (not shown in this chart) is important; strong volume = stronger breakout.
Clear invalidation level: Below 0.618 (~2.015). Strong invalidation = 1.484.
Always consider overall crypto market sentiment to avoid false breaks.
---
> ZRO/USDT — Daily breakout from downtrend. Price broke above trendline and Fibonacci 0.5–0.618 (2.128–2.015). Confirmed retest = bullish; failed retest could send price back to 1.48. Not financial advice.
> Structure: Multi-month downtrend (yellow line) has just been broken. The yellow box = Fibonacci 0.5 (2.128) & 0.618 (2.015) cluster — now a key zone.
Bullish: Confirmed close above trendline + retest → targets at 2.564 (+12.8%), 2.981 (+31.2%), 3.304 (+45.4%).
Bearish: Rejection in this zone → back to 2.128 / 2.015 (−6% / −11%), and if broken → 1.484 (−34.7%).
Watch breakout validation, volume, and manage risk. Not financial advice.
#ZRO #ZROUSDT #crypto #cryptocurrency #TA #TechnicalAnalysis #Fibonacci #Breakout #Trendline #Altcoin #SupportResistance
ZROUSD
#ZRO/USDT#ZRO
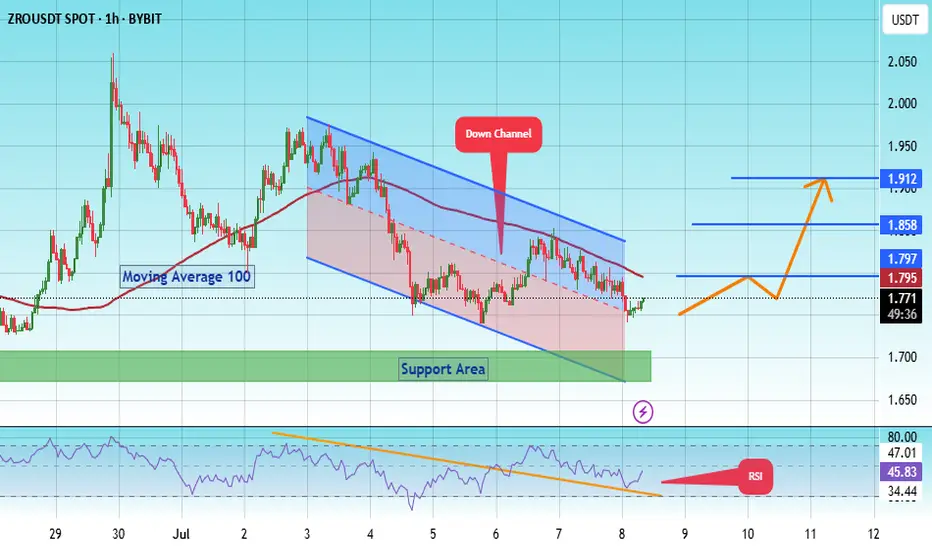
The price is moving within a descending channel on the 1-hour frame, adhering well to it, and is heading for a strong breakout and retest.
We have a bounce from the lower boundary of the descending channel, this support at 1.71.
We have a downtrend on the RSI that is about to be broken and retested, supporting the upside.
There is a major support area in green at 1.70, which represents a strong basis for the upside.
Don't forget a simple thing: ease and capital.
When you reach the first target, save some money and then change your stop-loss order to an entry order.
For inquiries, please leave a comment.
We have a trend to hold above the 100 Moving Average.
Entry price: 1.764
First target: 1.795
Second target: 1.858
Third target: 1.912
Don't forget a simple thing: ease and capital.
When you reach the first target, save some money and then change your stop-loss order to an entry order.
For inquiries, please leave a comment.
Thank you.

#ZRO/USDT#ZRO
The price is moving within a descending channel on the 1-hour frame, adhering well to it, and is heading for a strong breakout and retest.
We have a bounce from the lower boundary of the descending channel, this support at 1.71.
We have a downtrend on the RSI that is about to be broken and retested, supporting the upside.
There is a major support area in green at 1.70, which represents a strong basis for the upside.
Don't forget a simple thing: ease and capital.
When you reach the first target, save some money and then change your stop-loss order to an entry order.
For inquiries, please leave a comment.
We have a trend to hold above the 100 Moving Average.
Entry price: 1.764
First target: 1.795
Second target: 1.858
Third target: 1.912
Don't forget a simple thing: ease and capital.
When you reach the first target, save some money and then change your stop-loss order to an entry order.
For inquiries, please leave a comment.
Thank you.
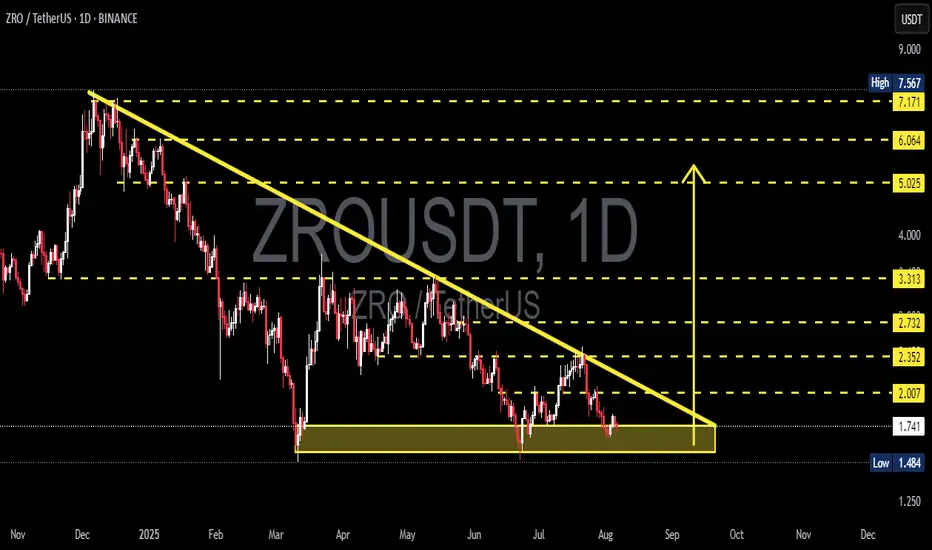
ZRO/USDT Coiled for a Major Move – Breakout or Breakdown?📌 Overview:
The ZRO/USDT pair is currently at a highly critical point. Price action has been consolidating within a large Descending Triangle for several months, and is now coiling near the apex — a classic signal of an incoming major move.
The strong support zone around 1.73 – 1.74 USDT has been tested multiple times and continues to hold, while the long-standing descending trendline from the all-time high acts as key dynamic resistance.
---
📊 Pattern & Market Structure Analysis:
🟡 Pattern: Descending Triangle
Flat horizontal support at ~1.73 USDT has acted as a demand zone.
Consistent lower highs suggest continued selling pressure and market indecision.
While typically a bearish continuation pattern, this setup can also lead to a bullish reversal breakout if resistance is breached with volume.
🧱 Key Support:
The highlighted yellow box shows clear accumulation, where buyers continue to defend the zone.
A breakdown below this support could trigger sharp downside movement and panic selling.
📉 Descending Resistance:
The downward sloping trendline is the critical breakout level.
A strong daily candle close above it would invalidate the bearish structure.
---
🚀 Bullish Scenario (Breakout):
If the price successfully breaks above the descending trendline with volume:
Short-term targets: 2.007 → 2.352 USDT
Mid-term targets: 2.732 → 3.313 USDT
Long-term bullish targets: 5.025 – 6.064 USDT and beyond
Additional confirmations: Volume spike, bullish RSI breakout, daily close above resistance.
---
🔻 Bearish Scenario (Breakdown):
If price fails to hold 1.73 USDT and breaks down:
Initial downside target: 1.484 USDT (historical support)
If that fails, ZRO may enter new low zones below 1.40
Breakdown with high volume would validate a strong bearish trend continuation.
---
🧠 Possible Strategies:
Breakout traders: Entry on daily candle close above descending trendline with volume.
Retest buyers: Wait for breakout, then enter on a successful retest of the trendline as new support.
Short sellers: Look for breakdown below 1.73 zone for short opportunities to 1.48 or lower.
Always use tight stop-loss based on volatility and support/resistance zones.
---
📈 Conclusion:
ZRO is at a make-or-break point. The market is coiling tightly within a Descending Triangle, and a massive move is likely just around the corner. Whether that move is up or down will depend on how price reacts to the descending trendline and the horizontal support.
Traders should stay alert and watch for either a confirmed breakout above the trendline, or a confirmed breakdown below the 1.73 USDT support level. The reaction here will set the tone for ZRO’s next big trend.
#ZRO #ZROUSDT #CryptoBreakout #TechnicalAnalysis #DescendingTriangle #AltcoinSetup #SupportAndResistance #CryptoChart #BreakoutWatch
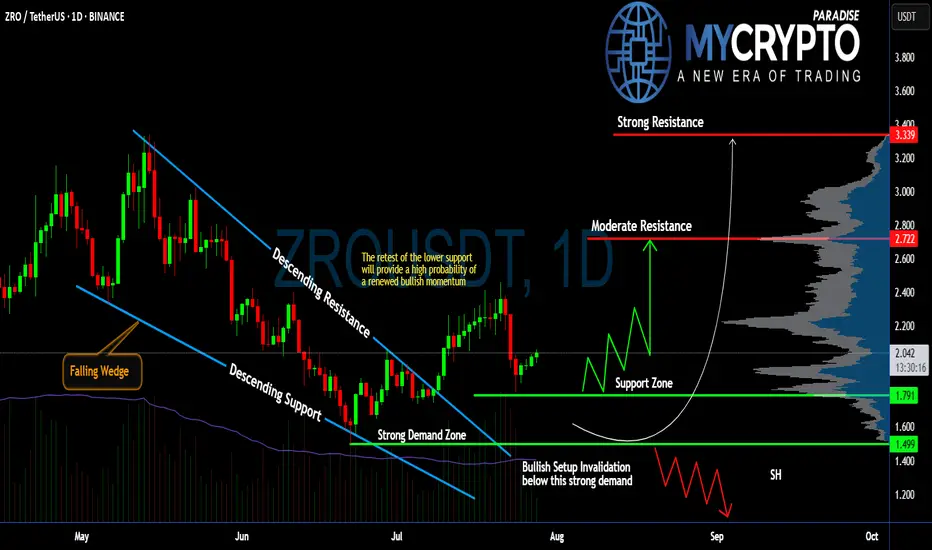
Will #ZRO Continue to Climb or Not? Must Watch For BullsYello, Paradisers! Are we witnessing the beginning of a powerful bullish reversal on #ZROUSDT, or is this just a fakeout setup? Let’s dissect this setup of #LayerZero:
💎After weeks of consistent bleeding, #ZRO has printed a classic falling wedge pattern, often a precursor to bullish reversals. This wedge has now been broken to the upside, with price currently trading around $2.037, suggesting renewed buyer interest following the breakout from descending resistance.
💎What’s crucial here is the retest of the wedge’s descending support, which aligns perfectly with a strong demand zone between $1.499 and $1.791. As long as #ZROUSD respects this zone, the probability of a bullish continuation remains high. This zone also serves as a clear invalidator for the setup—if price closes below $1.499, the bullish thesis will be off the table.
💎From here, if bulls can maintain control, we’re eyeing a potential move toward the moderate resistance at $2.722. That’s the first real hurdle where profit-taking or short interest could spike. A clean break above that level would open the path to the strong resistance around $3.339, where a heavy supply zone is likely to cap further upside.
💎Until then, we expect a series of zigzag corrections above the support zone before any sustained push higher. However, be cautious, losing the $1.499 support turns the structure bearish and could drag the price toward the $1.20 region, or lower.
Stay patient, Paradisers. Let the breakout confirm, and only then do we strike with conviction.
MyCryptoParadise
iFeel the success🌴
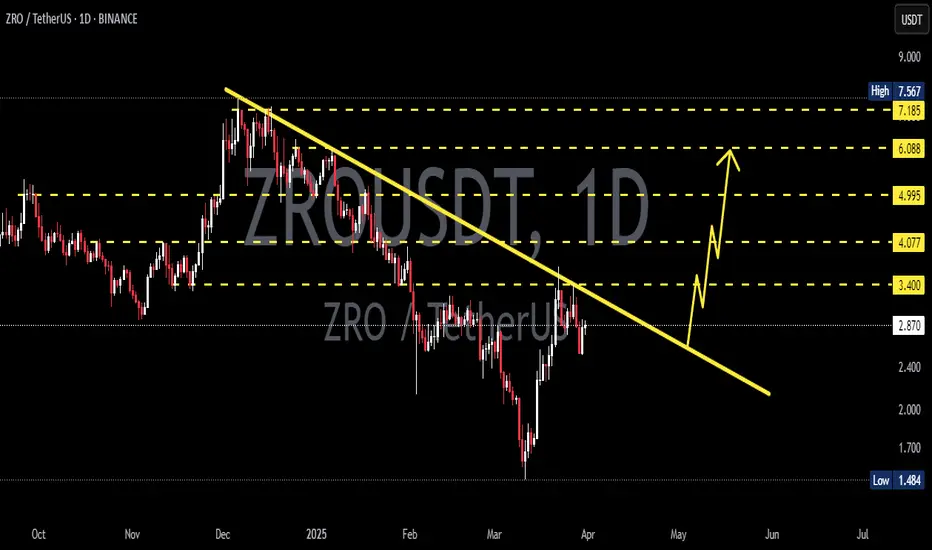
ZRO/USDT Breakout Watch – Ready to Rally After Being TrappedZRO is currently in a technically significant phase. After months of relentless selling pressure, the price action is now forming a classic Descending Triangle, and price is testing the upper boundary of this structure. A breakout from this zone could trigger a strong bullish reversal with multi-stage targets ahead.
🧩 Pattern Structure & Price Action:
📐 Descending Triangle (Potential Reversal)
Lower Highs have been forming since November 2024.
Strong horizontal support at $1.90 – $2.00, tested multiple times.
Price volatility is compressing, which often precedes a breakout.
This pattern is often considered bearish, but in this extended downtrend context, it can become a bullish reversal pattern if price breaks out to the upside with strong volume.
📊 Key Zones & Target Levels if Breakout Happens:
1. 🔹 $2.30 – Breakout confirmation zone (trendline break).
2. 🔹 $2.73 – Minor resistance from previous structure.
3. 🔹 $3.31 – Strong psychological and historical resistance.
4. 🔹 $5.02 – Primary breakout target based on pattern height.
5. 🔹 $6.06 – $6.50 – Mid-term extension target based on Fibonacci and prior supply zone.
6. 🔹 $7.17 – $7.56 – Extended bullish target in case of strong rally continuation.
🟢 Bullish Scenario:
If price breaks out with a strong daily close above $2.30 accompanied by volume:
Buyers gain control.
Descending triangle becomes a launchpad for upward momentum.
Gradual rally toward $5 and beyond becomes very likely over the next few weeks.
🔴 Bearish Scenario:
If price fails to break the resistance and instead drops below $1.90:
Price could fall toward $1.60 as near-term support.
If bearish pressure continues, price may test the $1.48 support zone (previous local bottom).
Structure remains bearish until significant buying pressure returns.
🧭 Conclusion:
ZRO is at a critical decision point. A clean breakout from this pattern could be the beginning of a major recovery rally. However, failure to break resistance could lead to another leg of consolidation or downside. This is a high-opportunity setup for traders watching for volume and confirmation.
#ZRO #ZROUSDT #CryptoBreakout #TechnicalAnalysis #AltcoinSeason #CryptoTrading #DescendingTriangle #ReversalPattern #ChartAnalysis
#ZRO/USDT#ZRO
The price is moving within a descending channel on the 1-hour frame and is expected to break and continue upward.
We have a trend to stabilize above the 100 moving average once again.
We have a downtrend on the RSI indicator that supports the upward move with a breakout.
We have a support area at the lower boundary of the channel at 1.65, acting as strong support from which the price can rebound.
We have a major support area in green that pushed the price higher at 1.58.
Entry price: 1.69
First target: 1.75
Second target: 1.82
Third target: 1.90
To manage risk, don't forget stop loss and capital management.
When you reach the first target, save some profits and then change your stop order to an entry order.
For inquiries, please comment.
Thank you.

#ZRO/USDT#ZRO
The price is moving within a descending channel on the 1-hour frame, adhering well to it, and is heading towards a strong breakout and retest.
We are experiencing a rebound from the lower boundary of the descending channel, which is support at 2.10.
We are experiencing a downtrend on the RSI indicator that is about to be broken and retested, supporting the upward trend.
We are heading towards stability above the 100 Moving Average.
Entry price: 2.16
First target: 2.21
Second target: 2.23
Third target: 2.26

#ZRO/USDT#ZRO
The price is moving within a descending channel on the 1-hour frame, adhering well to it, and is heading toward a strong breakout and retest.
We are experiencing a rebound from the lower boundary of the descending channel, which is support at 2.34.
We are experiencing a downtrend on the RSI indicator that is about to be broken and retested, supporting the upward trend.
We are heading toward stability above the 100 Moving Average.
Entry price: 2.36
First target: 2.40
Second target: 2.44
Third target: 2.48

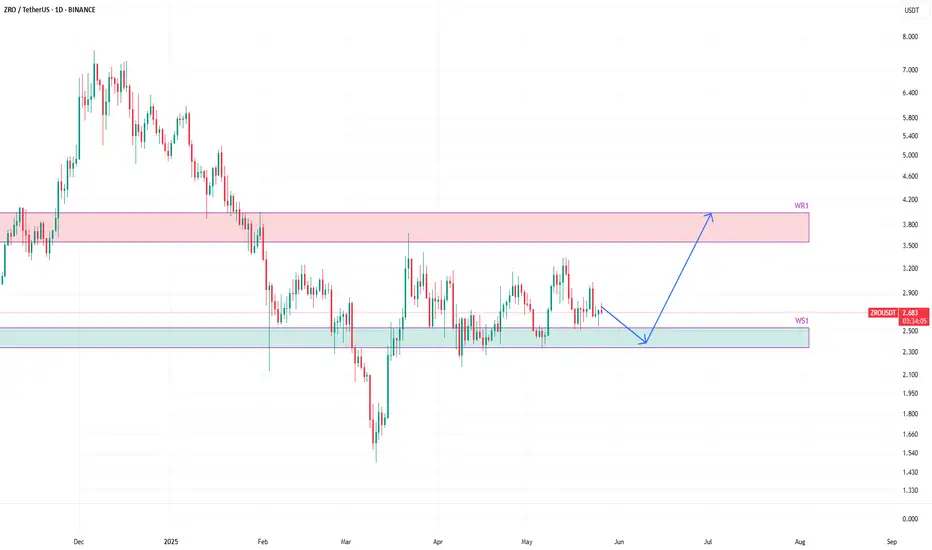
ZROUSDT to bounce from weekly supportZROUSDT is currently ranging between weekly resistance WR1 and weekly support WS1.
I expect the price to trade in this range, more around WS1, and then dip into WS1 before boucing towards WR1 zone.
Therefore, any dip into the WS1 zone presents a good long opportunity.
ZRO (LayerZero) Fresh coin. 19 05 2025Logarithm. Time frame 3 days. The creators of the cryptocurrency "threw" a huge number of their flock, and distributed an airdrop of "pennies", thereby reducing the price burden on themselves in the bearish trend of altcoins. Therefore, this cryptocurrency, unlike others, has a stronger chart, and the decline was only -80%. This is quite small, considering that the capitalization is in 170th place at the moment.
I specifically superimposed 2 channels on top of each other, ascending and descending. There were a lot of lines, but these dynamic support / resistance will be felt by the price in the future.
🟣 Now a triangle is being formed locally , it rested against the downward local trend, from its breakthrough / non-breakthrough, and depends on which global channel the market will be pulled on an average urgent basis. Sorry, the price of this cryptocurrency.
🟢 Local targets of the triangle , which can become an ascending pennant are shown on the chart.
🔴 Also, a descending target is shown, if the trend is not broken and the triangle works down.
Fundamental (not a legend). LayerZero supports any blockchain that can run smart contracts, such as Ethereum, BNB Chain, Avalanche, Polygon, Arbitrum, Optimism, Fantom and other chains. LayerZero also supports non-EVM chains, such as Aptos. These so-called omnichain applications should become a key layer of the multi-chain future, where different blockchains interact simultaneously.
It is worth noting that the fundamental does not really matter, and cryptocurrencies move (rationality of creators and market maker + real supply/demand) in accordance with the market as a whole, with very rare exceptions, which, as a rule, have a manipulative nature and a very short time.
Also, it is worth noting that when the altseason begins, this cryptocurrency can be greatly pumped up, given the emission of cryptocurrencies in one hand, and the real demand in the future for this protocol for different blockchains.

#ZRO/USDT#ZRO
The price is moving within a descending channel on the 1-hour frame, adhering well to it, and is heading toward a strong breakout and retest.
We are seeing a bounce from the lower boundary of the descending channel, which is support at 2.41.
We have a downtrend on the RSI indicator that is about to be broken and retested, supporting the upward trend.
We are looking for stability above the 100 Moving Average.
Entry price: 2.69
First target: 2.82
Second target: 2.98
Third target: 3.17

ZROUSDT 1D AnalysisZRO ~ 1D Analysis
#ZRO Buy back gradually from here if you still have confidence in this coin with a short term target of at least 10%++ from here.

#ZRO/USDT#ZRO
The price is moving within a descending channel on the 1-hour frame, adhering well to it, and is heading for a strong breakout and retest.
We are experiencing a rebound from the lower boundary of the descending channel, which is support at 2.85
We are experiencing a downtrend on the RSI indicator that is about to be broken and retested, supporting the upward trend.
We are looking for stability above the 100 Moving Average.
Entry price: 2.87
First target: 3.052
Second target: 3.211
Third target: 3.423

#ZRO/USDT#ZRO
The price is moving within a descending channel on the 1-hour frame, adhering well to it, and is heading for a strong breakout and retest.
We are seeing a bounce from the lower boundary of the descending channel, which is support at 2.38.
We have a downtrend on the RSI indicator that is about to be broken and retested, supporting the upward trend.
We are looking for stability above the 100 moving average.
Entry price: 2.46
First target: 2.533
Second target: 2.636
Third target: 2.75

#ZRO/USDT#ZRO
The price is moving in a descending channel on the 1-hour frame and is expected to continue upward.
We have a trend to stabilize above the 100 moving average once again.
We have a downtrend on the RSI indicator, supporting the upward move with a breakout.
We have a support area at the lower boundary of the channel at 2.95.
Entry price: 2.98
First target: 3.04
Second target: 3.10
Third target: 3.19

#ZRO/USDT#ZRO
The price is moving within a descending channel on the 1-hour frame and is expected to break and continue upward.
We have a trend to stabilize above the 100 moving average once again.
We have a downtrend on the RSI indicator that supports the upward move with a breakout.
We have a support area at the lower limit of the channel at 2.284, which acts as strong support from which the price can rebound.
Entry price: 2.92
First target: 2.98
Second target: 3.10
Third target: 3.20

#ZRO/USDT#ZRO
The price is moving within a descending channel on the 1-hour frame and is expected to break and continue upward.
We have a trend to stabilize above the 100 moving average once again.
We have a downtrend on the RSI indicator, which supports the upward move by breaking it upward.
We have a support area at the lower limit of the channel at 2.60, acting as strong support from which the price can rebound.
Entry price: 2.68
First target: 2.72
Second target: 2.77
Third target: 2.84

ZRO: Altcoin hero?If you find this information inspiring/helpful, please consider a boost and follow! Any questions or comments, please leave a comment!
ZRO is worth keeping on the radar. Out of most altcoins it arguably has the cleanest setup for a potential bullish reversal—at least structurally.
While it could be done here, I’m leaning on the idea that the Y wave still needs one more leg down. That’s typically the behavior we see: Y waves tend to be slower and more drawn out compared to the W wave. If that holds true again, the ideal target zone falls between $2.12 and $1.88. That would allow for a proper test of structure while staying within the bounds of the larger corrective patterns most likely target.
This is still a bullish interpretation—but only after one more low and a meaningful reaction from it.
That said, both the bull and bear counts are pointing down in the near-term. My personal invalidation sits above the (c) wave high. If ZRO clears that, this setup likely needs to be re-evaluated. Until then, any move beyond the orthodox end of wave A of the Y leg should be considered “enough” from a pattern swing perspective.
Patience here could pay off—especially if price enters the key zone and shows strength.
Trade safe, trade smart, trade clarity.

ZRO Bullish Setup | Time to Buy? (4H)Since the red arrow was marked on the chart, ZRO has shown signs of entering a bullish phase.
Wave A appears to have completed, and the price is now developing into wave B, which is unfolding as a diagonal (diametric) structure. At the current stage, we are likely in the early movement of wave g, a corrective bearish leg within this larger structure.
Key Buy Opportunity:
We’re closely watching the green support zone as a potential bullish reaction area. If price action confirms, this level may offer a prime long/buy setup with a favorable risk-reward ratio.
Invalidation Level:
A daily candle close below the invalidation level will invalidate this bullish scenario.
For risk management, please don't forget stop loss and capital management
When we reach the first target, save some profit and then change the stop to entry
Comment if you have any questions
Thank You

ZROUSDT - AN OPPORTUNITY!in LTF it consolidated a descending channel pattern and looks like it bottomed
buying now is an opportunity!
BUY BETWEEN: 2.45 - 2.22
TARGETS: 2.60 - 2.80 - 3.00 - 3.60 - 4.80
STOPLOSS: 1.8

ZROUSDT – Short SetupI'm taking a short position on #ZROUSDT after a Break of Structure (BOS) confirmed a shift in market direction, following a Change of Character (Choch).
Price retraced into the 15-minute Fair Value Gap (FVG) and tapped into the premium zone near the 0.5–0.618 Fibonacci level, offering a good entry for a short setup.
Entry: Around 2.98
Stop Loss: Above 3.07
Target: 2.88 - 2.8 - 2.67
Risk/Reward Ratio: 1:3.4
Waiting for follow-through to the downside. Trade safe and always manage your risk.

ZROUSDT 1DZRO ~ 1D Analysis
#ZRO Buy gradually after successfully penetrating this resistant line with a short -term target of at least 10%+.