ZRX head and shoulders#ZRXUSDT
$ZRX shaped inverted head and shoulders pattern in weekly and daily time frames.
the daily H&S is inside the right shoulder of weekly one.
target of daily H&S is around $1.45 (45%)
target of weekly H&S is around $1.86 (87%)
Zrx

ZRXUSDT keep an eye on this scriptIN coming days it can give good breakout from current level .stoploss would be very small and target is very big.

ZRXUSDT LongZRX is in a short-term uptrend and is currently breaking through a long-term downtrend. Hopefully I've made it clear enough in the analysis. :))

"Good old boy"After a long time of consolidation, the ZRX is in a troublemaker which, due to the continuation of the bull market, will be broken upwards, which is additionally confirmed by the MACD and RSI chart.
In my opinion, as soon as new capital flows into BTC and BTC's dominance stops growing, we will see a fourth wave of growth on Alt coins.
The first stop of the new growth wave in my opinion will be the level 0d 5-6.5 $. Because there is the top of the model channel, which previously stopped the growth several times.
BTC after exceeding $ 100k will surely see another upward correction (fast and dynamic), so at this point, if there is a correction, I think that a strong support on the ZRX will be the level of $ 1.8-2.2.
Later (the worst scenario due to the far time horizon) we can see the last wave of growth on Altach which will amount to over $ 10 + (similar to January 2018. Will it happen?
Previous analyzes:

ZRX: when the reversal?As I anticipated the 28th of September ZRXBTC didn't promise well and unfortunately I was right (I say unfortunately because I'm a holder). As you can see the triangle broke downward and price is currently testing the first support.
At 1h and in some cases at 4h I see bullish DIVs on various indicators (MFI, CCI, RSI etc....) however for such divergences to play out on macro scale we usually need them appear at daily timeframe. However what will happen depends also from BTC itself. I think it'll retrace very soon, if this happens ZRXBTC will retrace as well but will recover right after. If I'm wrong and BTC will keep pumping the current ZRX support will be broken.
Notice I'm not showing the target according with theory as it'd be a -147% from breaking point and I don't think we'll get there. To be honest I don't think we'll even get to the bottom support of the triangle (yellow non-dashed line).
My idea is that price will reach next support (1442 sats) and then range between the two supports until the reversal will start. Usually this is what happens when such patterns break down, the usual shape of the chart is like a small cup which starts going up. This process might take several weeks from now.
We'll see if I'm right. If you wanna enter wait for the dip

ZRX / USD - early DeFi project cup and handle weekly chartThis chart is hard to ignore - I am pretty sure what I'm seeing here is likely given the aggregate indicators. What do you think?


ZRX - BREAK OUT AND RETEST AND PUMP!Candles are giving us that expectation. If the price closes above the downtrend. We can expect this to be the real breakout!
This is the downtrend line since April. 10 months and five bounces.
After breaking will be a real strong uptrend. I wait for that.
We wait for the confirmation closing candle of tomorrow to enter the order.
Target: Moon!
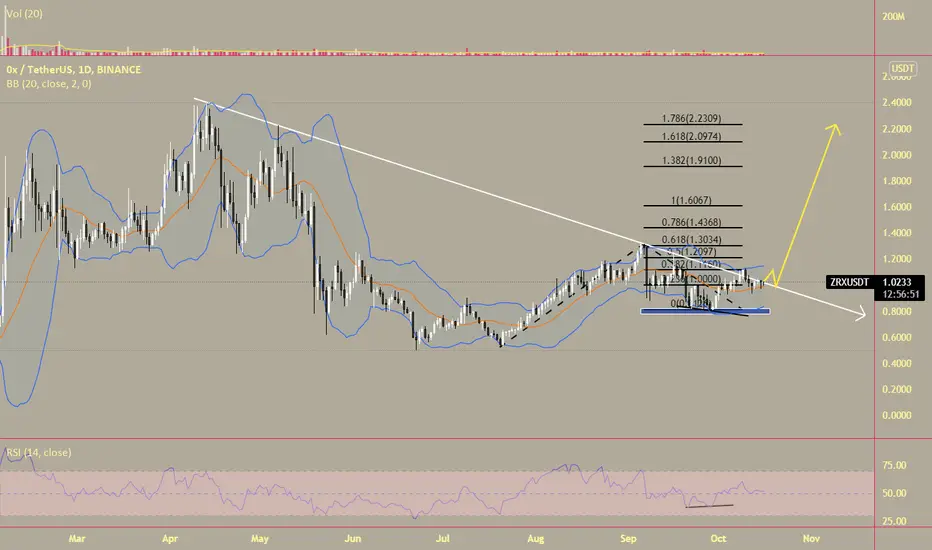
ZRX/USDT SHORTLook like a good short on 4h time frame, take profit under the big yellow line
stop loss - 1.0370
Good luck.
NFA and DYOR

ZRXUSDT Daily TimeframeSNIPER STRATEGY (new version)
It works ALMOST ON ANY CHART.
It produces Weak, Medium and Strong signals based on consisting elements.
NOT ALL TARGETS CAN BE ACHIEVED, let's make that clear.
TARGETS OR ENTRY PRICES ARE STRONG SUPPORT AND RESISTANCE LEVELS SO THEY CAN ACT LIKE PIVOT POINTS AND REVERSE THE WAVE (or act like a mirror that can reflects light) BASED ON STRENGTH OF THAT LEVEL.
ENTRY PRICE BLACK COLOR
MOST PROBABLE SCENARIOS TARGETS GREEN COLOR
LEAST PROBABLE SCENARIOS TARGETS RED COLOR
DO NOT USE THIS STROTEGY FOR LEVERAGED TRADING.
It will not give you the whole wave like any other strategy out there but it will give you a huge part of the wave.
The BEST TIMEFRAMES for this strategy are Daily, Weekly and Monthly however it can work on any timeframe.
Consider those points and you will have a huge advantage in the market.
There is a lot more about this strategy.
It can predict possible target and also give you almost exact buy or sell time on the spot.
I am developing it even more so stay tuned and start to follow me for more signals and forecasts.
START BELIEVING AND GOOD LUCK
HADIMOZAYAN

ZRX/USD (Weekly)- Targets are clear on the chart based on Fibo Levels
- You can enter after breaking the downtrend trend line and retest
- Base line 103 (Ichimoku) can be a great dynamic support or resistance line
- $0.85 is a good area for set your order imo
- NFA
---------------
All Time High USD
Jan 09, 2018 (4 years ago) $2.53
57.24%
All Time Low
Aug 16, 2017 (4 years ago) $0.104
941.13%
0x ROI
868.79%
---------------
All Time High BTC
0.00021900
---------------
Market Rank #107
---------------
0x Supply
Circulating Supply 845,341,602 ZRX
Total Supply 1,000,000,000 ZRX
Max Supply 1,000,000,000 ZRX
---------------
Market Cap $914,979,050.65
7.31%
Fully Diluted Market Cap $1,082,377,879.79
7.31%
---------------

The opportunity in ZRXThe opportunity in ZRX
The entry point is 1.12 -1.15$
First target 0.6$
second target 2.1$
third target 2.3$
Forth target 2.9$
Fifth target 0.39$

ZRX about to break trend lineZRX (0x) is about to break trendline, opportunity to trade with good risk reward.
Best entry points on trendline breakout/retest

🆓0x (ZRX) Oct-6 #ZRX $ZRXZRX has good support at 1$ zone and is heading to 1.2$, 1.6$ and 2$ zones in this October. But if it loses this zone, it will fall down to 0.85$ zone
📈RED PLAN
♻️Condition : If 1-Day closes ABOVE 1$ zone
🔴Buy : 1
🔴Sell : 1.2 - 1.6 - 2
📉BLUE PLAN
♻️Condition : If 1-Day closes BELOW 1$ zone
🔵Sell : 1
🔵Sell : 0.85
❓Details
🚫Stoploss for Long : 10%
🚫Stoploss for Short : 5%
📈Red Arrow : Main Direction as RED PLAN
📉Blue Arrow : Back-Up Direction as BLUE PLAN
🟩Green zone : Support zone as BUY section
🟥Red zone : Resistance zone as SELL section
🅰️A : The Close price of 1-day candlestick is Above the zone
🅱️B : The Close price of 1-day candlestick is Below the zone

🆓0x (ZRX) Sep-18 #ZRX $ZRXThe buying force is coming back to ZRX and ZRX could move up to 1.3$, 1.6$ and 2$ in late September and early October. But if it loses this 1.05$ zone, it will fall down to 0.9$ or even 0.7$ zone
📈BUY
🔴Buy : 1.025-1.075$. SL if B
🔴Buy : 1.27-1.33$ if A. SL if B
📉SELL
🔴Sell : 1.27-1.33$. SL if A
🔴Sell : 1.56-1.64$. SL if A
🔴Sell : 1.95-2.05$. SL if A
♻️BACK-UP
🔵Sell : 1.025-1.075$ if B. SL if A
🔵Buy : 0.88-0.92$ if A. SL if B
🔵Buy : 0.68-0.72$. SL if B
❓Details
📈Red Arrow : Main Direction as BUY and SELL section
📉Blue Arrow : Back-Up Direction as BACK-UP section
🟩Green zone : Support zone as BUY section
🟥Red zone : Resistance zone as SELL section
🅰️A : The Close price of 1-day candlestick is Above the zone
🅱️B : The Close price of 1-day candlestick is Below the zone

$zrx in infinity harmonic Price and time are bound by geo-mathematics as a function of universal law.
there is no scenario where this law can be broken

ZRX/USDT SELL SIGNALThe current pullback can be interesting for sellers, although it might be extended further, thus might provide a much better RR ratio. But overall, this ZRX remains bearish in the short to medium term.


ZRX Buy OpportunityZRXUSDT looks strong, EMA is on top of the long time support. 0.38 Fib level just breaked out with a strong volume. I do believe next stop is the golden pocket, 1.68. Enjoy the ride. Put your stop loss around 1.10

ZRX/USDT - Potential 90% setup Hello Traders!
ZRX price is consolidating in the range of $1.04 - $1.16
On the daily timeframe, MA100 is in support, RSI indicator is in the bullish zone.
Volumetric and cluster analysis shows an increase in demand from buyers.
Buy entry can be looked for in two ranges:
1) At current levels of $1.04 - $1.16
2) In case of correction at $0.82 - $0.94.
It is important to consider risk management and always keep some funds for correction.
Stop-loss shall be placed under the $0.75 price level.
Targets for ascending price movement:
$ 1,28
$ 1,61
$ 1,92
$ 2,20
Good luck and watch out for the market
P.S. This is an educational analysis that shall not be considered financial advice

I leave that in the roomThe herd will buy in 5-700% +
Everybody was hyped at shiba when it had its all time high. So many guys lost money.
Now its down by 90%, and it didn't do nothing for a while. Its extremely not trendy right now. The abandoned dog will strike back intensely and sharply.
NOW is a great entry point cause cmon, you really think everything skyrockets and shib wouldn't have a second phase? Kind of naive right?
But that's just my opinion, you don't have to believe me.


ZRX Approaching Key Resistance Attempting a key level after an initial rejection. Waiting for a BCR within the cyan box for an entry to ride up to multiple targets. Depending on how bullish the overall crypto market is, we could see this take us beyond target three. Will reassess if we get there.
Don't enter without a retest.
