ZRX Ichimoku Cloud Resistance Plus Retest of 50MA...ZRX could be ready to test the 50MA, but is being held back by the Ichimoku Cloud resistance border. 10055 sats is the possible retest area, MACD is showing a slight movement to the upside after crossing towards the Green zone.
Zrx

$ZRX 0x; Waiting for catalyst This one just needs a little momentum to break this longterm downtrend. Once that happens it could see substantial price growth, but I'm monitoring for now.

long term ZRX - BUY IT UP!ZRX is forming a ascending triangle on the 4hr chart, which is a bullish pattern. on the 4hr chart ZRX was respecting the 200 EMA - however since breaking that, it is now respecting the 50 EMA on the 4hr chart. As we have hit the bottom of the ascending triangle its a good time to buy & lock in them profits. if we break to the upside of the ascending triangle 1st target for profits is 10950 SATS

ZRX - Getting ready for more upside! ZRX has bounced nicely since hitting a short-term bottom at 7300 and it trying to test the highs above. ZRX does have a possible upcoming catalyst with a Coinbase listing and with yesterdays news of Coinbase allowing more coins to request listings, ZRX has turned very bullish and could be set for more gains if Bitcoin can get above this resistance level.
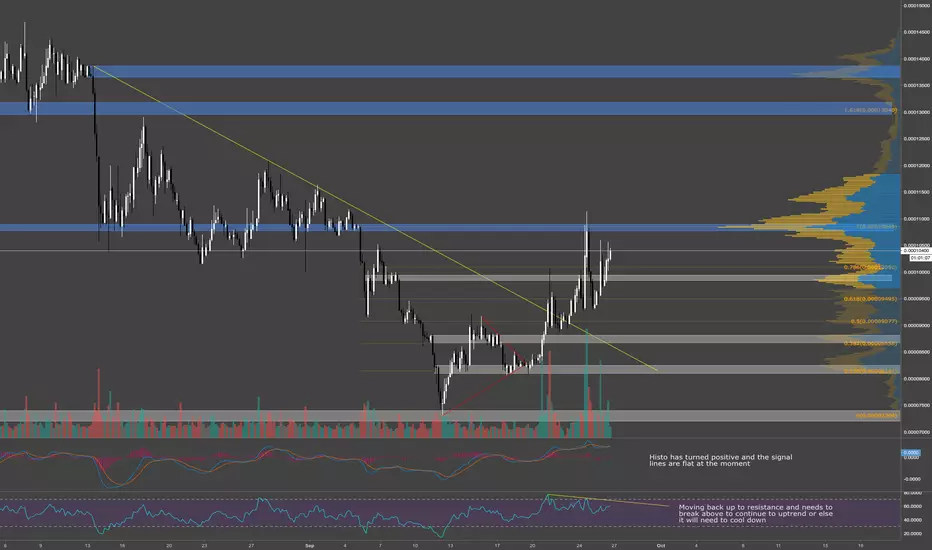
RSI still has room to move up before hitting resistance so we can get one more test of resistance before moving down. MACD histo has turned positive and signal lines are flat above median so far. Would be smart to wait for some type of move before entering a position because we are currently in a no-trade zone.
Thanks guys!
Is Coinbase about to announce?I know this is pretty sketchy.. but the amount of time from when Coinbase announced ETC and the time before they added it is close to the amount of time we've been waiting for the ERC20 coins to be added (ZRX and BAT in my opinion). I assumed they would wait until BTC started to move up, and because we are getting close to a possible ETF announcement... well.. I'm feeling something in the air. Also, Coinbase Pro just tweeted that they are going to perform a scheduled maintenance tonight at 9PM PT. I get that I'm reading too much into it and all, but they did the maintenance run just before the ETC coin was added.. so...
This is just speculation, but I think something is about to happen...
Just wanted want to give a little hope... it's been a long 9 months or so... it's our time.
ZRXBTC
BATBTC
p.s. Please consider giving me a thumbs up or a follow if you feel this is helpful
Enjoy Family

ZRX Possible Coinbase listing.. NOT AN ANALYSIS, A PREDICTION..ZRX has been flirting with Coinbase for a few months now. This could happen and if so, I believe this is where we will stand.

ZRX Stumbling point at $0.68ZRX finds resistance at $0.68. A daily closure above this zone and we could see (Red Zone) $0.81. But pressure of Bitcoin falling ZRX could be seeing $0.45 again (Green Zone) but with the Coinbase rumour swirling around we could see a major run to ATH for ZRX soon. Possible $5...

ZRXBuy Price: Yellow Line
TP: Green Lines
Invest Suggestion: 5-10 Percent
Profit Expectations: 5, 10 or >20 Percent
Just hold and watch. All targets will be reached within 24 to 72 hours as my prediction. But it's recommended to hold it for 6-7 days if any target not reached. I am sure, you will be get nice profit. Good Luck!
Thanks for visiting.

[ZRXBTC] 0x Protocol - Ride The Next Wave [130% PP]0x (ZRX) is "An Open Protocol For Decentralized Exchange On The Ethereum Blockchain". This is one of the most famous projects within the cryptocurrency industry, many people love it. So here is a trade by request of one of our PREMIUM supporters, I hope you enjoy it.
We are going to trade this like any other atlcoin. We will look at the charts and trade according to the signals we get. We have a buy in range to better guide you as to when to buy into this trade. We are going to have targets, so that you can know exactly when to sell, and finally, a stop loss, in case the trade goes wrong. If that happens, we get stopped and go out only with a small loss. We have huge potential, with very, very low risk. That's because the market has been in bear mode for quite a while, so we are using a tight stop loss, with things turning around, the potential is big to go up, we are getting signals from all across the board.
We are about to experience a new wave up... Let's start with the weekly chart:
Notice how a wave up follows each wave down, which is normal market behavior.
We are at the end of a wave down, based on the candlestick formation, chart structure, market cycle, volume and indicators. You can also see the chart yourself, you can see how a wave up follows each wave down. Just as a wave down follows a wave up... regardless of what is happening in the market. Sometimes we have long wave down, some other times we have long waves up... Namaste... Let's continue with our trade.
Now a closer look at the chart, let's look at the daily time frame; 24 hours per candle. This is good for practice and learning, let's see what we can spot from my favorite signals:
First you can notice the descending channel, red, on the chart above. You can see that after the #4 red candle, ZRXBTC price has been going up. ZRXBTC is now also trading above EMA10 (blue line).
The #4 red candle, which is a hammer and where the lowest price was hit. Also coincides with the bullish divergence on the MACD followed by above average volume. All these signals point to additional bullish action.
The RSI is at its highest since August and the STOCH is on the bullish side and trending up. All these bullish signals are asking us to open a position and trade this coin. Understood... Let's trade.
Trade instructions by Alan Masters
Buy in:
(1) 0.0000900 - 0.0000940
Targets for 0x (ZRXBTC) for Alan Masters followers:
(1) 0.0000997
(2) 0.0001161
(3) 0.0001291
Note: As soon as we hit our first target, we raise our stop loss above buy in price. This keeps us in profits once our trade starts to develop.
To learn more about how to sell the targets, read our "Sell for profits" articles by clicking on the "Education" tab.
Note: Not all targets are meant to be reached. These numbers are for reference only. Sell as soon as you feel confortable with your profits. You can sell at anytime you want, any amount you want.
Stop loss:
(1) Close daily below 0.0000795
Capital allocation: <10%.
I hope you enjoy this trade.
Thanks a lot for reading.
Your support is highly appreciated.
And remember... it doesn't matter what happens, YOU DESERVE THE BEST!
Namaste.

ZRX Swings...ZRX has had Two big swings and is looking for a third swing, looking to set up towards $1.20. Next resistances stands at $0.85.

ZRXUSD: RSI, HMA, Takashi Bows -> LongHello,
below I see a favorable setup for ZRXBTC for the short-mid term.
1. Takashi bow signals a buy signal
2. The daily closed significant above 80 Hull moving average (HMA) this signals a mid term change in direction of the trend
3. The RSI left the overbought zone, the previous 2 times this was the start of a mid term run
4. currently at strong support established since April
The 38% and 61% fibonacci zones are good target zones to take partial profit in my opinion
Attention BTC is currently at a resistance and can retrace a bit. Later it can continue it's short term run towards the 7K levels before getting potentially rejected at 200 MA again or the established downtrend since mars as I noted in previous BTC analysis's.
A potential BTC rejection would most probably take away the momentum of our ZRXBTC trading pair.
I'm looking forward to your feedback.
keep in mind: no financial advise.


Daily Bullish Signal #ZRX #ZRXBTC (21-09)#ZRX (ZRX/BTC)
Buy : 8700-8900
Flash Sell : 9200
Short Sell : 9400
Long Sell : 9500-10000-10500-11000
Stop : 8100
Follow me for more signals daily
Inbox me if you need help or learn to trade

ZRXBTC near a major pivot in time, Law of VibrationGann's LAw of Vibration chart for ZRXBTC
the center of this cycle is nearly complete, with prices near its major swing lows and within the 90-99 day Gann Cycle, prices have a high probability of reversing at this level, retracing at least 150% of the current value higher - a violent move higher.

ZRX target 30USD ++ in 2019 MOONWe are on the verge of a new euphoric bull market. Look here:
In a bull market everything is positively correlated to BTC, but altcoins grow much faster, so it's better to focus on them.
ZRX has been one of the strongest coins throughout the bear market.
It's a protocol for creating decentralised exchanges which is probably one of the greatest problems to be solved in crypto space right now.
Binance, Bitfinex and other exchanges had more than $1.5B pure profit each in 2017. ZRX is attacking this space. If they succeed market cap can be much higher than of all of the centralised exchanges combined.
Great team solving real problems. What can go wrong?
Lots of possible catalysts. Joining Coinbase, Ethfinex potential success and much much more.
My thesis is that BTC will go to the moon and ZRX will be one of the leaders of the coming bull market.

ZRXBTC - 4H - UpdateZRX has seen a nice runup since tapping into the demand zone around 7400 but seems to be breaking down from the triangle. Overall, with some alts starting to look bottomed out barring a BTC meltdown and possible coinbase listing soon, ZRX seems like a strong pick for a long.
RSI and MACD seem to be turning up showing positive momentum and we are currently sitting right at the demand zone, which has held well so far. For the more adventurous traders, placing a long order in this demand zone could be a good play, targetting the top of the triangle as a take profit. For the more conservative traders, waiting for a pullback back down to the lower demand area could end up avoiding the loss from a break of current levels on a BTC move lower. Both stops would be placed below the SFP lows and targets are outlined in the chart.
Please hit the 'like' button and give us a follow!
Let us know what you think below!
Thanks

Bullish Signal for #ZRX #ZRXBTC (10-09#ZRX (ZRX/BTC)
CAN PUMP HARD
Buy : 9000-9050
Flash Sell : 9100-9200-9300-9400-9500
Short Sell : 10000-10500-11000-11500-12000
Stop : 8800
Follow me for more signals
PM me if you need help

ZRX market structure tradingZRX looks bearish for the time being. Ever since its taken out 13401 satoshis (market structure shift level), its proceeded to make lower lows and lower highs indicated by the red boxes. Simple market structure trading. It had a nice little bounce at the demand zone around 9791 satoshis, but couldn't breach the resistance level preceding it. Take short trades on this with caution. If it doesn't bounce at current price levels, and cannot breach above 9791 satoshis should see accelerated selling once again towards the red line which is where i'll be taking profits. You can ultimately take profits inside the green zone, but I will be playing it safe and taking profits at the red line which is where an old high of a volume spike (buying pressure) is located.
TLDR: Neutral until price dips below the pink box, will then short until prices reaches the red line located at the top of the green box labeled "target zone".

ZRXBTC : WAY oversold...----------------------------------------------------------------------------
My position
----------------------------------------------------------------------------
Entry : 0.000085
TP 1 : 0.0001
TP2 : 0.000116
----------------------------------------------------------------------------
My ideas are not finacial advice.
----------------------------------------------------------------------------

0x (ZRX) Downtrend0x BINANCE:ZRXBTC broke bearish from the downtrend channel as btc dominance rises on a uptrend and the crypto market keeps seeing losses, these are just some potential support channels we could still see some move upward since the RSI is oversold and historically we have seen bounces from that point but with the current market situation other alts have proven to ignore this

ZRX/BTCStoch RSI oversold
Potential long position, take profit up to 10'000 satoshi
Overall still feeling pretty bearish, will not be making an entry

#ZRX #cryptocurrency at support while doom and gloom everywhereWhat to do?
Chart is pretty self explanatory, with obvious signs of past support in the highlighted green region. Price level indicated would be the level at which I see last area of real support, underneath which the support channel may be invalidated by heavy selling pressure. I'd look to take half position here and half near 8750 Satoshis if we get there and would be surprised if it didn't hold. Given the current environment, anything is possible. 0x has had some good fundamental developments lately, so coupled with the TA, it's one of the more interesting trades for me.
I've been working on other projects and trading less because of the general environment, but some coins and the general environment seem to be approaching value-level areas which make trading/investing more palpable now. Of course, risk manage accordingly as we're certainly not in (and maybe not close to) a general bull market yet.

SHORT ZRXHead and Shoulder formation on 1D chart. Short it on bitfinex.
---------
Leave a like/ follow.
