ZRX Just Broke Out… But Is It a Bull Trap Before a Collapse?Yello Paradisers did you catch that breakout from the falling wedge, or are you about to get faked out like the rest?
💎#ZRX/USDT has finally broken out of its descending resistance after weeks of compression. While this is a promising signal, this move alone is not enough. What really matters now is how price behaves on the retest. We're watching closely for a pullback either into the previous wedge resistance or directly into the key demand zone between $0.205 and $0.215. That area needs to hold if the bulls want to keep momentum on their side.
💎The structure remains valid as long as we stay above the $0.180 level. A break below that zone would completely invalidate this bullish setup and open the door to a deeper drop. On the upside, if buyers step in with volume, the path toward $0.260 and possibly $0.300 becomes much more realistic.
💎This is not the moment to chase. Let retail traders jump in too early our job is to position smartly, not emotionally. Watch the retest, measure the reaction, and act only when the market confirms.
This is where most retail traders get trapped, they chase the move too late or panic-sell too early. Don’t be that trader. Stay focused. Be precise.
MyCryptoParadise
iFeel the success🌴
ZRXUSD

ZRXUSDT Weekly Analysis – Major Reversal Brewing from Multi-Year🔍 Technical Overview:
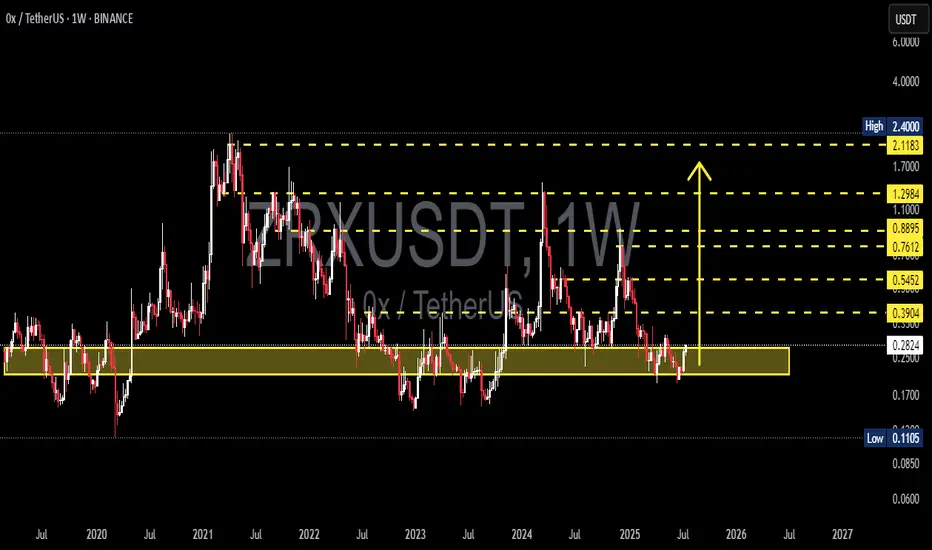
ZRX (0x Protocol) is currently showing strong signs of a long-term accumulation phase, with price once again revisiting a critical historical demand zone between $0.25 and $0.30. This area has acted as solid support multiple times since 2019, and the current structure suggests a potential macro-level reversal is underway.
Key technical highlights include:
Strong Historical Demand Zone: The yellow box highlights a multi-tested area of support where major rallies have originated.
Double Bottom Formation: A potential double bottom pattern is forming, indicating a reversal setup.
Volatility Compression: Price action has tightened into a sideways range, often a precursor to a breakout.
Well-defined Fibonacci Resistance Levels: Layered resistance targets give a clear path for bullish continuation once breakout is confirmed.
🟢 Bullish Scenario:
If ZRX holds above the $0.28 level and successfully breaks out above $0.39, it could trigger a powerful rally toward higher key resistance zones.
🎯 Bullish Target Zones:
✅ $0.5452 – First major resistance
✅ $0.7612 – Previous breakout level
✅ $0.8895 – Horizontal supply zone
✅ $1.1000 – Psychological round number
✅ $1.2984 – Pre-2022 breakdown area
✅ $2.1183 – $2.4000 – Ultimate high and previous cycle top
A clean breakout from current levels could yield multiple 100% gains, with a favorable reward-to-risk ratio for mid- to long-term swing traders.
🔴 Bearish Scenario:
Failure to hold the $0.25–$0.28 support zone would invalidate the bullish structure and may result in a drop toward the historical low of $0.1105.
Weekly candle close below $0.25 would be a strong bearish signal.
This would suggest prolonged downside or range-bound movement.
🧠 Strategic Notes:
This setup favors patient swing traders and investors looking for reversal plays in oversold altcoins.
Accumulating within the current demand zone, with a breakout confirmation above $0.39, presents a compelling strategy.
Consider using laddered entries and a stop-loss below the demand zone for optimal risk control.
⚠️ Risk Management:
ZRX is a low-cap altcoin, and while the upside potential is substantial, volatility remains high. Always apply strict risk management and position sizing to protect capital.
📌 Summary:
ZRX is offering one of the cleanest reversal setups in the altcoin market. With a historically strong demand base, clear resistance levels, and a favorable reward/risk structure, this chart is worth watching closely in the coming weeks.
#ZRXUSDT #CryptoReversal #AltcoinSetup #TechnicalAnalysis #AccumulationZone #BreakoutTrade #DoubleBottom #SwingTradeSetup #CryptoChart
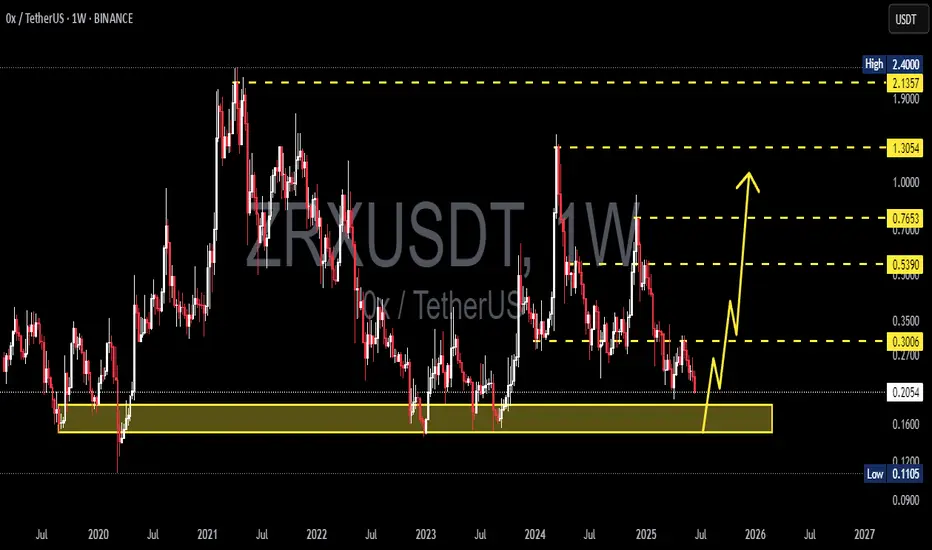
ZRX Looks Bullish (2D)From the point where we placed the red arrow on the chart, it appears that a triangle is forming.
Now, considering the formation of a double bottom at the low and the break of the bearish trendline, it seems that the price is ready to complete wave E of this triangle.
As long as the new demand zone holds, the bullish move can continue.
The targets are marked on the chart.
A daily candle closing below the invalidation level will invalidate this analysis.
For risk management, please don't forget stop loss and capital management
When we reach the first target, save some profit and then change the stop to entry
Comment if you have any questions
Thank You

ZRXUSDT 1W AnalysisZRX ~ 1W Analysis
#ZRX If you still have faith in this coin. You can consider this support to start buying back from here with a short-term target of at least 20%++
#ZRX/USDT#ZRX
The price is moving within a descending channel on the 1-hour frame, adhering well to it, and is heading towards a strong breakout and retest.
We are experiencing a rebound from the lower boundary of the descending channel. This support is at 0.2175.
We are experiencing a downtrend on the RSI indicator, which is about to break and retest, supporting the upward trend.
We are heading towards stability above the 100 Moving Average.
Entry price: 0.2240
First target: 0.2290
Second target: 0.2357
Third target: 0.2420

ZRXUSDT 1D AnalysisZRX ~ 1D Analysis
#ZRX Buy gradually after successfully breaking through this resistance line with a short-term target of at least 10%++.

#ZRX/USDT#ZRX
The price is moving within a descending channel on the 1-hour frame, adhering well to it, and is heading for a strong breakout and retest.
We are seeing a bounce from the lower boundary of the descending channel, which is support at 0.2586.
We have a downtrend on the RSI indicator that is about to be broken and retested, supporting the upward trend.
We are looking for stability above the 100 Moving Average.
Entry price: 0.2696
First target: 0.2831
Second target: 0.2948
Third target: 0.3123

ZRXUSDT 1WZRX ~ 1W Analysis
#ZRX Buy gradually when re -testing this support with a short -term target of at least 20%+. from here.

ZRXUSDT – Key Support & Resistance Zones Marked!I've outlined the critical price levels—where the market will decide its next move. Green lines = Strong Supports, Red lines = Major Resistances. But remember, we don’t gamble—we execute with precision.
📊 How I’m Trading This:
✅ Wait for LTF Confirmations – We don’t guess, we let the market speak.
✅ Support Bounce? Look for bullish structure + CDV confirmations before entering.
✅ Resistance Rejection? If we get a clean LTF down-breakout, that’s my trigger.
💡 Elite Trading Mentality:
I never insist on a position. If resistance breaks with volume and holds, I adjust and look long instead of forcing a short. Adapting = Winning.
🔥 Follow for sharp, data-driven trades—because strategy wins over emotions, always.
I keep my charts clean and simple because I believe clarity leads to better decisions.
My approach is built on years of experience and a solid track record. I don’t claim to know it all, but I’m confident in my ability to spot high-probability setups.
If you would like to learn how to use the heatmap, cumulative volume delta and volume footprint techniques that I use below to determine very accurate demand regions, you can send me a private message. I help anyone who wants it completely free of charge.
I have a long list of my proven technique below:
🎯 ZENUSDT.P: Patience & Profitability | %230 Reaction from the Sniper Entry
🐶 DOGEUSDT.P: Next Move
🎨 RENDERUSDT.P: Opportunity of the Month
💎 ETHUSDT.P: Where to Retrace
🟢 BNBUSDT.P: Potential Surge
📊 BTC Dominance: Reaction Zone
🌊 WAVESUSDT.P: Demand Zone Potential
🟣 UNIUSDT.P: Long-Term Trade
🔵 XRPUSDT.P: Entry Zones
🔗 LINKUSDT.P: Follow The River
📈 BTCUSDT.P: Two Key Demand Zones
🟩 POLUSDT: Bullish Momentum
🌟 PENDLEUSDT.P: Where Opportunity Meets Precision
🔥 BTCUSDT.P: Liquidation of Highly Leveraged Longs
🌊 SOLUSDT.P: SOL's Dip - Your Opportunity
🐸 1000PEPEUSDT.P: Prime Bounce Zone Unlocked
🚀 ETHUSDT.P: Set to Explode - Don't Miss This Game Changer
🤖 IQUSDT: Smart Plan
⚡️ PONDUSDT: A Trade Not Taken Is Better Than a Losing One
💼 STMXUSDT: 2 Buying Areas
🐢 TURBOUSDT: Buy Zones and Buyer Presence
🌍 ICPUSDT.P: Massive Upside Potential | Check the Trade Update For Seeing Results
🟠 IDEXUSDT: Spot Buy Area | %26 Profit if You Trade with MSB
📌 USUALUSDT: Buyers Are Active + %70 Profit in Total
🌟 FORTHUSDT: Sniper Entry +%26 Reaction
🐳 QKCUSDT: Sniper Entry +%57 Reaction
📊 BTC.D: Retest of Key Area Highly Likely
📊 XNOUSDT %80 Reaction with a Simple Blue Box!
I stopped adding to the list because it's kinda tiring to add 5-10 charts in every move but you can check my profile and see that it goes on..

ZRXUSDT 1WZRX ~ 1W Analysis
#ZRX High risk trading. Buy from here if you only have a Conviction on this coin with a short -term target of at least 20%+.

#ZRX/USDT#ZRX
The price is moving in a descending channel on the 1-hour frame and is adhering to it well and is heading to break it strongly upwards and retest it
We have a bounce from the lower limit of the descending channel, this support is at a price of 0.2820
We have a downtrend on the RSI indicator that is about to be broken and retested, which supports the rise
We have a trend to stabilize above the moving average 100
Entry price 0.3200
First target 0.3400
Second target 0.3600
Third target 0.3827

ZRXUSDT 1WZRX Update ~ 1W
#ZRX So far it still maintains its bullish structure. Buy gradually within this support block. Target 20%++
Only if you must long a shitcoinThis is the one.
It will make sense after the pump as usual, but i strongly believe that if mania continues across the market, this will go up.
Only if you must.

#ZRX (SPOT) entry range (0.2670- 0.3570) T.(0.8370) SL(0.2546)BINANCE:ZRXUSDT
entry range (0.2670- 0.3570)
Target1 (0.5180) - Target2 (0.6340)- Target3 (0.8370)
2 Extra Targets(optional) in chart, if you like to continue in the trade with making stoploss very high.
SL .1D close below (0.2546)
*** collect the coin slowly in the entry range ***
*** No FOMO - No Rush , it is a long journey ***
**** #Manta ,#OMNI, #DYM, #AI, #IO, #XAI , #ACE #NFP #RAD #WLD #ORDI #BLUR #SUI #Voxel #AEVO #VITE #APE #RDNT #FLUX #NMR #VANRY #TRB #HBAR #DGB #XEC #ERN #ALT #IO #ACA #HIVE #ASTR #ARDR #PIXEL #LTO #AERGO #SCRT #ATA #HOOK #FLOW #KSM #HFT #MINA #DATA #SC #JOE #RDNT #IQ #CFX #BICO #CTSI #KMD #FXS #DEGO #FORTH # AST #PORTAL #CYBER #CLV #RIF ENJ #ZIL #APT #MAV #ZRX ****

0x should be $1This trade is simple, this coin always has accumulation between 0.3 and 0.4
Fair price is $1 (DYOR)
Pump seems inevitable considering the current circumstances.

ZRX confirms inverse head&shoulders breakout during goldencrossYet another chart proving how immediately bullish the golden cross has been on the day of the cross as it once again results in a breakout validating pump here.

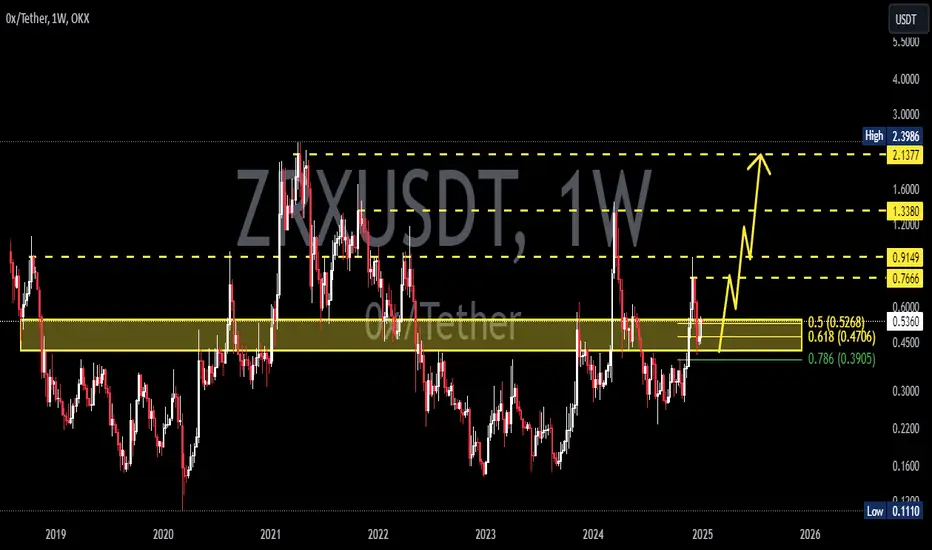
0x Protocol ZRX price is now at a crossroadsAnother “old man” woke up) CRYPTOCAP:ZRX
OKX:ZRXUSDT price is now trying to break above the mirror level of $0.5
If buyers manage to gain a foothold above this important level, then prospects for continued rapid growth in the $1.25 area may open up.
Share your thoughts on #0x Protocol, are we waiting for cool fundamental news?
_____________________
Did you like our analysis? Leave a comment, like, and follow to get more

ZRX | Train Hasn't Run YetGreen boxes can be included in the price. If BTC recovers in the short term, a wick thrown here could be a good place to accompany our next rally winner.
I don't overcomplicate things and add a ton of dirty crap to my charts, but you can check out the success of my analysis below.
I approach trading with confidence backed by experience and past success in identifying high-probability setups.
While I don’t claim to be the best, my track record speaks for itself, and I strive to let my analysis and results do the talking. Watch these levels closely—markets can confirm what charts already whisper. Let’s see how this plays out together.
My Previous Ideas
DOGEUSDT.P | 4 Reward for 1 Risk much more if you hold it.
RENDERUSDT.P | HTF Accuracy
ETHUSDT.P | Accurate Buyer Zone Identification | High Risk Reward if you hold it.
BNBUSDT.P | Accurate Buyer Zone Identification | High Risk Reward if you hold it.
Bitcoin Dominance | Great Characteristic Detection and Accurate Analysis

#ZRX/USDT#ZRX
The price is moving in a descending channel on the 1-hour frame and is sticking to it well
We have a bounce from the lower limit of the descending channel and we are now touching this support at 0.3080
We have a downtrend on the RSI indicator that is about to be broken, which supports the rise
We have a trend to stabilize above the moving average 100
Entry price 0.3170
First target 0.3392
Second target 0.3600
Third target 0.3860

Weekly bullish momentum-trade: OX USD or ZRX USD
Weekly timeframe ZRX USD on the back of Cryptocurrency hammering currently as accumulation expected to turn into breakout patterns anytime now and going forwards into 2025 for a strong rally.
This junior crypto had normal stochastic divergence on a weekly timeframe recently, it's RSI momentum is close to 50, it's Stochastic's has provided a bullish lift well above the oversold 20 level and the MACD ticks all boxes with a recent bullish cross-up.
Buy up until it's recent high about 0.3665. There is usually a poorer spread with this one in the buy-price but its' momentum I can assure truly makes up for any shortfall.

ZRXUSDT Short Signal / Bulls or Bears?BINANCE:ZRXUSDT
OKX:ZRXUSDT
Hello Traders
SL1 ---> Low-risk status: 3x-4x Leverage
SL2 ---> Mid-risk status: 5x-8x Leverage
👾The setup is active but expect the uncertain phase as well.
➡️Entry Area:
Yellow zone
⚡️TP:
0.2772
0.2734
0.2695
0.2648
🔴SL:
On the chart
🧐The Alternate scenario:
If the price stabilizes below the trigger zone, the setup will be cancelled.

Short position on ZRXUSDT / Follow for updatesBINANCE:ZRXUSDT
OKX:ZRXUSDT
SL1 ---> Low-risk status: 3x-4x Leverage
SL2 ---> Mid-risk status: 5x-8x Leverage
👾The setup is active but expect the uncertain phase as well.
➡️Entry Area:
Yellow zone
⚡️TP:
0.2717
0.2687
0.2657
0.2625
0.2580
SL:
0.2853
The Alternate scenario:
If the price stabilizes above the trigger zone, the setup will be cancelled.

