ZRXUSDT(4HCHART) Resistance Breakout#ZRXUSDT (4H CHART) Technical Analysis Update
Resistance Level Breakout
ZRX/USDT currently trading at $0.4270
LONG ENTRY LEVEL: Above 0.4250 (only enter long after 4h candle close above resitance level at 0.4250
STOP LOSS ( support): Below $0.3910
Resistance level1(target):$0.4740
Resistance level2(target):$0.5130
Max Leverage: 3X
ALWAYS KEEP STOP LOSS...
Follow our Tradingview Account for more Technical Analysis Update, | Like, Share and Comment your thoughts
Zrxusdt

ZRX 0xLast week we can see some altcoins pumping.
LTC, XRP, XLM, QTUM, BCH
these altcoins have a large capitalization, and large trading volume. In pair with bitcoin, they have great growth potential.
ZRX is one of the top projects in the industry.
The token has not been pumped yet, it is at the bottom. the order book is empty. The token has great growth potential
Best regards EXCAVO
zrxusdt longAnother one ready to pop.
This should be the start of a major wave 3.
Things are likely to go very high.
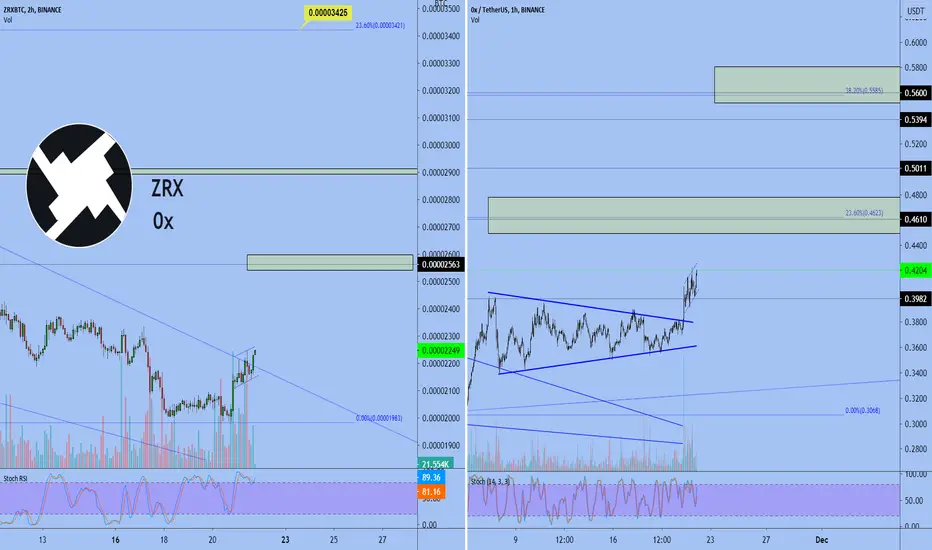
The btc pair just broke out of a falling wedge.
There is also a post of the btc pair on my page, check it out.
Just an idea, not a financial advice

ZRXUSDT(Symmetric Triangle BREAKOUT)
ZRXUSDT/USDT currently trading at $0.38
LONG ENTRY LEVEL: 0.37 to 0.39
STOP LOSS ( support): Below $0.35
Resistance level 1(Target) : $0.435
Resistance Level 2(Target): $0.53
Resistance Level 3(Target): $0.66
Risk Reward Ratio: 1:6
Max Leverage: 5X
ALWAYS KEEP STOP LOSS...


ZRXUSDT - Rejection of descending channel resistance 🔽Sell ⬇️
Target - downtrend swing low, descending channel support

ZRX 0X Easy Target 4H chart ZRXBTC ZRXUSDT 0XUSDT 0XBTC ZRXUSDZRX 0X Easy Target 4H chart ZRXBTC ZRXUSDT 0XUSDT 0XBTC ZRXUSD

ZRX/BTC dropped to strong weekly supportZRX/BTC
----------------------------------------
dropped to strong weekly support
Between 2150-2400 sat
If the this support hold for next few days and the weekly closed above
I expect strong bullish move will come
Also altcoins season is expected to come soon
But before buy should wait if it will hold or not

ZRX 6% Profit in a Day #BinanceFutures Hello Dear Traders,
ZRX Long Setup
Entry : 0.3230
Stoploss : 0.3130
Target : 0.3450

ZRX (0x) Down at major supportZRX is at strong support from last accumulation phase. Rsi bounces consistently of the trendline. If we hold support it is time to accumulate or possibly long ZRX. Watch bitcoins price action closely. ZRX had a nice ABC Elliot Wave correction and is holding last accumulation phase tops as support. If we break this support level, look for a short entry. Things can get ugly when we break this level. Good luck trading.

ZRX to see a leg down.0x - Intraday - We look to Sell
Price continues to trade within the triangle formation.
The RSI is trending lower.
Short term MACD is moving lower. 50-hour EMA is at 0.379.
The bias is to break to the downside.
Our profit targets will be 0.343 and 0.336
Resistance: 0.380 / 0.388 / 0.396
Support: 0.370 / 0.360 / 0.340

ZRX/USDT (Consolidation at Key Level Support)💎Technical Analysis Summary💎
BINANCE: ZRXUSDT
-After the strong rejection at the 0.96$ resistance area
-The price fell back to its key support area
-This is an important key level since April 2019
-Is this a good buying opportunity?
-Answer is No, why? because it is coming from a strong rejection
-And this short consolidation range might be a Bear flag
-So avoid the bearish potential, you need to wait until
-The local resistance is broken upward around 0.42s area
-That will invalidate the potential falg
-But if you are looking to short the market
-Simply wait for the support breakdown
A big Thanks for donating 💰 via Tradingview coins this week to CITIZENCAINE 🙏🎉
``````````````````````````````````````````````
Trading Involves High Risk ⚠️
Not Financial Advice 💸
Please Exercise Risk Management 💱
``````````````````````````````````````````````
Thank You All!🙏😊💖For Supporting My Channel 📺
Through Leaving A Thumbs Up, Comment & Follow 💬
Happy Trading!😊💕💖
``````````````````````````````````````````````

0x (ZRX) - October 18Hello?
Dear traders, nice to meet you.
"Like" is a huge force for me.
By "following" you can always get new information quickly.
Thank you for always supporting me.
-------------------------------------------------- -----
You need to make sure you can get the support at the 0.37634352 point.
We have to see if we can climb above the 0.46088684 point around October 26th.
We also have to see if we get support at the 0.32735668 point.
Below the 0.32735668 point is the bottom section, and I think it is a mid- to long-term investment area.
If it falls below the 0.32735668 point, I think trading is necessary to preserve the profit and loss.
Above all, it is important whether you can climb along the uptrend line (1).
-------------------------------------------------- -------------------------------------------
** Check support, resistance, and abbreviation points.
** Support or resistance is based on the closing price of the 1D chart.
** All explanations are for reference only and do not guarantee profit or loss on investment.
Explanation of abbreviations displayed on the chart
R: A point or section of resistance that requires a response to preserve profits
S-L: Stop-Loss point or section
S: A point or segment that can be bought for profit generation as a support point or segment
(Short-term Stop Loss can be said to be a point where profits and losses can be preserved or additionally entered through installment trading. You should trade from a short-term investment perspective.


ZRX signal (28% max profit)i can recommend this setup for ZRX long:
ENTRY: between 0.3750 - 0.3820
TP1: 0.4350
TP2: 0.4800
STOP: 0.3680
don't enter with high leverage..i will enter with 10x-15x maybe
higher leverage means -> possible liquidity so trust me..

ZRX - Buy the Bottom.ZRX RSI seems to have bottomed.
Trade offers good risk reward.
Target is %10 from current price, around $0.38
Good luck!
Tibor

Zrx/btc nice move at last defense supportI post a chart since few days
About the support
3000-3300 as a buy area
Zrx dumped to that area i mentioned before as expected and bounced up from that level
This was my previous idea link you can see here
I would say we can see big move in future as long as it above support area 3000-3300
The resisances (take profit area also shown in chart)

Buying the Bottom of 0x (ZRX)0x - Short term - We look to Buy
Offers ample risk/reward to buy at the market.
A higher correction is expected.
We look to buy dips.
We are trading at oversold extremes.
Price action looks to be forming a bottom.
RSI looks to be forming a bottom.
Resistance: 0.3500 / 0.3650 / 0.3800
Support: 0.3400 / 0.3360 / 0.3300
Signal Centre

Zrx/btc down to key support ?Buy area
0.00003300-0.00003000
Target
0.00004-0.00004700-0.00005300
Stop : daily close below 0.00002899


ZRX - Entering the Buy Zone? 150% Potential?ZRX is an open protocol that enables exchange on the Ethereum network. It was pretty hyped in August as the ETH network charges started to increase, and ZRX was a cheaper alternative.
Seems to have been trading on a series of bull flags . Bull flag is a continuation pattern characterized by a sudden rise in price followed by a slow decline or sideways movement.
Currently, we are testing the water dipping into the last big historical resistance band. We saw a drop into it this morning with a decent spring back above it.
We've moved below EMA 100 and EMA 200 . We've been above this for a month now with the last dip to EMA 100 during the big Sept drop, leading to a quick rebound.
Stoch is bottoming out, could see beginning of a reversal forming soon.
MACD shows a shrinking downward trend.
BUYING IN?
Keep an eye on it! but not buying in right now. Big potential for gains after we leave the downard channel and running into resistance and EMA levels here in promising. Will need to see how the market plays out to see whether this is the buy time or not. If this resistance breaks we could see bigger declines, so don't buy in too big too early and get bit.
When we leave the downward channel, it's game on. Potential for 150% profit long term. I've put some TP's below based loosely on previous resistances, use at your discretion ;)
TP's : 0.52, 0.65, 0.95
SL : 15-20% Max
Aim for the moon, if we miss we land among the stars. Or asphyxiate.
I'm a simple guy that you don't know posting his ideas on the internet for the sake of improving as a human being. If you take this as financial advice, that's on you.
Feedback, criticism and crude humor are welcome :)
