Requested Update: Bond Yields Complete a 5-wave pattern higherWe have our first indication of a top in bond yields with price overlapping and losing it's impulsivity to the upside. However, a top is not confirmed until yields breach 3.40% which is our wave 4 of one lesser degree.
To do so should confirm the beginning of our wave 2 decline into the target box, and over time.
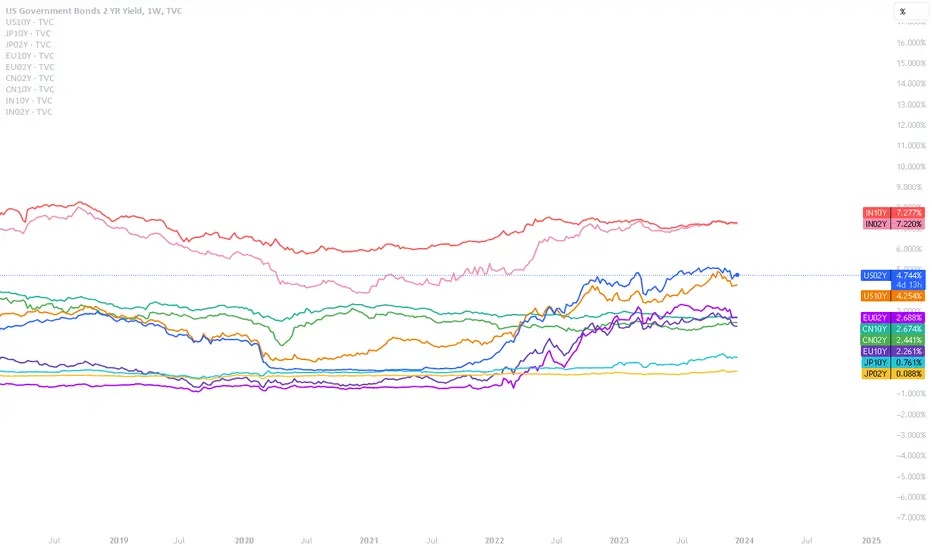
Government bonds

Business Cycle Rotation Part 4In the first three installments we described an exercise utilizing the long term momentum in asset classes, the relationship between those classes and the Organization for Economic Co-operation and Development (OECD) Composite Leading Indicator (CLI) for the United States, in order to anticipate the business cycle and markets. Those posts are linked below.
Since October when this series was mostly written, several markets have made promising changes in their momentum states and chart patterns. But, this is a teaching exercise so we will mostly work with the data available at the end of September 2023 and mostly (aside from rates) ignore the dramatic changes of last few weeks.
We begin by assessing the change between November 2022 and October 2023. Ideally we should measure at the same point each year. When I was actively managing money this was an exercise I updated in early January so that I could include it in my yearend recap and provide forward guidance to my team. But, given the time perspective involved, slight differences built over a month or two typically make little difference. Interestingly this year may be the exception.
I have included a chart of the two and ten year Treasury yields (inverted). Note the three drives to a low pattern in twos, (a sign of waning supply/growing demand), the break of the downtrend (yet to be confirmed by a monthly close above) and the tentative turn into the bullish quadrant.
I think of rates as the first mover in the cycle. To believe that the business cycle has turned virtuous I would like to see ten year rates make a solid top and begin to reverse at least some of the technical damage created by the break above the multi decade downtrend and the 3.25% pivot that had defined the bull market structure. I would also like to see a more definitive turn higher in twos. In October rates were oversold in terms of momentum and the structure from the 2020 low was completely intact Until I see solid signs of a monthly perspective yield top in the two year and ten year, it will be difficult for me to label this as the kind of high that would lead a change in the economic cycle. Note that the trendline break in the month of December has turned the shorter term 10 year Treasury (inverted) trend from down to neutral.
Commodiites: Commodities have moved from the bull waning to strong decline sector. The weakness in commodities remains consistent with a business cycle that continues to weaken.
Dollar: The Dollar remains in bull waning. It has benefited from global flight to quality, carry and the aggresiveness of our central bank verses other central banks. But, of the asset classes, the Dollars relationship to the business cycle is the least consistent.
Equities: Domestic equities have been mired in the strong decline sector (in part two we discussed at length why equities were still plotted in this sector). In October we were still categorizing equities as lower due to the lack of a rally in most of the equal weight and broader indexes. That remains the case, but barely, with the equal weight moving slightly above the top of its range.
In part 5 we will draw final conclusions and attempt to extrapolate them to 2024.
And finally, many of the topics and techniques discussed in this post are part of the CMT Associations Chartered Market Technician’s curriculum.
Good Trading:
Stewart Taylor, CMT
Chartered Market Technician
Taylor Financial Communications
Shared content and posted charts are intended to be used for informational and educational purposes only. The CMT Association does not offer, and this information shall not be understood or construed as, financial advice or investment recommendations. The information provided is not a substitute for advice from an investment professional. The CMT Association does not accept liability for any financial loss or damage our audience may incur.

Anlysis of the 30Y treasury BondHere is my analysis of the 30Y treasury Bond. In fact , for the past weeks , this market has been trading lower. And my point is that it will continue trading lower until we reach the sellside liqudity level. That means that we could continue to witness bullish prices on indices due the invese correlation between the Bond market and the indices market

US 10Y TREASURY: pricing rate cutsIt was final time for the Fed to align with the market. At the latest FOMC meeting, this was the case, considering that rhetoric about potential rate increases was not at all in the spotlight of Powell's speech, but clearly slowdown of inflation and that FOMC members are perceiving Fed`s rates at 4.6% as of the end of 2024. This was a clear signal for markets that rate cuts are coming during the course of the next year, with current anticipation that it could be already in March next year.
Although 10Y US Treasury yields started the week around 4.28%, they swiftly reverted toward the downside and lowest weekly level at 3.9%. The market is currently testing the $4.0% level, which might impose some volatility in the week ahead around this level. Still, looking at the larger picture, the yields would certainly further test lower levels, currently eyeing 3.8%.

Interest rates over layThis is 30 year yields with 10 20 and the fed funds rate over laid on top for my purposes:)

I am BEARISH BONDS NOW The chart posted is the 1yr Tbill rate we seem to have a LOW in place This should be clear over the next 10 TD

US Dollar Index vs 10Y-03M Yield curve (LEADING Indicator)The real U.S yield curve (Blue) suggests that the U.S. Dollar (Yellow) may weaken over the next 12 months.
The main beneficially will be Japanese YEN who haven't moved monetary policy for over 42 years. Currency pairs are relative to move so I see the Yen appreciating, followed by the EUR.

Most important chart to check BEFORE any other market!After 4 years of upward movement and reaching the ceiling of 5% yeilds.
Considering the momentum of the current downward trend from the 5% resistance, as long as the wave counting is considered correct and not violated, all financial markets, especially bitcoin, gold, and the US stock market for about the next year (2024) may be ascending
IF the bonds break the 5% resistance, the whole scenario is cancelled
Keep in mind that the amount of money printed and available to large investors to enter the financial markets is much more, and this can have much more extreme movements with it.
But beyond these cases, finding suitable entry points for each market is a completely separate and important issue that must be examined separately.
Neither gold nor Bitcoin are good places to buy now.

US10Y Bond SHORTBased on my analysis the US10Y Bonds has been in a bearish direction. Price broke the bullish uptrend towards this last quarter of 2023. I predict that it can go lower than 4%. I don't see it going back up close to 5% anytime soon. The Feds meeting this week will most likely have it go higher just to finish out the retrace between 4.2% and 4.3%. We are also in the biggest bear market for bonds in history.

Dovish Fed sends rates lowerThe Federal Reserve on Wednesday indicated that its interest-rate hiking cycle has ended and that lower borrowing costs are coming in 2024. This was more dovish than the market anticipated and the US 10Y yield has sold off further.
The short-term downtrend lies at 4.22% and while below here we will assume that the US 10Y yield remains under pressure. We would also highlight the erosion of the 200-day ma, which leaves the market on the defensive.
The market has sold off towards 3.93%, the current location of the 55-week ma and the 23.6% retracement of the entire move up from March 2020. This may provoke some near-term consolidation.
However, the market has also eroded its 2022-2023 uptrend, and this does leave it under pressure. Below 3.90% our attention reverts to the 20-month ma at 3.74%.
Disclaimer:
The information posted on Trading View is for informative purposes and is not intended to constitute advice in any form, including but not limited to investment, accounting, tax, legal or regulatory advice. The information therefore has no regard to the specific investment objectives, financial situation or particular needs of any specific recipient. Opinions expressed are our current opinions as of the date appearing on Trading View only. All illustrations, forecasts or hypothetical data are for illustrative purposes only. The Society of Technical Analysts Ltd does not make representation that the information provided is appropriate for use in all jurisdictions or by all Investors or other potential Investors. Parties are therefore responsible for compliance with applicable local laws and regulations. The Society of Technical Analysts will not be held liable for any loss or damage resulting directly or indirectly from the use of any information on this site.

Jay just turned off the musicSo I think we all understand that the ship has changed course. Fed comments yesterday caused some real margin calls. Lots of folks on the wrong side of that one. Lay either of these charts against the S&P and I think its plain to see we are ready for a pullback soon.

US10Y ~ Bullish Downtrend Reversal (2H)TVC:US10Y chart mapping/analysis.
US10yr bond yields finding bullish reversal off lower range of descending parallel channel (white) - further momentum pending upcoming 10yr auction + US economic data.
Trading scenarios into EOY:
Bullish reaction to macro economic news = continued momentum to break above descending trend-line (white dashed) towards 38.2% resistance zone.
Bullish extension target(s) = re-test upper range of descending parallel channel (white).
Bearish reaction to macro economic news = reversal back below 50% Fib / 4.10% psychological support level / lower range of descending parallel channel (white) / ascending trend-line (green dotted) confluence zone.
Bearish extension target(s) = Golden Pocket zone / 4% psychological support level / 78.6% Fib.

US10Y vs. SPX ~ Inverse Correlation/Ratio Indicator (Dec 2023)TVC:US10Y versus SP:SPX inverse correlation analysis.
Work in progress indicator for anticipating market trend switches.
Notes:
Emerging correlation identified within US10Y/SPX ratio.
Spikes in ratio (orange vertical line, dotted) aka bond yield ROC/volatility = higher probability of risk-off sentiment (ie big tech & growth stock rotation).
Correlation only valid when market is "hyper-sensitive" to bond market fluctuations, especially during recent US Fed undertaking rate hike cycle.
Should be used in conjunction with other confluence factors to provide conviction in swing/position trades.

Bund StepsA simple representation of potential support and resistance zones (larger rectangles) projected in time, meaning once the price is past their time zone, the price levels might not hold the same amount of relevance. Looking for price action with potential candlestick patterns for reversals (pivot points), also looking for candlestick shadows at the shapes.
Small rectangles pose just as milestones or guiding elements for potential price tendencies. Icons are usually potential price predictions/projections in time but a hit is not required.
Considering the overall picture the main scenario might suggest resistance zone at the red rectangle, and support level at the blue, with overall tendency pointing upwards through the orange rectangles toward the Target Icon. A short at the red might be too bold for the swing trader even though the recent general move was downwards, from 133 to 127. The blue rectangle is also quite low, and there is the possibility of having a pivot point above it, without it ever being touched.
This is a continuation of the previous Matrix project on this market. (Linked Idea)

BRR pattern points to a true Santa rally for bonds. A rare chart pattern second in predictive power to only the famous head and shoulders is the Bump and Run Reversal (BRR) technical pattern.
school.stockcharts.com
If it is so powerful, why is it so unheard of?
1) They are rare. But a recent BRR of very high consequence is the 2022 DXY chart.
2) They usually only occur on high time frames as they measure manias and blow off tops, or in the inverse, manic selling followed by a return to normal.
3) They are hard to chart
4) They give predictive power in terms of time, not in terms of a "measured move" of price, but in the other dimension time.
This chart shows a clear BRR reversal, 55 days in the manic up pattern, the "bump". 55 Days in the return to trend or "run". Which would create a 10 year US Treasury bond rally and likely a rally in risk on assets. Which lands us, perfectly, at yields dropping until Monday December 25th 2023.
Merry Christmas Traders!

2Y Yields LowerTVC:US02Y
2Y Yields heading lower.
Sometime over the next 12-18ish months, I believe we'll see 2Y yields fall to 200-275 bps.
Headline inflation numbers are lower and dropping.
The Fed has effectively pulled a rabbit out of a hat in the act of raising interest rates by ~500+ bps, while avoiding the obliteration of the economy. (thus far)
If the economy does falter in the coming months; the Fed will lower rates.
(No further explanation needed)
Despite the endless repetition of "higher for longer" from Fed officials; I believe that the Fed will lower rates even if the economy and markets remain strong.
The establishment powers in the political & financial world's that the Fed straddles both crave the same thing... Cheap Debt.
In addition to this, there are over $34+ Trillion reasons to lower rates as soon as possible.
Not to mention, the upcoming election...
The market is anticipating lower yields as well.
We're seeing the market preemptively increase exposure to interest rate sensitive assets.
(i.e. - tech stocks, indices, cryptos, beaten down govt bonds, etc.)
On a technical basis, the weekly chart of 2Y Yields is showing substantial bearish divergence.
Weekly RSI shows a bearish RSI Swing Rejection (March '23 and October '23 highs)
The 50% & 61.8% Fib levels give us a target of 200-275 bps.
The median line set suggests that yields could arrive at the target area sometime between May '24 - May '25.
Conclusion: Short Yields.
Fat_Fat

Treasury Yields flash bottom signs, early for some + DXY leadingJUST SAYING.......
NOT implying that the party is over BUT heed some signs by treasury.
1Yr #yield is fighting to close above the 10day Mov Avg (RED).
2 Yr has a possible 3rd day trading above the RED Mov Avg.
10Yr fighting to get above the recent trend it broke & Moving Avg's.
US #Dollar has been fighting & looks to be gaining momentum. We'll see how this does over next few days to get barometer.
TVC:DXY TVC:TNX

US 10Y TREASURY: FOMC meeting aheadThe yields on the US Treasuries continued to slow down during the course of the previous week. However, a strong US jobs data posted on Friday, made an impact on 10Y yields to revert a bit toward the higher grounds. Although the US equities were supported by the same news, investors in the Treasury bonds still hold a dose of reserve when it comes to the future economic conditions. Namely, as job data remains strong, there is a fear that the Fed might tighten further in order to sustain their 2% inflation goal.
The 10Y Treasuries started the previous week around 4.29% yield. As the week progressed, yields reached the lowest weekly level at 4.10%. However, at Friday`s trading session, they reverted a bit back, ending the week at 4.23%. Regardless of this small reversal, the markets are still generally oriented toward the downside. The market is still pending testing the 4.0% level, which might occur during the following week or two. At the same time, charts are pointing that some short reversal might lead yields shortly toward the 4.3%, less likely 4.4% level, before they make a final reversal toward the level of 4.0%.

Why is US 10Y yield Coming own fast?Is market moving to safe asset, the US dollar. Is market moving to safe asset, the US dollar. Is market moving to safe asset, the US dollar. Is market moving to safe asset, the US dollar. Is market moving to safe asset, the US dollar.
US Debt to GDP vs. 10 Year Treasury Note YieldSimply showing trend changes in long term inflation / interest rates.

Never disregard those weekly & monthly closeSTHOSE LONG TERM TRENDS ARE IMPORTANT.
Remember how the 10 & 30 Yr #yield BROKE daily trends?
Well, they are both still in play, for TVC:TNX it is in better shape.
Let's see how they close.
30 Yr struggling a bit more to recover that close under the trend.
#mortgage rates have also fallen decently.

BondsUS10Y breaking support. Good entry on bond etf's. Only picking up a small amount to get in the door. ZROZ, EDV, and TLT.

UK Bond Next StepsThe rectangles are potential zones of support/resistance. They also indicate potential tendencies of the sentiment of the market through the pairs of similar color and their relative position (going up or going down). Icons are relative price predictions in time, similar to targets that can be hit. Around the marked time stamps potential pivot points or exceptional events can occur.
This is a project similar to previous ones (Matrix Style) and is also looking at candlestick patterns near the shapes, rebounds or bounces with candlestick shadows, or small coincidences in the price action relative to the elements in the snapshot. This is for the swing trading enthusiasts that seek to maximize gain and minimize risk. For better understanding the general context and approach, the linked idea with previous results can be analyzed.
Always trade with a plan, manage risk, asses all probabilities, and may the force of profits be with you!
