US 10Yr YieldVisual ideas about the 10 Year bond yield rate and it's relationship with confidence in the financial markets.
Government bonds

US10Y Hits Resistance.It is evident that the US10Y downtrend will persist, causing DXY to suffer while commodities and metals will benefit from a green shine.

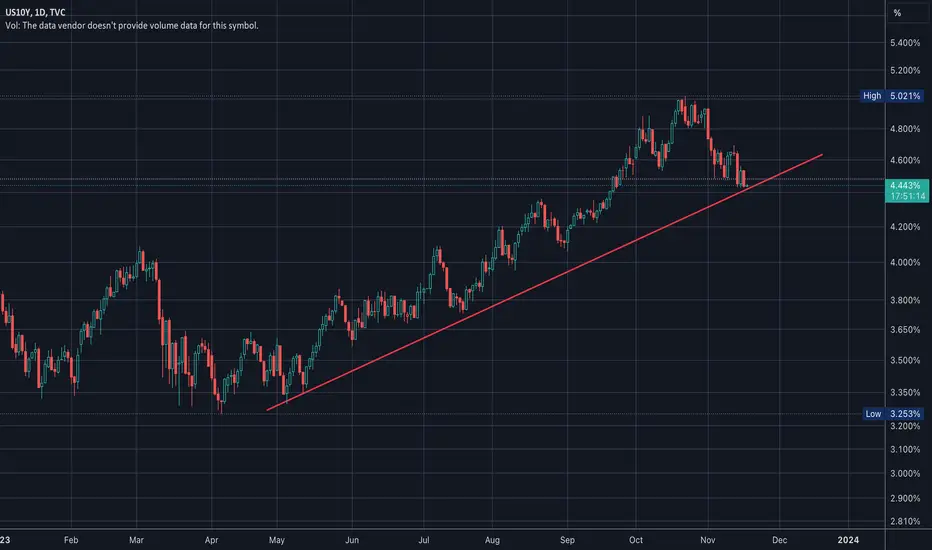
10 years yield pullback is almost certain over, higher we goThe 10-year yield is currently exhibiting strong bullish signals. After a significant surge, it has undergone a correction from overbought levels. What's particularly intriguing is that this correction has formed a bullish pattern known as a falling wedge. The correction has brought the yield down to two robust support areas.
At present (today), the yield is rebounding from these support levels, and the MACD indicator is showing signs of a potential turnaround, suggesting a strong upward movement today.
If today's closing price matches or exceeds the current levels, it would confirm a breakout from the falling wedge, potentially triggering a substantial upward trend towards the previous high. This could be interpreted as a bearish signal for commodities and stocks, especially given their existing overbought conditions.

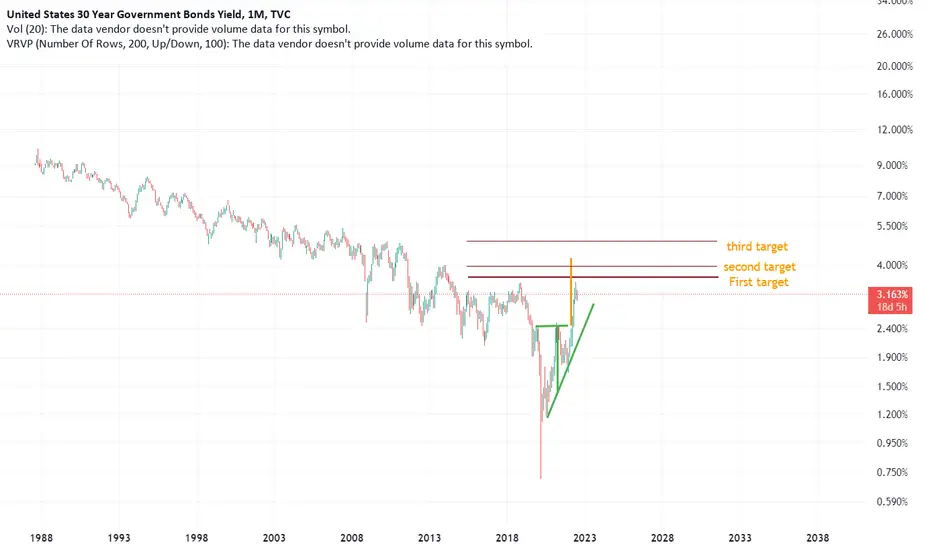
US30Y targets in this analysis , i gave targets for US30Y , based on the macro env , and the W pattern in addition to ichimoku strong resistancec.
not a financial advice
thank you
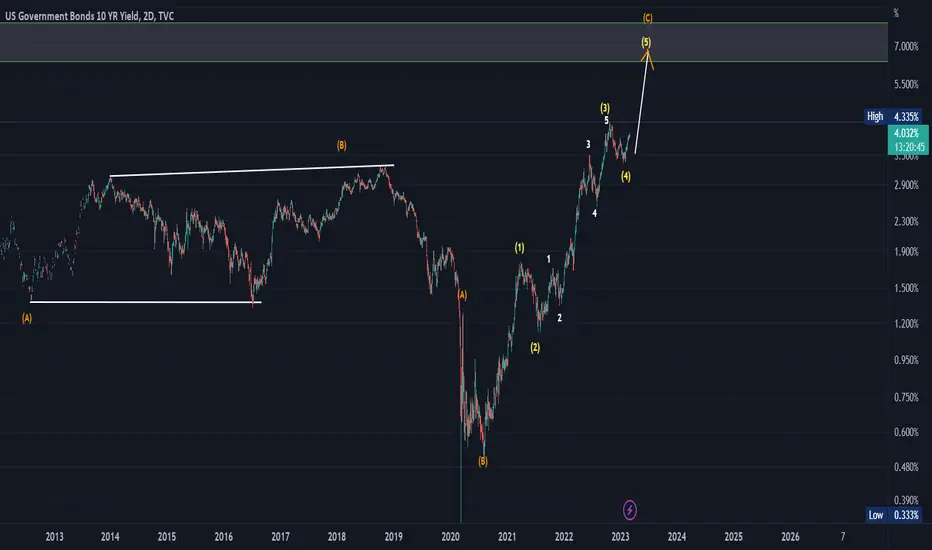
Last upswing before the big dropAccording to Elliott's analysis, there is a final upward wave remaining, and thus there will be three historical corrective upward waves, A, B and C, from which the drain begins to fall again near its historical bottom. Let us see
Major Market Correlations Between Yields, Stocks And USDollarIn 2022, the stock market took a hit and the US Dollar gained strength due to higher yields in the US. Toward the end of that year, as yields eased off, the US Dollar lost some of its power, and this coincided with a rebound in stock market performance.
Now, as yields are climbing once again, the US Dollar is regaining strength, but it seems like stocks are beginning to lose their previous momentum. However, the situation might shift if these rising yields are in the process of completing their fifth wave and are on the verge of slowing down. In that case, the US Dollar could actually become weaker again, and the stock market might continue its upward trend. Of course a lot will depend on the FED policy decisions, where dollar can turn down if FED will stop the hiking cycle. Well, a lot will depend on the US data, so market participants will surely watch the NFP very closely tomorrow.

$US10Y At a Important Pivot Point---
### Market Analysis: TVC:US10Y Nears Crucial Pivot Point
#### Critical Juncture for the U.S. 10-Year Treasury Yield
The U.S. 10-Year Treasury Yield ( TVC:US10Y ) is currently at a pivotal position that could significantly influence market sentiment. This important pivot point is marked by a specific blue line on the chart, serving as a key indicator for market direction.
#### Bullish and Bearish Implications
- **Below the Blue Line - Bullish for Markets**: If the TVC:US10Y falls below this blue line, it is generally interpreted as a bullish signal for the markets. A lower yield on the 10-year Treasury often suggests an increased appetite for riskier assets like stocks, as investors seek higher returns than those offered by government bonds.
- **Above the Blue Line - Bearish for Markets**: Conversely, if the yield rises above this blue line, it can be seen as bearish for the markets. Higher yields may indicate a shift towards a more risk-averse sentiment, potentially driving investors away from stocks and into the perceived safety of government bonds.
#### Monitoring Market Movements
The position of the TVC:US10Y relative to this blue line is a critical factor for investors to monitor. It not only reflects broader market trends but also helps in predicting future market movements. The yield’s behavior around this pivot point could provide valuable insights into the market's overall risk tolerance and investment direction in the near term.

credit spreads cannot be ignored3 month yield - 10Yr yield compared to SPX for last 60yrs...prety clear that when spreads correct, markets correct. question is when do these yields correct with everyone expected fed to start cutting in 2024.

That hasn't happened for a long time.Hi.
Of course there will be some sort of technical rollback soon, it will take a year or so.
But, most importantly there is a super bullish quick signal for The 10-Year Treasury Yield.
It has happened now, this month, for the first time since 1986.
Obviously there is a long cycle of rising 10-year yields ahead of us.
Good article in Forbes from a month ago.
I recommend it to novice traders who want
to understand the impact of US10Y returns on the market.


US 10Y TREASURY: pricing Fed pivotingThere has been a lot of anxiety on the market whether the Fed will hike interest rates for one more time till the end of this year, as Fed Chair Powell mentioned a few months ago. However after the inflation data were officially released during the previous week, the market is currently almost quite sure that the Fed will not further increase its interest rates. Now the attention is switched to the question when the Fed will start to cut interest rates. Although Treasury yields expressed some volatility during the previous week, still, as of the end of the week they returned to the previous levels.
For the second week in a row, the 10Y Treasury yields were moving between levels of 4.67% down to 4.43%. Testing the potential for higher grounds showed that there is no market potential for such a move. Charts are suggesting that a short support level of 4.4% needs to be tested in the coming days in order for 10Y yields to find a new ground. A short move toward the up side is possible, however, not highly above the 4.5%.

Uk gilts trend UPUK gilts after quite bad market from recent years has showed some change... it means inflation in uk is already in control.. and no more rate hikes on way. For moment Uk gilts is a Buy!

JP10Y leads US10YBOJ is messing with yield curve control policy which now affects 10YJGB which in turn affect US10YR treasuries. With US treasuries dropping like a rock, it will be interesting to see if JGB's lead/lag US treasuries

US10Y pop, then lowerThis is fairly clear wave count. Each retracement took about the same amount of time. It appears we are completing the end of the 5th wave(estimated blue path)
Although right below the current price, we "can" say 5 waves are complete.
In the green rectangle is a fair value gap. I'm assuming price will pass through this area toward 4.34%
4.34% is the .786 fib of wave 3 fib retracement and my estimate where price corrects higher.

US 10yr Bonds (US10Y) - Bullish RetracementOpportunity for trade with good Risk/Return ratio.
Signs of Bullish Momentum divergence on MACD indicator
Stop Loss and Profit Target determined by boundaries of Channel

US 10Y yield approaching decent supportThe US 10Y yield is approaching decent support around 4.36/35 (August high, support line and Fibo) and the daily RSI is low (it does not normally maintain a move below 30) and this suggests that the market should hold this vicinity and attempt to recover.
It is helpful to use the daily RSI in conjunction with a target zone to add weight to an idea that the market is more or less likely to hold in this zone.
Disclaimer:
The information posted on Trading View is for informative purposes and is not intended to constitute advice in any form, including but not limited to investment, accounting, tax, legal or regulatory advice. The information therefore has no regard to the specific investment objectives, financial situation or particular needs of any specific recipient. Opinions expressed are our current opinions as of the date appearing on Trading View only. All illustrations, forecasts or hypothetical data are for illustrative purposes only. The Society of Technical Analysts Ltd does not make representation that the information provided is appropriate for use in all jurisdictions or by all Investors or other potential Investors. Parties are therefore responsible for compliance with applicable local laws and regulations. The Society of Technical Analysts will not be held liable for any loss or damage resulting directly or indirectly from the use of any information on this site.


US yields looking "toppy"; more weakness after rallyThe US CPI came down more than expected yesterday at 3.2% y/y, and as a result the USD fell sharply with US yeilds, while stocks and metals are on the rise. For now, this seems to be a very important data as it causes also a very important breakdown on USD index and US yeilds.
Looking at the US yeilds, we have five waves down, so it means that top is in place, and suggests that speculators believe that FED is done with hiking. But road map to lower yields/higher bonds will be a bit "bumpy", so be aware of some rally, especially if we consider five waves down on 10 year US yields. So A-B-C rally can cause some pullbacks on XXX/Dollar pairs, which will eventually see more upside after pullbacks.
Grega

US 10 Years Bond Yield 233 years old chart since 1790. 14/Nov/23US 10 years treasuries yields long term chart since 1790 is forming an expanding flat pattern ABC (Red), where it probably just completed wave II ( Blue Circled) = the first pullback of long term downtrend impulsive C wave ( Red )( further detail in next lower time frame chart ).

US 10Y TREASURY: no more rate hikes?Fed Chair Powell's speech in front of the IMF audience in Washington had some impact on the Treasury yields, but it seems that the market is still not ready to take another rate hike for granted. Namely, Powell`s hawkish tone on a possibility of another rate hike if the inflation “reaccelerate'' had an short impact on 2Y Treasuries which moved back to 5%, but the 10Y Treasuries remained relatively flat, which provided some market confidence that the Fed is finished with further increases of interest rates. It is also worth mentioning that the US 30-year bond auction was held during the previous week with the lowest demand within the last two years.
The 10Y Treasury yields were moving relatively flat during the previous week, ranging from 4.6% down to 4.48%. Still, they are finishing the week at 4.65%. Charts are pointing to a probability for 4.8% to be tested for one more time. However, a move back toward the 5% yield, is highly unlikely at this moment. On the opposite side, the next support line stands at 4.4%, which is also pending testing in the weeks to come.

Yields - Bearish Quarterly OutlookOffering symmetry with my bonds analysis, I am seeing a bearish '22 model with a clear area that looks like an original consolidation. I am also bearish on on all assets that directly correlate with yields.

Another Inverted Yield Curve with Even More Predictive PowerThe Federal Reserve Chair Jerome Powell spoke again today at a Brookings Institution event. His comments sparked a rally in markets (likely including short covering) that pushed the S&P 500 SP:SPX up about 122 points, or 3.10%, to close at 4080. The Nasdaq 100 NASDAQ:NDX rose 4.58% on the day, closing at 12,030.
But the bond market is sending less sanguine signals. The 10Y/3M yield curve inverted further today. Its inversion is currently the deepest since the slightly deeper inversion of this segment of the yield curve in 2000-2001 inversion, which had presaged the 2-year bear market from 2000-2002.
The 10Y/3M curve has been researched more than the more widely known 10Y/2Y curve (also known as the 10s/2s). Experts say inversions of the 10Y/3M serve as better predictors of recession than the 10Y/2Y curve.
The yield curve has remained inverted for over a month now. This qualifies as a "persistent inversion" that creates a recession signal. But the recession does not always follow immediately. According to Jim Bianco of Bianco Research LLC, "The average lead time" until the recession arises "is 311 days, or about 10 months."
What does this offer for traders then? On days when equity markets are rallying like there is no tomorrow, it tells us that markets are not out of the woods despite the buying frenzy. It means that a recession is more probable than not in the next year. But it doesn't tell us much about where prices are headed in the near term (technical analysis of price itself works better for this purpose). Just because a recession will likely begin in the coming weeks or months does not necessitate that equity markets plummet in a straight line to the ideal target. Many, including this author, wishes it could be as straightforward and predictable.
So traders should also keep in mind that inverted curves are not a trading signal. They are part of the broader economic and rate-policy context within which equity markets operate. It helps me to know that markets are not likely to resume a long-term uptrend until the recession has ended.
The bond market tends to sniff out the problems in the economy long before other markets. And equity markets can ride on hope and desperation for much longer than anyone expects—just as this unexpected bear rally carried SPX price from the October 13, 2022 low all the way back above the 200-day MA today and higher to close at 4080.11.
Below is a chart of the 10Y/2Y yield curve, which is also inverted.
Supplementary Chart A:
To compare the current 10Y/2Y inversion with some historic inversions, consider reading this prior post from July 2022 on the 2s / 10s yield curve inversion, and be sure to hit the refresh button to see the most recent months of data. The Wall Street Journal Confirmed in recent days, by the way, that the 2s / 10s curve
Supplementary Chart B:
Finally, on a monthly chart, one can easily see that the 2s / 10s curve inversion is the deepest one on record—at least as far back as the chart allows. Hat tip to @SPY_Master for pointing this record-breaking inversion recently.
Supplementary Chart C:
