Possible bull flag? Pretty new to this. Looking for feedback to this idea. If breakout occurs, target is approximately the pole height.
Government bonds

Pick your fib target. How far do Bonds crash?Inverse chart of US 10 year bond yields.
6.249% looks like near certainty.
8%, 10% & 12% are all on the table.

Bank of Japan may further adjust its YCC policyGovernment bond yields are about to reach the 1% upper limit, and the Bank of Japan may further adjust its YCC policy.
Market attention is focused on the actions the Bank of Japan will take regarding the 1% yield cap.
On Tuesday of this week, the Asian economic calendar was filled with various important data releases, with the policy meeting of the Bank of Japan being the focus of traders. On the last trading day of the month, the Bank of Japan is expected to make a minor adjustment to its "Yield Curve Control" policy to effectively tighten monetary policy, which is significant for global markets and policies. This is followed by announcements from the Federal Reserve on Wednesday and the Bank of England on Thursday.
Japanese bond and currency markets:
The BOJ may further adjust its YCC policy to allow the yield on 10-year Japanese government bonds to rise above 1%, and the Japanese yen has been strengthening for the second consecutive trading day, with the 10-year bond yield reaching its highest level in a decade, approaching 0.89%.
Market reactions:
However, based on calculations of the real effective exchange rate (taking into account the impact of negative interest rates and other policies), the yen is the weakest it has been in over 50 years, attracting foreign buyers to purchase assets at relatively cheap prices. The Nikkei 225 stock index fell by 1%. These reactions reflect the market's uncertainty and tension regarding potential changes in the Bank of Japan's monetary policy.
Japanese stock market:
Initially, it saw a significant rise at the beginning of the year, driven by expectations of an improved economic outlook for Japan after years of stagnation. However, concerns about the Bank of Japan tightening monetary policy in the second half of the year have weighed on the market, leading to a decline in the Nikkei index.
As the possibility of the BOJ abandoning its ultra-loose monetary policy has grown, the Nikkei 225 has fallen by 3.6% this month. However, due to many investors betting on the resurgence of the Japanese economy after decades of stagnation, the Nikkei 225 saw an astonishing 27% increase from January to June, reaching a high of nearly 34,000 points.
Market reactions:
This attractiveness of the Japanese stock market to investors is due to factors such as negative interest rates, the large-scale holdings of Japanese government bonds by the Bank of Japan, and the depreciation of the yen.
Japanese inflation:
Inflation in Japan has begun to rise and has exceeded 2%, which is a significant development considering Japan's long-standing struggle with deflation."

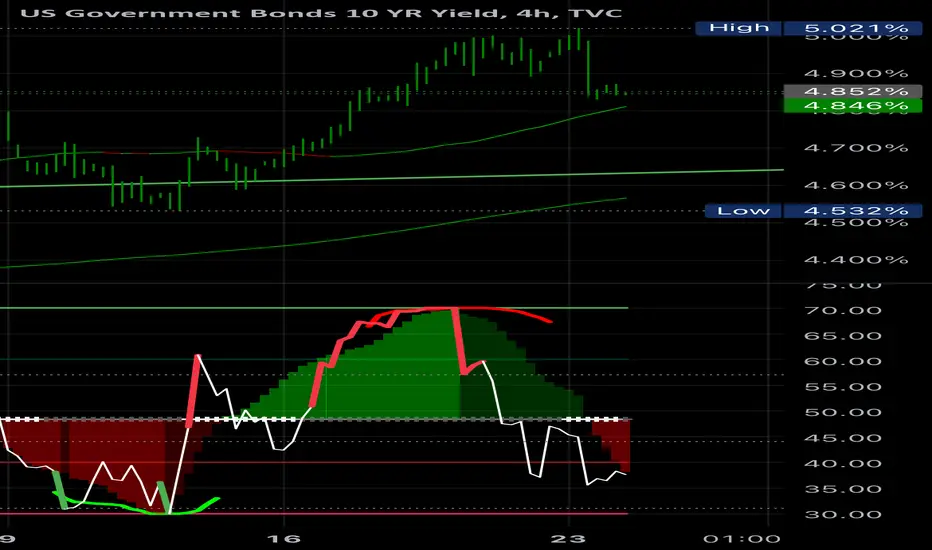
US 10-year yield topped out?The US 10-year yield is showing signs of topping out after recently touching a 16-year high just above 5.00%. It’s still too early to confirm that long-term yields have topped out but given the entrenched inflation, risk-off sentiment and growing US government debt, US long-term yields will probably remain elevated until the Fed’s interest rate policy becomes clearer. Yields of 4.80% is the first level of support and a break below this level will allow yields to ease lower towards 4.50%.
There is also a degree of divergence on the RSI that I'm keeping my eye on.

US 10Y TREASURY: waiting FOMCThe US Treasury yields eased a bit during the previous week, as inflation data are showing further relaxation in inflation figures. The 10Y US benchmark tested 5.0% level at the start of the previous week, however, the week ended at level of 4.83%. The FOMC meeting is scheduled for November 1st, but current expectations are that the Fed will not further increase interest rates due to the latest posted inflation figures. However, Fed Chair Powell's statement after the meeting will be closely watched, which might bring some volatility back in Treasury yields.
The 10Y Treasury yields will start the week ahead by testing 4.8% level. At this point on charts, there is no indication that yields have opted to return to the levels of 5.0% and above, in which sense, some further relaxation to the downside is probable. In this case, 4.6% might be a probable target and a short stop on the road toward 4.4% in the weeks to come.

10 Year wants 5%...at a minimumDo you really need to ask if interest rates have topped out?
Head & Shoulders patterns at tops and bottoms are generally spot on...this Inverse H&S pattern occurred at a bottom, clearly broke out from the neckline and just wants 5%...at a minimum.
"Don't fight the Fed"
The Fed is not going to pivot to the downside anytime soon...why would they? What makes anyone think this is on the horizon?
Here are the 3 things Powell stated would need to happen for a pause (not a pivot ) at Jackson Hole:
1. Lower Growth
2. Softening Labor Market
3. Inflation on pace to 2%.
2022 Q2 vs. Q3 GDP came in positive and much stronger than expected, Jobs reports remain hot and inflation isn't anywhere near 2%. So at this point, we can't even check off any boxes for a possible pause in rate hikes let alone a pivot . In addition, Powell hasn't really wavered in his statements since Covid, he's been pretty straightforward, so why would he all of a sudden change his behavior?

Raising Rates Here Will Blow Japan Up. Blowing Up US Yields
Up coming Federal Reserve meeting, there's still underlying inflation in the USA but the amount of interest on debt + Japan buying US debt while their currency is almost completely free falling.
Would be one of the worst fiscal policy disasters since 2009.
Looking at Japan's society they're completely clueless of how close they are to blowing up.

Uk rates TREND DOWNHas inflation peaked in uk? Based on rates markets YES... FOR NOW... uk rates moving down also inflation! Good for uk!

1 & 2 Yr Yield look like they're running out of steamGOOD MORNING!
These will be DAILY charts but what we really need to see is how the week will close for all of these (this was thread on X)
TVC:DXY & TVC:TNX both look like they're running out of steam. The #Dollar does seem to be fighting this break.
30YR Treasury, read above statement.
1YR stopped going up long ago.
Are 2 Yr #Yields finally breaking?

US10Y: Channel Up intact but first time on a Bearish Divergence.US10Y continues to rise inside a long term Channel Up, with its 1D technical outlook bullish (RSI = 57.618, MACD = 29.942, MACD = 0.116). The 1D RSI though is for the first time in the recent months under a LH bearish divergence so for the first time the probabilities for a bearish reversal get stronger. Consequently, if the price crosses under the Channel's bottom, we will see and target the 1D MA50 (TP = 4.600). Until then, we will but on the first 1D candle that closes under the S1 level, aiming at a +10.70% rise (TP = 5.185).
## If you like our free content follow our profile to get more daily ideas. ##
## Comments and likes are greatly appreciated. ##

10YR Treasury to Resume Rise Post-FedThe 10yr has taken a break in the past couple days off it's highs. This is normal but and happens regularly in the relentless overall path upwards in rates. The Fed has made all the signals that they are blind to the supply and demand issues of treasuries and willing to allow the market to do what it will as long as it results in less inflation. Chairman Powell in his September 26th speech stated that he still does not believe rates are restrictive enough and with a 4.9% GDP - although questionable at best - he will likely continue his hawkish tone in the November 1st meeting. Once the market realizes there will be another period in which no help is coming - along with a massive issuance of treasuries coming in November and in the line up for 2024 - rates will continue to rise into the end of the year. Target is 5.5% by EOY. I expect it to be choppy, but we won't be stopping here at 5%.
We broke about the blue horizontal line which is a Gann fan dating back to 1982's peak in rates. This is the first time in 40 years we've risen above this line and we've stayed over it. The pace higher will continue until something breaks or the Fed changes tone on their QT policy.
No one wants our treasuries - Japan, China, etc. The Fed isn't buying and Yellen keeps adding billions more to the market weekly. Important dates are November 8th and 9th where the 10 year and 30 year auctions take place. A bad auction could be the onset of the rise if the Fed doesn't provide that on Nov 1.

Bund Short Term MatrixA small simple project with some ideas for potential future scenarios. Icons are simulated potential price predictions. Rectangles can become zones of influence for the price action. Pivot points can occur around the time stamps. (Previous pivot points marked on the past price action).

When in doubt zoom out! 10 year likely falls to 4.73% next week giving stocks a reversal opportunity to trade back above 4,200.
B/C phase currently getting underway. TIMBERRRR


Stock Market looks weak The market looks very exposed as one of the big 7 tech stocks performed poorly this earnings season. Also, interest rates look like they may have peaked however, history shows when the short-term rates fall vs long-term rates (or when rates are cut) there is a correction in the stock market.

#US10Y Yields perhaps a little extended here short term?Got to be brave trying to run infront of this steamroller, but we are starting to see signs of bearish divergence where price(yield) is making higher highs, not confirmed by the RSI and MACD which are currently making lower highs. This could be warning of a short term reprieve in yields which could be bullish risk assets. However, given the current environment with conflict in the middle east, one has to becareful

this chart signals equities have peakednow the price of this chart is rising.
This means the yield of 10Y bond is rising
harder then the 2 year. which means
debt is more expensive. which means less
cheap money. money is still cheap in real terms
but now less cheap than a year ago.
what will the central bankers do?
inflation is hidden but still high and if your smart
you know the govt numbers are understated.
inflation tax is gonna wreck you.

US 10 YEAR YIELDS (UPDATE)🚀Despite hitting our target, the US10Y has kept pushing much higher due to economic uncertainty. Biden has requested for an extra $100 billion in Congress to fund the Russia & Ukraine war, to give money to Taiwan & more money to Israel, to carry on their genocide against Palestine.
If this $100 billion is approved, then we can expect Bond prices to carry on crashing, while the US10Y keeps reaching new highs.

Bond yields crashing down from here. My TA shows that bond yields will crash down here with the dollar (dxy). BTC just launched up and I believe the stock market is next.
$US10Y Negative Divergence RSITVC:US10Y Negative Divergence RSI The TVC:US10Y showcases a negative divergence in the Relative Strength Index (RSI). This indicates that while the 10-year U.S. Treasury yield might be increasing, the momentum behind this rise is weakening. Historically, such divergences in the RSI can signal potential trend reversals or price corrections in the near future. Investors and traders should be cautious and closely monitor subsequent price actions and other technical indicators to validate this potential divergence.

How the Fed affects long Bond YieldsInverse chart of US10Y Yield to show changes in Bond prices.
Overlayed with the following:
Fed Funds Rate
US Treasury Deposits to Federal Reserve Banks
Increase/Decrease Rate of change to Fed Balance Sheet
Balance Sheet Total in separate pane below
The USCBBS Percentage Change shows the money raining down :-D
It's clear to see the relationship between the Fed buying Treasuries, i.e. Quantitative Easing (QE) and the increase in US10Y prices.
Quantitative Tightening (QT) is the name of the game now. There is A LOT of QT left to do, we're at most 25% into QT since the Fed has only rolled off roughly 1Trillion. They likely have 3+ Trillion to go. Expect US10Y to be under continued pressure as long as QT is in effect. Even when Fed Funds rates are lowered it will have little effect on US10Y while the biggest buyer of Treasuries is on hiatus.

US 10Y Yields First time US 10Y Yields have hit the 5% mark since July of 2007.
Interesting to note.
Concurrent to this China has recently turned on the money printers which has lead to more PBOC Liquidity etc.
With that being said it has partially driven crypto prices, albeit low sentiment.
Which is lovely to see :)
Before I get political, this may or may not get controlled soon. I'll let my political views be up for speculation.
They may though deploy the same as Japan some yield curve control.
Crypto is still long for me (ofc).
Although, stocks and other risk assets are becoming more uncorrelated.
So do with that what you may.
There is no current sign of exhaustion, for the 10Y in the short term.
Soon enough though there will be.

US 10Y TREASURY: has finally topped?It was a sort of game of nerves during the previous week, watching the US 10Y yields reach the level of 5%. This occurred for the first time after 2007, but the difference on charts was that no one was sure whether yields would stop at this level. It was such a strong push to the upside, after Fed Chair Powell's speech at the Economic Club of New York on Thursday. Although he said nothing new with respect to potential further rising of interest rates or inflation, still, the markets did not want to hear that jobs and economic growth need to suffer in order to bring the inflation down to 2%. Adding to it the developments within the Middle East crisis, the perfect storm occurred with US Treasuries.
Friday`s trading session brought some ease in 10Y Treasury yields, so they finished the week at the level of 4.91%. In case that they continue to ease in the week ahead, then the level of 4.80 might be the next stop for yields. However, in the case of any potential negative news which might bring yields to the higher grounds from 5%, it would certainly not be at all a good sign for the future prospectus for the US economy.
