The Long, Flat Road AheadWith the Federal Reserve’s rate decision in focus, I wanted to revise a previous idea that called for 6% on the 10 year T-bill, and provide a clearer read on what I’m seeing as the larger trend, which could provide important clues for the future of everything from monetary policy, to mortgage rates, and stocks.
Starting with the 500R chart, I think we are seeing a clear flat correction form, with the current segment of the trend being Wave C of (B). In a flat correction, the endpoint of (B) should reach at least 100% of (A). It can also extend further or, in less common cases, only reach 90% of (A), however for the purposes of this idea I will assume the yield will retrace to the 100% level, which is just above 5%.
If this were to play out, it would suggest incoming pressure to financial markets that will eventually subside, likely later in the year. Something else to look for is that if this (B) wave were to fit a Zig Zag structure, that would cause waves (A) and (B) to be of the same pattern, so we should anticipate an alternate pattern in (C), such as a flat, diagonal, or triangle.
The question on everybody's mind at the moment is if/when the next interest rate cut is coming. For today's announcement, I expect there to be no surprises, which can also be supported by short term technicals.
Looking at the 100R chart (right) and Daily chart (left) at the same time provides useful context. The yield bounced off the 0.618 retracement of the 4/4 - 4/11 rise (labeled as 0.382 on the fib extension) and should have upward momentum. On the contrary, the Daily chart shows resistance at what appears to be a more well-defined lower high, with imbalances below. On the 100R chart, I also have a box drawn to show the extremities of the 500R bar. I expect the yield to move higher without creating a new 500R bar - which means the max low would be just below 4.10%.
A retracement to this level would lead to the yield hitting the middle line of the lower imbalance, which should be a key liquidity zone. From there, a move to the 1.618 extension would take the yield to the targeted 5%.
Something else I look for when detecting reversals is divergence on the Fisher Transform oscillator. I have it on both charts, which suggests a near-term move to the downside. Divergences are even more reliable on the Range charts, so a slightly lower low on the yield occurring while Fisher makes a higher low would signal that yields are about to rise higher.
Assuming we see similar action play out, this would support my fundamental prediction that FOMC will temporarily provide relief to the markets - possibly from there being no surprises or dovish comments on rate cuts. I would, however, expect this to be short lived. Since I am already calling for stocks to be near a major reversal level, I expect a sharp rise in bond yields to correspond with a more powerful sell off of stocks than what we saw in February-April. More likely catalysts could be hot CPI and/or failure of US/China trade talks.
Since there isn't much left to comment about on the technical side of things, I'll leave it at that. I ultimately expect the yield to start moving to 5%, so if it starts moving higher from here (4.36% currently), it would invalidate the idea that this will make one more push lower this week. We'll see what happens. Thank you for reading and let me know what you think!
Government bonds

Will The FED cut rates? Maximum employment & stable prices were the choice of words from Jerome Powell last meeting addressing the economy.
While the headline Personal Consumption Expenditures (PCE) price index rose by 2.3% year-over-year in March 2025, the core PCE, which excludes food & energy, increased by 2.6%. Additionally the NY Fed's multivariate core trend suggests underlying inflation may be closer to 3.0%, indicating persistent inflationary pressures.
The April jobs report showed stronger than expected job growth, with unemployment remaining steady at 4.2%. This robust labor market reduces the urgency for immediate rate cuts.
Recent tariff implementations have contributed to rising inflation expectations, with a one year outlook projecting 6.5% inflation. This complicates the Fed's decision making, as cutting rates amid rising inflation expectations could undermine its credibility.
Now let's zoom out to June 2025 the probability of a rate cut at the June meeting has decreased to 37% following strong economic data.
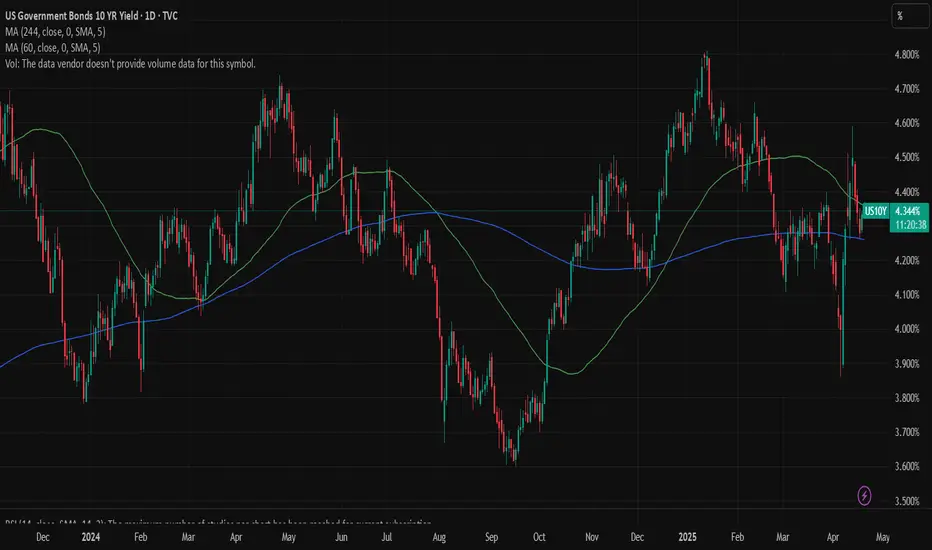
My Chart gives a great outlook on rate cut possibilities and how we can take an overall outlook on the economy based on 10 yr Government Bond. I was able to add in a few important dates along with starting & ending points of rate cuts throughout those time frames. I did not include all the rate cuts in between. However, it can still serve as a great indicator moving forward. I hope this helps and let's hope for the best in our economy moving forward.

10Y Bond Yield Long: Riding Wave 3This is an update to my previous Elliott wave counts for 10Y yield. I believed we have completed a wave 2 and is now going into a wave 3. What this means is that if you are trading futures, it is the opposite: short futures (ZN1!).

Recession indicator #2 Just realized that measuring the spread between TVC:US02Y and FRED:FEDFUNDS gives you a pretty accurate heads up of looming recessions. We might be in one from a few months now.

US 10Y TREASURY: rollercoaster, againMarket movements in a previous period are clearly showing how high uncertainty is currently among market participants. The US Treasuries for one more time took the downtrend during the previous week, clearly testing the 4,2% level with 10Y US benchmark, but Fridays better than expected jobs report, was a trigger for a move back toward the higher grounds. The lowest weekly level of 10Y yields was 4,13% on Thursday, however, the rest of the trading week the market was looking at the upside. The strong move up, brought the 10Y yields toward the level of 4,30% where yields have closed the trading week.
The volatility might continue also during the week ahead. The FOMC meeting is scheduled for May 6-7th, while on Wednesday will be the interest rate decision day, and also Fed Chair Powell's address to the public. As per current market expectations, as posted by the CME Group FedWatch Tool, the Fed could leave interest rates unchanged at this meeting, considering stronger than expected jobs data posted during this week. In addition, the market is expecting that the Fed will not change interest rates until their meeting in July. At the same time, analysts are noting that it is too early to see the reflection of trade tariffs in real economy, concretely in jobs data, in which sense, they are taking precaution with current strong jobs data. In this sense, the Fed Chair Powell's speech, after the FOMC meeting will be closely watched by markets, for a standing of Fed on the current state of the US economy as well as their view on tariffs repercussions in the future period.

US10Y - April ReviewWhenever we are faced with a market that is consolidating, it's best to lower your leverage and aim for low hanging fruits.
Gun to my head, I would like to see a bullish draw to 4.440% but after that price is met, anything goes!

10Y Note Auction & Why Markets did %10 Movement with Last Data?Hello Traders tomorrow we have 10-Year Note Auction data and I wanted to prepare a nice little information for you about this topic because the data released last month showed an immediate 10% increase and from what I saw, many people had no idea what was happening.
📌 What is the 10-Year Note Auction?
The U.S. government regularly issues 10-year Treasury notes to finance its budget. The auction result reflects investor demand and long-term interest rate expectations. The yield (interest rate) that results from the auction is a key benchmark for financial markets globally.
🔄 Connection to U.S. Stocks and EUR/USD
🟢 If Demand Is Strong (Yields Stay Low):
Investors are eager to buy U.S. debt, pushing prices up and yields down.
This indicates confidence in the U.S. economy and little concern about inflation or rate hikes.
Stock markets generally react positively.
🔴 If Demand Is Weak (Yields Rise):
Investors require higher returns, possibly due to inflation fears or policy tightening expectations.
This pushes yields up, increasing borrowing costs and reducing the attractiveness of risk assets.
Stocks typically decline, and the dollar strengthens.
💱 Effect on EUR/USD
🟢 If Yields Rise:
U.S. dollar becomes more attractive due to higher returns.
Investors buy USD to invest in Treasuries.
EUR/USD typically falls.
🔴 If Yields Fall:
Lower yields reduce the appeal of the dollar.
Investors may move capital elsewhere.
EUR/USD tends to rise.
🗓️ Latest 10-Year Treasury Auction – April 9, 2025
Auction Size: $39 billion
High Yield: 4.435%
Expected (WI) Yield: 4.465%
Outcome: Strong demand – yield came in lower than expected.
📊 Post-Auction Market Reactions
🔹 10Y Treasury Yield:
Before auction: ~4.466%
After auction: Dropped to ~4.38%
➝ Reflects strong investor demand and confidence in long-term stability.
🔹 S&P 500 Index:
Lower yields reduce borrowing costs and support equity valuations.
Investors often shift toward riskier assets like stocks when yields fall.
The S&P 500 responded positively after the auction.
🔹 EUR/USD:
Falling yields reduce the dollar's relative appeal.
This may push EUR/USD higher, depending on other macroeconomic influences (like ECB policy or geopolitical risks).
✅ Conclusion
The April 9, 2025, 10-year Treasury auction showed strong demand with a yield lower than market expectations. This led to a drop in yields, a positive reaction in U.S. stock markets, and potential downward pressure on the dollar, which may support EUR/USD.

US10YA bond is essentially a loan made by an investor to a borrower, which can be a government or a corporation. It is a fixed-income financial instrument where the borrower agrees to pay back the principal amount (face value) on a specified maturity date and usually makes periodic interest payments called coupons to the bondholder.
What Is a Government Bond?
A government bond is a type of bond issued by a national government to raise funds. When you buy a government bond, you are lending money to the government in exchange for regular interest payments and the return of the bond’s face value at maturity. These bonds are often considered low-risk because they are backed by the government’s credit and taxing power.
Why Do Governments Offer Bonds?
Governments issue bonds primarily to:
Finance Fiscal Deficits: Bonds help cover budget shortfalls without immediately raising taxes or cutting spending.
Fund Public Projects: Money raised can be used for infrastructure, schools, hospitals, and other public services.
Manage Debt: Governments use bonds to refinance maturing debt or restructure their debt profile.
Control Monetary Policy: Central banks may buy or sell government bonds to influence money supply and interest rates.
Develop Financial Markets: Issuing bonds establishes benchmark yields that help price other financial instruments and deepen capital markets
Provide Investment Opportunities: Bonds offer a relatively safe investment option, encouraging savings and investment within the economy.
Summary
Aspect Explanation
Bond A loan from an investor to a borrower with interest payments
Government Bond Debt security issued by a government to fund spending
Why Issued To finance deficits, fund projects, manage debt, and control monetary policy
Risk Level Generally low risk due to government backing
Investor Benefit Periodic interest (coupon) and principal repayment at maturity
In short, government bonds are a crucial tool for governments to raise capital sustainably while providing investors with a relatively safe income stream.
Difference Between Bond Yield and Bond Price and Their Effect on the US Dollar
Bond Price vs. Bond Yield: The Inverse Relationship
Bond Price is the current market value or price investors pay to buy a bond. It can be above (premium), below (discount), or equal to the bond’s face (par) value.
Bond Yield is the return an investor earns on a bond, expressed as a percentage. It reflects the income from coupon payments relative to the bond’s current price, and can be calculated as the current yield or yield to maturity.
Key point: Bond price and bond yield move in opposite directions.
When bond prices rise, yields fall because the fixed coupon payments represent a smaller return relative to the higher price paid.
When bond prices fall, yields rise to compensate investors for the lower price paid for the same fixed coupon payments.
Why This Happens
If interest rates in the market increase, new bonds offer higher coupon rates. Existing bonds with lower coupons become less attractive, so their prices drop to increase their effective yield to match market rates. Conversely, if interest rates fall, existing bonds with higher coupons become more valuable, pushing their prices up and yields down.
How Bond Yields and Prices Affect the US Dollar
Higher US Treasury Yields (rising yields due to falling bond prices) tend to strengthen the US dollar. This is because higher yields attract foreign investors seeking better returns on US debt, increasing demand for USD to buy Treasuries.
Conversely, falling yields (rising bond prices) make US assets less attractive, potentially weakening the USD as capital flows out or seek higher returns elsewhere.
The US Dollar Index (DXY) often moves in tandem with US Treasury yields because both reflect investor sentiment about US economic strength, inflation expectations, and Federal Reserve policy.
When the Fed raises interest rates, bond yields typically rise, boosting the USD. When the Fed cuts rates, yields fall, putting downward pressure on the USD.
In essence: When bond prices fall and yields rise, the US dollar tends to strengthen due to increased demand for higher-yielding US assets. Conversely, rising bond prices and falling yields usually weaken the dollar.

$US10Y making new lows. 4% upcoming. 3.5% target low.TVC:US10Y is going through a volatile period. After ‘Liberation Day’ the standard deviation if the movements in the TVC:US10Y has gone up significantly affecting the Equity and Bond indexes. This has been volatility story for the last 1-2 months. Now we are touching the midpoint of the downward sloping parallel channel which lies at 4.1 %. On the medium term the downward sloping channel indicates we can touch the Midpoint of 4.0 %.
The downward spiral in the rates will continue for the foreseeable future because the Fed will decrease rates, and this will put pressure on the $US10Y. In the long term the rates will touch 3.5% by end of the year.
Verdict: TVC:US10Y to 4% in near term and 3.5% by Dec 2025. Short $US10Y.

Macro Bullish Rates?An over simplification? I hope so.
The narrative fits too close for me. Needless to say, it's worth keeping an eye on.
If we manage to keep interest rates low for a while but inflation creeps in again (not due to high demand but because of monetary inflation) I can see the debt spiral scenario playing out in full force. This is a chilling thought, not something my generation has been exposed to and I believe it could have a very different impact to the population than the previous cycle. The difference being of course, the inflation not being demand driven but monetary debasement driven. To me this practically means a more impoverished population that is already struggling and those holding assets will further increase their portion of the pie.
There are a lot of unknows for me, as I basically know nothing about this. These are just my back of napkin thoughts. Me, trying to make sense of the world we live in because I know you can't look to anyone for the answer. Why? Frankly, I have learned that 98% of us don't know anything.
Ps - I am still not taking the deflationary narrative play off the table. Population decline, low interest rates and using robots to increase GDP etc. But either way all I can see is a exponential increase in debt creation. What other option is there? Both scenarios can't possibly lead to the same outcome, can they?

10 Yr Bond Yield breaks downtrend & then falls back into it!10 Yr Bond yields seem to have topped after that massive 1 week run. That was an impressive run! TVC:TNX
Even though the downtrend was broken, the 10Yr Yield put in a LOWER high.
We can also see that the recent uptrend was violated, back in a down trend.
Short term interest rates look worse!

US10Y - Higher Probability Times Are to Come Soon!Throughout this month, its been nothing but indecision in the markets and it does not look like anything will change anytime soon!
With the reciprocal tariffs running rampant throughout the economy, investors and traders cannot make up their mind whether they want to be a buyer or seller.
Best thing to do is sit on your hands and be patient as market conditions like this have the power of ripping your face off!

Stock markets STILL not out of the woods.Stock markets STILL not out of the woods.
The setup is there for an EPIC fail.
But WHEN?

US 10Y TREASURY: NFP and jobs data ahead There has been another pullback in the 10Y US Treasury yields during the previous week. It comes as a result of investors' anticipation that the trade war between the US and China might soon be finalized. However, this sentiment is again based on mixed signals coming from the US Administration during the previous week. What will be the final result, no one actually knows, not even the US Administration, as per some analysts. The US President is still putting pressures on Fed Chair Powell to lower interest rates, which he noted on several occasions in interviews.
Anyway, the data show that the 10Y US yields started the previous week around 4,42% and dropped during the rest of the week to the Fridays level of 4,25%. Certainly, as long as the US Administration is using the push-and-pull strategy regarding trade tariffs, the market volatility will continue. And it is not only the US Treasury bond market, but also prices of equities and gold. As per technical analysis, the 4,2% level is the supporting level for the 10Y yields, which will be tested again in the week ahead. Still, it should be considered that the US NFP and jobs data will be released, where Friday is again day to closely watch, as it might bring for one more time a surprisingly volatile trading day.

Rates - Trend to Continue UpWhile rates soften after a recent surge, the 10 month moving average will likely continue to rise over time. Paring back on rate sensitive stocks seems like a good idea going forward.

Interest Rates don't seem to want to slow downWe believed that interest rates were going higher in Early April/Late March.
The Bullish Engulfing formation was a sign that higher interest rates were coming TVC:TNX
The 10 Yr Yield Downtrend was broken, it retraced some, we posted that it was likely consolidating, & seems to want to go a little higher.
Central Banks worldwide are lowering rates while the US is raising them.
---
Please see our profile for more info... We do post a lot.

US 10Y TREASURY: just a short correctionTariffs continue to be the major market concern, considering its potential impact on inflation, and at the last distance - the decision of the Fed to cut interest rates during the course of this year. The US Administration continues to urge the Fed to cut interest rates, noting that this is the right moment for such a move, while Fed Chair Powell refuses to comment. However, during the previous week, Powell publicly noted that the US economy might be hurt with tariffs in terms of higher inflation. This was not something that the markets were happy to hear, as it meant the possibility of even no rate cuts during the course of this year. The US Treasury yields reacted to this comment from Powell, bringing back volatility to the bond market.
The 10Y US Treasury benchmark started the week around 4,48%, and was traded toward the downside during the course of the week. The lowest weekly level was achieved on Wednesday, at 4,27%, but the reversal came on Thursday, when yields reverted back toward the 4,33%. Analysts are still cautious to bring their revised forecast for the US economy. Firstly, because the tariffs are so uncertain, and change almost on a daily basis, where it is extremely hard to bring into the light forecast of their impact on the US economy. However, as long as the US Administration uses tariffs narrative, the volatility on the market will continue.
2-Year US Treasury Yield: The Market's Immediate Sentiment GaugeThe 2-year Yield currently trades at 3.805%, unfolding within a well-defined three-year falling wedge pattern. This formation follows an extraordinary surge from 0.105% in January 2021 to 5.283% in October 2023—reflecting rapid Fed rate hikes and inflation expectations. The 4.00% level, which aligns with the Fibonacci 23.6% retracement, has been tested multiple times, indicating it as the immediate battlefield for bulls and bears.
Warning Signs: If yields fail to stay above 4.00%, a decline toward 3.54% and 3.25% becomes probable, with further downside risk to 2.80%, 2.62%, 2.34%, and potentially 2.16%. A drop this deep would imply markets are aggressively pricing in future rate cuts or recession fears.
Breakout Scenario: A decisive break above 4.00% would violate the falling wedge ceiling, targeting 4.17% and 4.46% and possibly retesting the 5.00% highs. This would indicate renewed fears of sticky inflation or delayed Fed easing.
Fundamental Reflection: The 2-Year is the cleanest read on front-end Fed policy sentiment. Its sensitivity to Fed language, inflation trends, and geopolitical disruption (e.g., tariffs) means its technical posture is deeply rooted in macroeconomic fragility.

10-Year Treasury Yield: Final Move Before Collapse?
The 10-year US Treasury Yield, once the benchmark of global confidence, is now exhibiting signs of a macro top. Since its 2020 low of 0.333%, it surged to 5.00% in October 2023, marking the end of the 40-year bond bull market. It now trades around 4.20%—a key Fibonacci confluence zone and the March 2025 breakout retest area.
A breakdown below 3.95%–3.82% could trigger a cascade to:
3.30%
3.16%
2.85% and 2.63%
This would imply disinflation, economic contraction, or systemic bond market stress.
The consequence? Institutional investors are diversifying out of bonds—once considered the safest asset class—and looking for alternative long-duration stores of value.
Gold has always been the traditional hedge. But now, with Bitcoin's price stabilizing and institutional credibility growing, it's being seriously considered as a digital parallel to gold.

US10Y - 90 Day Halt On Tariffs Rattles The Market!Extreme levels of volatility has ensued after the news was released that tariffs will be held for 90 days.
When will we see the return of the norm?

GRE30You can buy after the price touches the 96.23 area, as it is a very suitable area for buying with a very simple stop loss and a distant target.

US02YThe differential between the US02Y (2-year U.S. Treasury yield) and EUR02Y (2-year Eurozone government bond yield) significantly influences the trade directional bias for the USD and EUR this month. Here's how:
Impact of Yield Differential on Currency Trade
Interest Rate Differentials: A widening yield spread between US02Y and EUR02Y, where U.S. yields rise more than Eurozone yields, typically supports the U.S. dollar (USD) against the euro (EUR). This is because higher yields in the U.S. attract more capital, increasing demand for the USD and causing it to appreciate relative to the EUR. Conversely, if Eurozone yields rise faster, the euro may strengthen against the dollar.
Monetary Policy Expectations: The yield differential also reflects expectations about future monetary policy actions by the Federal Reserve (Fed) and the European Central Bank (ECB). If the yield spread widens in favor of the U.S., it may indicate expectations of more aggressive rate hikes by the Fed compared to the ECB, supporting the USD. If the spread narrows or reverses, it could signal a more dovish Fed stance or a more hawkish ECB stance, potentially weakening the USD.
Risk Sentiment and Economic Outlook: Rising yields in either region can signal improving economic conditions and confidence, attracting investment and supporting the respective currency. However, if yields rise due to inflation concerns or economic uncertainty, the impact on currency strength can be more complex.
Trade Directional Bias This Month
USD Bias: If the US02Y yield remains higher than the EUR02Y yield, Long positions in the USD, expecting it to strengthen against the EUR due to higher returns and potentially more aggressive Fed rate hikes.
EUR Bias: Conversely, if the EUR02Y yield rises faster than the US02Y yield, long positions in the EUR, anticipating euro strength due to higher returns and possibly more hawkish ECB policy.
Key Factors to Watch
Monetary Policy Announcements: Any statements from the Fed or ECB about future rate decisions can significantly impact yield differentials and currency movements.
Economic Indicators: Data on inflation, GDP growth, and employment can influence yield spreads and currency trade.
Market Sentiment: Shifts in investor risk appetite and confidence in economic growth can also affect currency direction.
In summary, the yield differential between US02Y and EUR02Y is a crucial indicator for determining trade directional bias in the USD/EUR pair. A wider spread favoring the U.S. generally supports the USD, while a narrowing or reversal supports the EUR.

EUR02YThe EUR 2-year yield (EUR 2Y) influences the euro currency strength primarily through its role as a short-term interest rate indicator reflecting market expectations of monetary policy and economic conditions in the Eurozone.
How EUR 2Y Yield Affects Euro Strength
Interest Rate Expectations and Carry Trade: The 2-year yield is sensitive to expectations about ECB policy moves, such as rate hikes or cuts. Rising EUR 2Y yields typically signal expectations of tighter ECB policy or stronger economic growth, which attract capital inflows seeking higher returns, thereby supporting euro appreciation. Conversely, falling 2Y yields suggest easing or weaker growth, reducing euro demand.
Monetary Policy Differentials: The EUR 2Y yield compared to US 2-year Treasury yields forms part of the short-term interest rate differential. A narrowing differential (i.e., EUR 2Y rising relative to USD 2Y) tends to strengthen the euro, while a widening gap favoring the US dollar weakens the euro. This is because capital flows follow yield advantages, influencing currency demand.
Market Sentiment and Risk Appetite: Since the 2-year yield reflects near-term economic and policy outlook, it also captures market sentiment. If investors perceive the Eurozone economy as resilient and the ECB as likely to maintain or raise rates, EUR 2Y yields rise, boosting euro strength. If uncertainty or dovish signals dominate, yields fall and the euro weakens.
Bond Market and Currency Link: Bond yields, including the 2-year, serve as indicators of a nation's economic health and monetary stance. Higher short-term yields increase the attractiveness of euro-denominated assets, increasing demand for the euro currency.
Summary
The EUR 2-year yield acts as a barometer of ECB policy expectations and Eurozone economic prospects. Rising EUR 2Y yields generally support euro strength by attracting capital inflows and narrowing yield differentials with the US. Falling EUR 2Y yields signal dovish policy or economic weakness, leading to euro depreciation. Therefore, movements in the EUR 2Y yield should be watched by forex traders as a key driver of the euro's directional bias against other currencies, notably the USD.
