US 10Y TREASURY: a roller coasterThe roller coaster continues to be in the heart of financial markets during the previous period. The uncertainty over the trade tariffs, mixed macro data, Fed President Powell`s notes, all contributed to the strong shift in prices of assets across financial markets during the last few weeks. Previous week the 10Y US benchmark started with a lowest level of 4,10% and then moved toward the higher grounds for the rest of the week. The highest weekly level was 4,33% reached on Thursday, while the level of 4,20 was tested on several occasions.
The US NFP data for February, with 151K was lower from market estimated 170K. At the same time, the unemployment rate jumped to 4,1%, from 4,0% posted previously. In this sense, analysts are currently calculating that the next Fed's rate cut might come in June this year. In this sense, the yields of US Treasuries were adjusted. However, the uncertainties over trade tariffs and its impact on the US economy continues to be a known-unknown, which might shape the sentiment of the market also in the future period and its roller coaster moves.
Government bonds

How we financing this¿Yields have been going down for 40 years while debt/gdp growing, how are we financing this hiking rates?

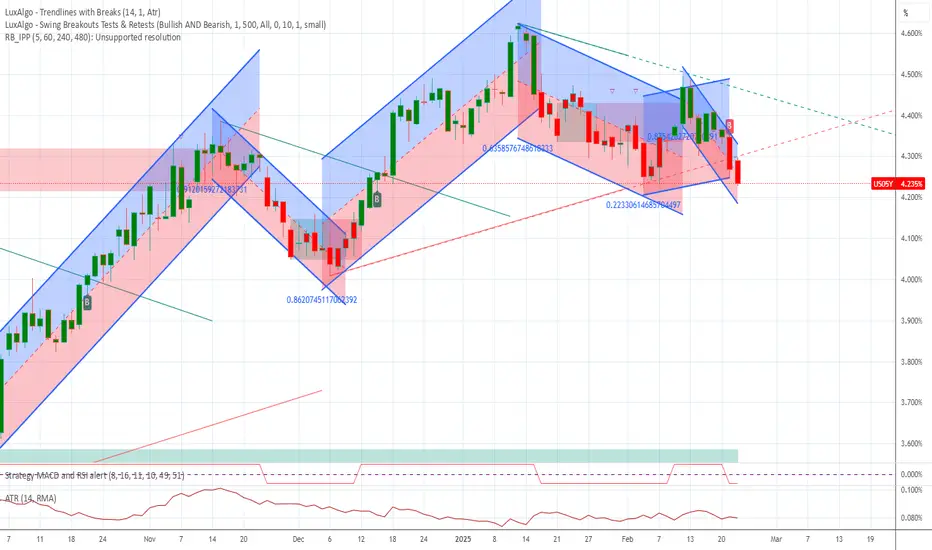
US 10YR Treaury Yield Stock Chart Fibonacci Analysys 030825Trading Idea
1) Find a FIBO slingshot
2) Check FIBO 61.80% level
3) Entry Point > 4.2/61.80%
Chart time frame: B
A) 15 min(1W-3M)
B) 1 hr(3M-6M)
C) 4 hr(6M-1year)
D) 1 day(1-3years)
Stock progress: A
A) Keep rising over 61.80% resistance
B) 61.80% resistance
C) 61.80% support
D) Hit the bottom
E) Hit the top
Stocks rise as they rise from support and fall from resistance. Our goal is to find a low support point and enter. It can be referred to as buying at the pullback point. The pullback point can be found with a Fibonacci extension of 61.80%. This is a step to find entry level. 1) Find a triangle (Fibonacci Speed Fan Line) that connects the high (resistance) and low (support) points of the stock in progress, where it is continuously expressed as a Slingshot, 2) and create a Fibonacci extension level for the first rising wave from the start point of slingshot pattern.
When the current price goes over 61.80% level , that can be a good entry point, especially if the SMA 100 and 200 curves are gathered together at 61.80%, it is a very good entry point.
As a great help, tradingview provides these Fibonacci speed fan lines and extension levels with ease. So if you use the Fibonacci fan line, the extension level, and the SMA 100/200 curve well, you can find an entry point for the stock market. At least you have to enter at this low point to avoid trading failure, and if you are skilled at entering this low point, with fibonacci6180 technique, your reading skill to chart will be greatly improved.
If you want to do day trading, please set the time frame to 5 minutes or 15 minutes, and you will see many of the low point of rising stocks.
If want to prefer long term range trading, you can set the time frame to 1 hr or 1 day.

Watch credit spread increase drive toward correction territoryThe Nasdaq is already flirting with correction territory, and other major market indices may follow as the credit spread increases. As the market indicates its perceived increased risk in corporate default, this spread (high-yield bond yield minus 10y bond yield) increases independent of what the Fed does.
If the recent mini-spike up to ~7.5% heads north of 10% in short order--6 to 9 weeks perhaps, I'll become proportionally bearish.
The calculation: Subtract the US10Y (left/middle blue line) from the High-yield bond yield (right purple line) to obtain the spread.
As of 7 Mar 2025, 11.95% - 4.305% = 7.65%

Rate Cuts Are NOT BullishRate cuts in the US have never been bullish for equity markets in macro cycles. The idea that rates coming down from 5% to 4% suddenly making people more creditworthy is a farce because rates never move in anything other than large timeframe tides. These tides reflect growth/inflation expectations, not borrowing costs.
Were Jerome Powell to suddenly become very dovish at the next FOMC meeting it would be a clear signal that the SHTF protocol is in full effect. Powell is more likely to talk away the negative GDP prints as demand shocks due to tariffs/trade deficit imbalances while waiting for more data to make a decision. Labor market has been declining as well but he doesn't want to make a panic decision and also probably feels no personal loyalty to help President Trump out.
Historical average for US inflation is about 3.2% with the 2% target meaning deflation is a possible problem incoming. Current US inflation rate is about 3% which is well inline with the historical average. Powell will never say it but so far his mission has been accomplished. He may cut rates at the back end of the year if necessary but as of this post he has no reason to.

CNBCAnyone remember 2 years ago when yield curve inversions were happening and they moved the goal post for recession? Naw, nothing to see here! Jim Cramer just like 6 months ago said that anyone that uses the yield curve as a tool is spreading FOMO and FUD, blah, blah, blah. I still cannot believe after the Wells Fargo garbage anyone would ever listen to Cramer but they still do. It just shows who in the market is delusional. Just focus on earnings he said. Now that Trump is in office the main stream media has done a complete 180 degrees. On CNBC yesterday: The federal Reserve's favorite recession indicator is now flashing warning signs. Nobody in mainstream media was saying anything about recession's on the Biden administration clock but now that Trump is in office the yield curve and inversions matter? This just did not happen overnight, not even remotely. You can look up numerous charts that show spending by President and Biden was the absolute worst, ever. If you listen to facts, you cannot fail as a trader but if you play follow the leader, you absolutely will get your rear end handed to you. Follow charts, not feelings, not the news, especially CNBC. Here is a news flash, recession: You wish, The Great Depression 2.0 with WW3 is next. You cannot print into oblivion and think nobody is going to pay for this. The US dollar isn't even worth 3 cents. People think inflation is the cost of products going up. It is not, inflation is the dollar worth less and that is why the dollar does not get stretched as far. Companies just take advantage of inflation to jack prices and line their pockets. It really is that simple. Back during the Great Depression, JP Morgan bailed the market out. Fun Facts:
-J.P. Morgan was a banker who helped the U.S. government during the Panic of 1893 and the Panic of 1907.
-During the Panic of 1893, Morgan helped the U.S. government by purchasing $62 million in gold to replenish the government's gold reserves.
-During the Panic of 1907, Morgan and his banker friends purchased $30 million in city bonds to prevent a financial collapse.
-Morgan also helped to finance the merger of Edison General Electric and Thomson-Houston Electric Company to form General Electric in 1891. A total of less than $100 million.
You are not bailing out a market that is over $30 Trillion in debt, so what happens? You want to know the truth? We don't do anything, default on the debt, the dollar crashes (which it already has) and we move to a new system. Which is CBDC, or Central Bank Digital Currency. Why do you think Trump is so big on crypto? Because he knows what is next, he is a business man. No matter what you think about presidents as people, they are all in on this and you're not invited. This is why I swing trade because until this hits bottom and I am talking S&P 500 to 1100 type of bottom, there's nothing long that looks great at all. We have to crash first. So many falsehoods out there being propagated by main stream media and wanna be traders, instead of just saying the truth. In the markets, it doesn't matter which side you're on, money doesn't care who you vote for. Stick to the charts and you cannot lose in short term trades. It isn't about the quantity of trades and your 40 accounts. It's about the quality, in and out. We have to stop lying in the financial world because of political sides. Politics does not belong on Wall Street. In the late 90's, I never even heard anyone talk about Democrats or Republicans on the trading floor. My point of all this? Do you see how following narratives can get you into trouble? 401ks, pensions, retirements are going to implode when the debt market finally gives way. Get ready folks!!

US10Y - End of February Analysis- February bearish monthly bias has been achieved this month!
- Sellside liquidity rests below 4.126%
- The possibility still exists for a short-term bullish retracement filling part of the imbalance this months candle created.
- Looking out for a retracement then capitulation through Sellside liquidity @ 4.126%
- Fair value gap lays close @ 3.932% – 4.170% so I will be paying close attention to it.

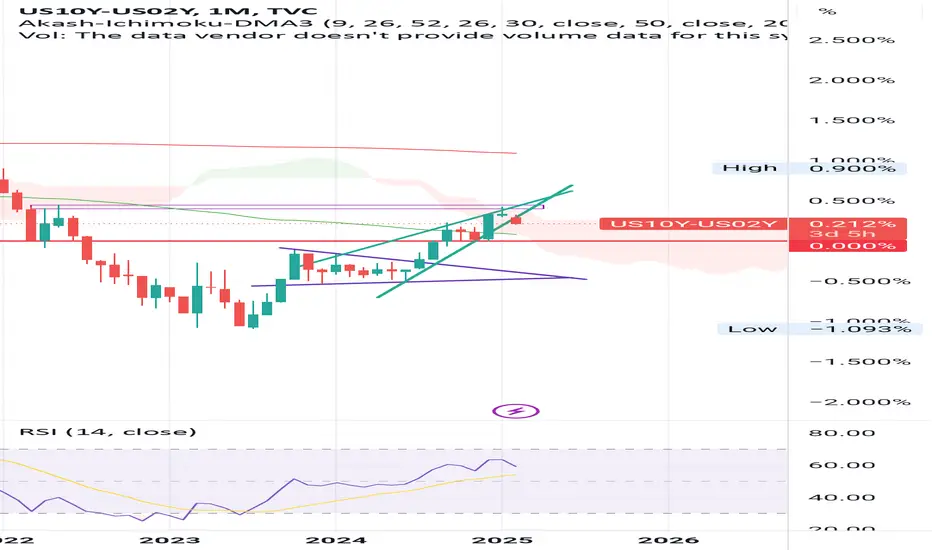
USD10Y Vs US02Y Bond LongUSD10Y Vs US02Y is now net long on the regression break.
I am not taking this trade, as it just of interest in market sentiment

US 10-Year Yield and USDJPY CorrelationThe correlation between the US 10-Year Yield curve and USDJPY has been especially strong over the past 3 years. If the Yen carry trade unwinds, we could potentially see the 10-year hitting 3% this year.

US 10-year yields eyeing move towards 4.00%Previous string of ideas has been invalidated following last week's price action.
The US 10-year yield completely crashed through the support at 4.40% last week following a host of strong data prints from the US coupled with a wave of risk-off investor sentiment stoked by Trump’s tariff fears which had investors rushing to the safety of US treasuries. Could Trump’s hardline tariff stance perhaps be a way to create demand for US debt?
Technically the yields have now dropped into oversold territory which strengthens the support between 4.13% and 4.17% however continued volatility in the equity markets will allow the US treasury market to attract more interest which could allow for a deeper move towards the 38.2% Fibo retracement at 4.04%.
The headlining events for this week is the ECB interest rate meeting and the NFPs for February. Market expectations are for the ECB to cut rates from 2.9% to 2.65%. The ECB has held a more dovish stance than the Fed since the rate cutting cycle began and if it’s more of the same on Thursday, I expect the US 10-year yield to find more demand to hold onto levels below the critical 200-day MA at 2.43%. Most of the focus will however be on the US non-farm payroll print for February. The NFPs print for January came in slightly lower than expected and another weak print on Friday will have investors question the validity of Powell’s statement that the US economy is strong and that the Fed is in no rush to cut interest rates. A weak NFP print will thus be positive for the US treasury bulls.

US 10Y TREASURY: uncertainty demands T-bonds Geopolitics were once again in the spotlight of market sentiment during the previous week. The uncertainty over the potential future increased tensions within the geopolitical sphere, pushed the US Treasury yields further to the lower grounds. Increased demand started with uncertainty over trade tariffs and currently is affected by politics. The funds from US equity markets fled toward the US Treasury bonds. The 10Y US benchmark yields started the week around 4,45% and ended it at 4,20%.
Looking at charts, the major support line for 10Y US yields lies around the level of 4,15%. In this sense, there is space for yields to move further toward the downside. Whether this would be the case for the week ahead is uncertain. There is also probability for yields to revert a bit toward the higher grounds, but some significant move should not be expected in the week ahead. Potential level could be the 4,3%.

US 2 Year Yields Falling Back Below Key Pivot!US 2 Year Yields Falling Back Below Key Pivot!
Is the next leg down signaling a major market correction?
Expect the Fed Fund Rates to be cut sooner rather than later.
However, no need to front run this possibility, simply observe the charts. Stay safe.

As GDP Falls Off a Cliff, so Will Interest RatesIt is not different this time. This is how the cycles work. Bond rally of the ages dead ahead

US10Y - Fed’s Dovish Whispers Crush YieldsAn absolute peach of a delivery this week with the yields dropping into a discounted price region of the market; 4.468% as expected.
What can we look forward to next week?

US01Y Bond LongUS02Y Bond is now net-short with the 05Y and 10Y bond.
Is this a sign of things to come in the market?

US10Y - US03M zoomed inSame story as last time, just a view of what I think will happen now
Not financial advice

10YBonds: Yielding?Any close below 4.24 may act like a cool breeze for EMs, a less than 4 is required for nifty to start performing back. The channel looks like already broken on the downside and RSI is already have broken all supports, Lets see how it plays, expecting it reach below 4.

10 Year YieldRates are going lower. Bullish signal for lower rates as shown by MACD and RSI.
For informational purposes only. Not a recommendation.

US05Y Bond LongUS05Y Bond is now Net-Long on the Regression Break.
I am considering a Bond Trade with the markets under pressure.
US10Y Bond Long US10Y bond is now net-Long on the Regression Break.
Pressure is building in the USA Indexs and pushing arcoss to the bond markets.
I am considering this trade.

USD outlook: The DJT wrecking ball+1 is gaining momentumHello traders
First of all, best of luck for yet another challenging week ahead.
I usually keep my charts simple in appearance but in this case I toyed around with the canvas to illustrate the direction of these three USD instruments. It also gave me the opportunity to simmer down before I start writing my next Idea on EUR/USD.
The charts tell the story. The FOMC's 50 bps rate cut on September 18th 2024 caused considerable consternation in the markets. It was a turning point for all three USD instruments because it was an implicit acknowledgement that the FOMC saw some economic hardship ahead. The DXY was the outlier because it zoomed higher because of the FOMC projections for future rate cuts but more importantly because it was still the highest rate in the G7 other than the UK.
The USD 10Y T-bill and USD 10Y yield tell a different story. The decrease and breakdown in the yield shows less confidence in the economy moving forward.
* Investopedia.com has good information about the inverse relationship between the the cost of a bond and the yield, for anyone who wants to brush up on that topic.
In my opinion, DJT+1 and his/their tariff threats and chaotic administration decisions(think firing Federal employees safeguarding our nuclear arsenal, a threat to abolish the Dept. of Education etc. etc. etc.) are reflected in these charts. He is getting his wish by slightly devaluing the USD but ultimately his economic policies are going to lead to more economic pain for American consumers by increasing inflation. Canada and Mexico, our biggest trade partners have made it clear, they will retaliate with equal sized tariffs. Load up on the guacamole while you can. :)) I do not foresee the FOMC raising rates but they will also not be cutting either if and when inflation raises it's ugly head again.
We all know DJT's casual relationship with facts and his penchant to brag about his exceptional "Common Sense" that also explained the tragic death of 67 individuals in the recent Washington D.C. plane crash. Please form your own opinions on him also blaming it on DEI initiatives. I am staying out of that minefield and also do not have enough time or space to deal with any broken individual's misogyny and racial hatred. Bottom line, the USA does not have a leader who can instill confidence in our future or the International order and marketplace. He is aided by his +1, Musk, who somehow believe that the Silicon Valley mantra of "move fast and break things" will work in Government and in the international arena.
I do no think so. These two bulls in the china shop will turn around sooner than later and deny that they are responsible for the International and Domestic wreckage, chaos and damage that they have caused.
Only time will tell, though. I put my money on the mid terms. And once again, I am a registered Independent voter in this beautiful land of the USA, which despite all the problems and issues, is still one of the best places in the world to live.
Thanks for reading and feel free to share your opinion either way.

US 10Y TREASURY: safe-haven for uncertain growthThe US 10Y Treasury yield fell sharply during the previous week, in line with a drop on US equity markets. At the same time, the price of gold headed toward a new all time highest level, marking its sixth consecutive gaining week. Uncertainty is a word which has dominated financial markets since the establishment of the new US Administration. Spooky words like tariffs, inflation, and questionable economic growth are currently dominating investors' sentiment, in which sense, some further funds reallocations are quite possible in the coming period. After new stories regarding tariffs, and Michigan Consumer Sentiment, which showed the highest inflation expectations for the period of next five years, investors were seeking safe-haven assets, like Treasury bonds and gold, in order to sustain the value of their money.
The 10Y Treasury yields dropped during the week from the level of 4,56% down to 4,43%, where they are closing the week. For the week ahead, there is a possibility for a short term reversal to the upside, however, Friday brings new US PCE data, which is Fed's favourite inflation gauge. Depending on the data, some higher volatility is possible again.
