Government bonds
US05Y Bond LongUS05Y Bond is now Net-Long on the Regression Break.
I am considering a Bond Trade with the markets under pressure.
US10Y Bond Long US10Y bond is now net-Long on the Regression Break.
Pressure is building in the USA Indexs and pushing arcoss to the bond markets.
I am considering this trade.

USD outlook: The DJT wrecking ball+1 is gaining momentumHello traders
First of all, best of luck for yet another challenging week ahead.
I usually keep my charts simple in appearance but in this case I toyed around with the canvas to illustrate the direction of these three USD instruments. It also gave me the opportunity to simmer down before I start writing my next Idea on EUR/USD.
The charts tell the story. The FOMC's 50 bps rate cut on September 18th 2024 caused considerable consternation in the markets. It was a turning point for all three USD instruments because it was an implicit acknowledgement that the FOMC saw some economic hardship ahead. The DXY was the outlier because it zoomed higher because of the FOMC projections for future rate cuts but more importantly because it was still the highest rate in the G7 other than the UK.
The USD 10Y T-bill and USD 10Y yield tell a different story. The decrease and breakdown in the yield shows less confidence in the economy moving forward.
* Investopedia.com has good information about the inverse relationship between the the cost of a bond and the yield, for anyone who wants to brush up on that topic.
In my opinion, DJT+1 and his/their tariff threats and chaotic administration decisions(think firing Federal employees safeguarding our nuclear arsenal, a threat to abolish the Dept. of Education etc. etc. etc.) are reflected in these charts. He is getting his wish by slightly devaluing the USD but ultimately his economic policies are going to lead to more economic pain for American consumers by increasing inflation. Canada and Mexico, our biggest trade partners have made it clear, they will retaliate with equal sized tariffs. Load up on the guacamole while you can. :)) I do not foresee the FOMC raising rates but they will also not be cutting either if and when inflation raises it's ugly head again.
We all know DJT's casual relationship with facts and his penchant to brag about his exceptional "Common Sense" that also explained the tragic death of 67 individuals in the recent Washington D.C. plane crash. Please form your own opinions on him also blaming it on DEI initiatives. I am staying out of that minefield and also do not have enough time or space to deal with any broken individual's misogyny and racial hatred. Bottom line, the USA does not have a leader who can instill confidence in our future or the International order and marketplace. He is aided by his +1, Musk, who somehow believe that the Silicon Valley mantra of "move fast and break things" will work in Government and in the international arena.
I do no think so. These two bulls in the china shop will turn around sooner than later and deny that they are responsible for the International and Domestic wreckage, chaos and damage that they have caused.
Only time will tell, though. I put my money on the mid terms. And once again, I am a registered Independent voter in this beautiful land of the USA, which despite all the problems and issues, is still one of the best places in the world to live.
Thanks for reading and feel free to share your opinion either way.

US 10Y TREASURY: safe-haven for uncertain growthThe US 10Y Treasury yield fell sharply during the previous week, in line with a drop on US equity markets. At the same time, the price of gold headed toward a new all time highest level, marking its sixth consecutive gaining week. Uncertainty is a word which has dominated financial markets since the establishment of the new US Administration. Spooky words like tariffs, inflation, and questionable economic growth are currently dominating investors' sentiment, in which sense, some further funds reallocations are quite possible in the coming period. After new stories regarding tariffs, and Michigan Consumer Sentiment, which showed the highest inflation expectations for the period of next five years, investors were seeking safe-haven assets, like Treasury bonds and gold, in order to sustain the value of their money.
The 10Y Treasury yields dropped during the week from the level of 4,56% down to 4,43%, where they are closing the week. For the week ahead, there is a possibility for a short term reversal to the upside, however, Friday brings new US PCE data, which is Fed's favourite inflation gauge. Depending on the data, some higher volatility is possible again.

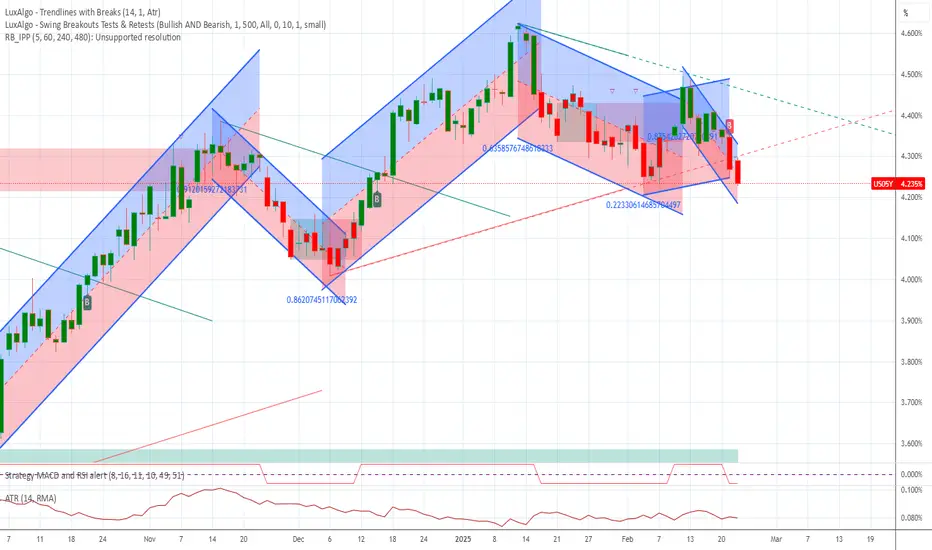
US05YThe US bonds are in a very strong sell , The've been a third bounces to the downside and also a break out trendline to the upside

US10Y This bond is long term pushing to the down side , we hit a major level on the monthly so we patiently waiting for a change of direction on the lower time frame and also if they would be any decision making from the US government

US10y expect correction to 4.0US10Y hit all tp and exepct some correction to near 4.0
arrow shows correction tp
based fib
based price action

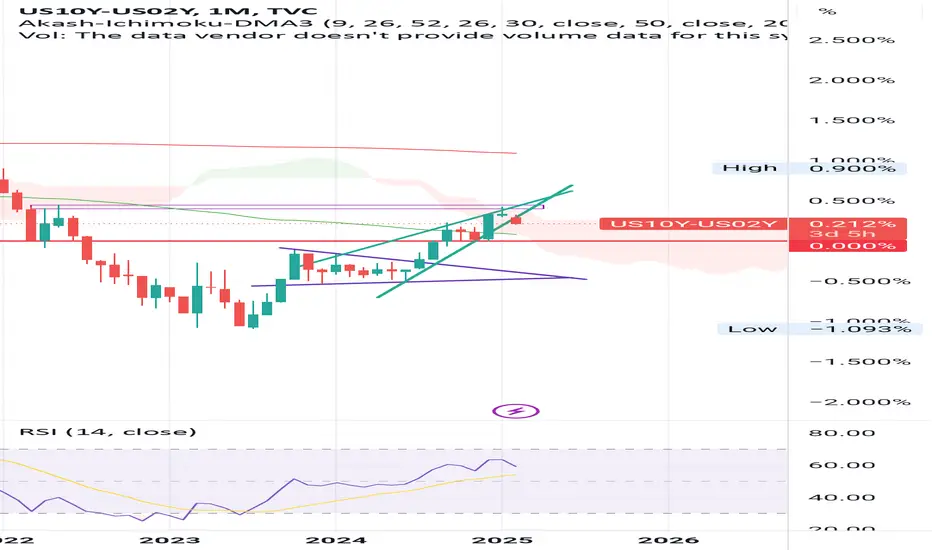
Long-Term Trend of the US 10-Year YieldThe US 10-Year yield trades very well on the 3-month timeframe. Extrapolating it further, I expect it to hit 3.0-3.5% sometime within the next 12-18 months.

U.S. FIRMS SWAP DOLLARS FOR EURO to lower funding costsU.S. FIRMS SWAP DOLLARS FOR EURO to lower funding costs—SMART MOVE?
(1/9)
Good afternoon, Tradingview! U.S. companies are flipping dollar debt into euros—slashing borrowing costs 📈🔥. Cross-currency swaps are the hot ticket amid rate gaps. Let’s break it down! 🚀
(2/9) – SWAP SURGE
• Trend: Dollar bonds morph into euros 💥
• Why: Eurozone rates lag U.S. by ~200 points 📊
• Volume: $266B in Jan ‘25 swaps, up 7% YoY
Lower rates, big savings—companies pounce!
(3/9) – THE TRIGGER
• Fed: Holds steady—U.S. rates stay high 🌍
• ECB: Eases up—eurozone softens 🚗
• Trump Tariffs: Stir inflation fears—volatility spikes 🌟
Dollar strength pushes firms to euro deals!
(4/9) – HOW IT WORKS
• Swap: Trade dollar debt for euro payments 📈
• Gain: Cheaper interest, currency hedge
• Impact: Millions saved, euro cash flows shine
It’s a financial jujitsu move—clever stuff! 🌍
(5/9) – RISKS IN PLAY
• Euro Flip: Stronger euro could zap savings ⚠️
• FX Losses: Hedging costs climb if dollar dips 🏛️
• Uncertainty: Fed vs. ECB—rate dance wobbles 📉
Smart bet, but not risk-free!
(6/9) – WHY NOW?
• Rate Gap: U.S. high, eurozone low—carry’s juicy 🌟
• Trump Effect: Tariffs fuel dollar power 🔍
• Global Ops: U.S. firms shield Europe earnings 🚦
Timing’s ripe—swaps are the shield!
(7/9) – MARKET VIBE
• Early ‘25: Swap restructures cash in 🌍
• Savings: redirected to debt, flexibility 📈
• Trend Watch: Grows if rate split holds
Companies adapt—financial acrobatics in action!
(8/9) – Dollar-to-euro swaps—what’s your take?
1️⃣ Bullish—Cost cuts win big.
2️⃣ Neutral—Works now, risks later.
3️⃣ Bearish—Euro rebound kills it.
Vote below! 🗳️👇
(9/9) – FINAL TAKEAWAY
U.S. firms swap dollars for euros—saving millions as rates diverge 🌍🪙. Tariffs and Fed fuel the play, but euro risks lurk. Genius or gamble?

US 10Y TREASURY: lower on retail salesThe inflation in the US picked up above market expectations in January, however, the retail sales figures defined the market sentiment. As it has been posted, the retail sales in January suddenly dropped by -0,9%, which was much higher from the market estimate. Despite the higher inflation figures, the decrease in the retail sales provides some indication that the inflation will not significantly pick up in the coming period. This was the main indication for market participants, which brought the 10Y US treasuries down from the level of 4,65% down to 4,45% on Friday trading season. Still, yields ended the week at the level of 4,47%.
Regardless of inflation figures, at this moment trade tariffs of the US Administration represent an unknown factor for market participants. As markets are not happy with uncertainty, any news of tariffs in the coming period might trigger higher market volatility. As per current sentiment, yields have space for further easing, at least till the 4,2% level. However, fundamentals still represent the unknown factor which could temporarily revert yields to the higher grounds.

The Most Effective way to fight Tariffs, is to Sell BondsIn an era when protectionist tariffs have become a go-to tool for DUNCE Political leaders such as President Voldemort, it is time for investors, institutions and nation states to take a stand—and not through traditional protest, but by wielding the formidable power of financial markets. Tariffs, by raising costs and distorting trade, can sap economic growth. Yet, as history and recent trade wars have shown, the real battleground is not just at the border but in the bond markets. The BIG FRAUD of created by American's "Buy, Borrow, Die" mental illness is already at a point where it could burst any moment and the best needle to poke this bubble is the 2 Year Bonds. If these bonds default, a recession will likely happen and it is unlikely a republican majority will be elected in the house and senate during the mid-term cycle.
Therefore, the most aggressive and effective countermeasure is to sell off short-dated (2‑year) bonds in favor of longer‑dated (5‑ and 10‑year) bonds, and to liquidate any and all U.S. bonds held by companies in politically “red” states. This would mean the debt they hold is being sold for pennies on the dollar, like Twitters loan already is...
Tariffs and Trade Wars: Lessons from Recent History
The recent imposition of tariffs by the Trump administration on imports from Mexico, Canada, and China has sparked a new wave of economic disruption. These tariffs—intended to protect domestic industries—have instead triggered retaliatory measures and rattled global markets. As reported by Reuters, the trade war initiated by these tariffs has not only led to rising costs for consumers but also to significant volatility in financial markets. Such aggressive trade policies reveal an underlying fiscal vulnerability that can be exploited through strategic bond trading.
REUTERS.COM
Historically, trade wars have often served as the catalyst for broader financial instability. When tariffs escalate, investors flock to safe-haven assets, yet the resulting market dynamics also open up opportunities for those who know where to look. Now is the moment to pivot—and the bond market is the perfect arena for this counteroffensive.
Historical Defaults: A Wake-Up Call
Contrary to the oft-repeated claim that “the U.S. has always paid its bills on time,” history tells a different story. There have been several notable instances—ranging from the demand note default during the Civil War to the overt default on gold bonds in 1933 and technical defaults such as the 1979 payment delays—that remind us of the inherent risks in our national fiscal practices. These episodes highlight that U.S. bonds, despite their reputation for safety, are not immune to default under fiscal duress.
THEHILL.COM
This historical perspective should not only unsettle complacent investors but also embolden them to leverage the bond market as a tool of economic resistance. By strategically repositioning bond portfolios, investors can exacerbate fiscal pressures on policymakers who rely on the illusion of unfailing debt service.
The Yield Curve: An Opportunity for Tactical Rebalancing
The current structure of the U.S. Treasury yield curve presents an unprecedented opportunity. Short‑term bonds—especially the ubiquitous 2‑year Treasuries—are trading at levels that no longer justify their risk, given the market’s expectation of a steepening curve as longer‑term yields are poised to rise. By aggressively selling off 2‑year bonds and using the proceeds to acquire 5‑ and 10‑year bonds, investors can capture the benefits of a steepening yield curve. This strategy not only enhances returns but also sends a powerful signal: the market is rejecting the financial underpinnings that allow tariffs to be financed cheaply.
This repositioning weakens the liquidity available for financing government policies that sustain tariffs, thereby indirectly undermining the protectionist agenda. As bond market dynamics come into sharper focus amid rising inflation fears and fiscal deficits, this tactical shift represents a proactive measure to tilt the scales back in favor of free trade.
REUTERS.COM
Targeting “Red State” Bonds: A Political and Financial Imperative
It is no secret that companies based in states with predominantly conservative (or “red”) leadership have often been the political bedfellows of tariff advocates. These companies not only benefit from protectionist rhetoric but also tend to issue bonds under fiscal conditions that make them particularly vulnerable when market sentiment shifts. Moreover, they also tend to be overvalued anyway so the likelihood of panic selling is more likely. The time has come to liquidate any and all U.S. bonds issued by red state companies. By divesting from these securities, investors can both shield themselves from potential losses and apply market discipline on a sector that has, for too long, been insulated from the harsh realities of global trade dynamics.
This aggressive divestiture sends a dual message: a rejection of protectionist policies and a call for a more balanced, market-oriented approach to national fiscal management. It is a bold stance that forces a rethinking of the relationship between politics and finance—a reminder that no company should be immune to the corrective forces of the market.
Conclusion
Tariffs are not just trade policy—they are fiscal weapons that rely on the ability to finance cheap debt. History has shown that even the most stalwart bond markets are susceptible to default under pressure, and recent trade wars have only amplified these vulnerabilities. The solution is clear and decisive: sell off 2‑year bonds and reinvest in 5‑ and 10‑year bonds, while liquidating U.S. bonds held by red state companies. This aggressive financial maneuver not only promises better returns in a steepening yield curve environment but also serves as an effective counterattack against protectionist tariffs.
By rebalancing portfolios in this manner, investors take an active role in challenging policies that restrict free trade and hinder economic growth. In the world of modern finance, sometimes the best way to fight back is to let your portfolio do the talking.
Disclaimer: This article reflects a strongly opinionated perspective and is intended for informational purposes only. It does not constitute financial advice. Investors should conduct their own research and consult with a professional advisor before making any investment decisions.

Critical 4.50% level being tested ahead of Trump speech and FOMCThe US10-year yield closed the week marginally higher at 4.48% after a busy week of events which saw the DXY stumble by 1.2% despite US CPI rising for the 4th consecutive month coupled with a rather hawkish yet upbeat testimony before congress from Fed chair Powell, which in my opinion was all dollar positive. US CPI for the month of January came in hotter than expected at 3.0% yoy, up from 2.9% in December. Additionally, on top of Powell’s comments regarding the strength of the US economy, the ISM Manufacturing PMI completely shattered expectations after coming in stronger than expected at 50.9 for the month of January.
The US10-year yield is currently testing the 50-day MA level of 4.52% as well as the blue support range between 4.45% and 4.50%. A break below 4.40% will however force me to invalidate my series of ideas on the US10-year yield calling for a move higher towards 5.00%. A break below 4.40% will allow bond bulls to pull the yield lower onto the 61.8% Fibo retracement at 4.30% and the 200-day MA at 3.69%.

US10Y - Perfect Discount Delivery!Let’s take a deep dive into Yields and have a look at how price delivered throughout last week.
The week prior, I posted that we will be seeing discount prices; 4.468% equilibrium draw in the near future and we absolutely smashed that price region.

Ready for 6.5% on the 10Y T-Bill?It’s been a while since I’ve posted an Idea, however since the market may be at a pivotal point I thought I’d do a quick analysis on the $US10Y. Using elliott wave and fibonacci ratios as my base logic, I predict that we could see a 6.5% or higher 10 year T-bill in the near future.
The fib extension above is based off 1.00 of Primary waves 0-3. I’m counting that we are in the early stages of the 5th and final wave, which is commonly 61.8% of waves 0-3 in length.
My wave count is supported by the DMI indicator and the 50sma (Blue) & 100sma (yellow). The yield is still above the moving averages, signaling a continuation to the upside. Primary wave 4 was a zig zag (A-B-C) pattern in a slightly descending channel, which has a tendency to break to the upside. With inflation proving stubborn and a looming trade war providing a backdrop that is concerning to investors, it is time we get back into the mindset that the inflation battle isn’t quite over yet. Yields are rising across the world and the US is no exception.

US10Y Bond Short on Regression BreakUS10Y is now net-short on regression break.
I am considering this pair, along with the 02Y and 05Y bonds.
Looking at EA that best suit the situation

US05Y Bond Short on Regression BreakUS05Y is now net-short on regression break.
I will consider this pair as price action develops and decide which EA is suitable.

U.S. 10-Year Yield (US10Y): Traders Watch Key LevelsThe U.S. 10-Year Treasury Yield (US10Y) is one of the most important indicators in the financial world, influencing everything from mortgage rates to stock market trends. It reflects investor confidence in the economy, rising when expectations for growth and inflation increase and falling when investors seek safer assets. The yield is closely watched by traders, economists, and policymakers as a key gauge of market sentiment.
The chart recently showed a confirmation bar, moving into the momentum zone, which happens when the price rises above the 0.236 Fibonacci level. This signals a potential continuation in trend direction and increased interest from investors around inflation.

EUR/USD short: End of the rebound higherHello traders
My TP at 1.0370 was executed on my long EUR/USD position.
I have initiated a short EUR/USD position after Chair Powell's testimony this morning.
He expressed confidence in the economy staying robust and that there is no rush to cut interest rates.
The chart is my guiding light on a daily basis to determine which direction risk is heading.
EUR/USD is heading down again after testing the daily breakdown at 1.0382. USD CPI tomorrow MAY reverse the tide again, so keep a close eye on all these asset classes.
www.tradingview.com
Best of luck all.

Results Of QE TighteningWhat you're seeing in this chart is the 10 year. A great one to watch to see what the market is thinking. The 10 year is showing the results of QE tightening and Trumps willingness to curb the debt problem. What Trump is doing is healthy, this market needs it. To the moon does not last forever. It is looking like a twist coming in the MACD but looking previously it would have been considered a fake out. Unless Trump comes in and saves this market tomorrow could be a bloodbath. This scenario is on borrowed time regardless. We are literally bleeding dollar bills out of our ears. BRICS abandoned the dollar as we know, although tradable. During the Great Depression JP Morgan bailed out the market. People said he saved people but the people that were wiped were already gone, he saw the bottom coming in which just made JP Morgan the wealthiest company in history. Fast forward to now, nobody is bailing $37 trillion. This an end game, again, unless Trump or The Fed steps in.


US 10Y Yields - Perfect Discount Delivery!Let’s take a deep dive into Yields and have a look at how price delivered throughout last week.
The week prior, I posted that we will be seeing discount prices; 4.468% equilibrium draw in the near future and we absolutely smashed that price region.

US 10Y TREASURY: higher on inflation expectationsThe major data release during the previous week was the US jobs report. The on-farm payrolls were lower from market expectations, at the level of 143K, however, this was not a concern of the market. The major indicator which moved the US Treasury yields to the higher grounds was a drop in unemployment combined with an increase in hourly earnings of 0,5% and higher from markets initial estimate. The increase in wages implies higher consumption and in the last instance, higher inflation. In addition, the Michigan inflation expectations rose to the level of 4,1%, indicating that US consumer sentiment stands on expectation of a higher inflation during this year. This was a signal to markets that the Fed will potentially hold interest rates at current levels for a longer period of time.
The 10Y US benchmark rose on Friday to the level of 4,51%, but ended the week at 4,49%. Investors will certainly use the week ahead to digest the latest jobs data in the US. In this sense, some smaller correction in yields might be possible. Still, the US trade tariffs continue to be a concern of investors, in which sense, any negative news related to imposed tariffs might swiftly push the yields again to the higher grounds.
