Bitcoin - Downtrend will continue to 109,000! Alt-season OctoberBitcoin and altcoins have been crashing in the past 2 weeks! Is there any hope for a bull market, or has the bullish cycle ended? In this analysis I will tell you my personal opinion, and if you haven't seen my previous very successful analysis on Bitcoin, you can do it right now! Because it's highl
Crypto market

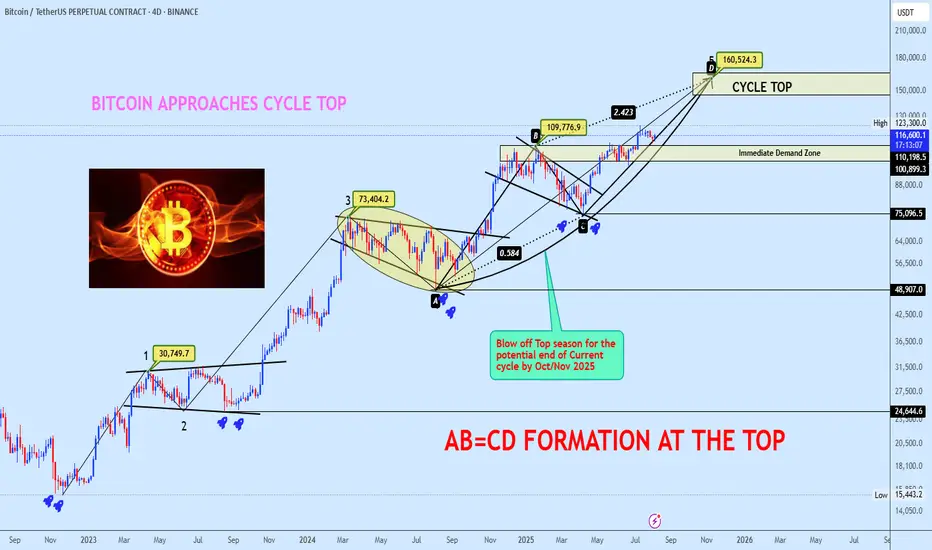
Bitcoin Approaches Cycle Top with AB=CD Completion in SightBTCUSDT continues its bullish macro structure, now advancing towards the projected cycle top zone at $160,524, completing a textbook AB=CD harmonic formation. The BC leg retraced precisely 0.584 of AB, aligning with a 2.423 CD extension, confirming a strong harmonic symmetry.
Price is currently tra
ADAUSDT - buy it before it's too late!If you’re looking for safe trading with solid guaranteed profits, then your main focus should be on major coins — and when we talk major coins, ADA should definitely be on your radar.
ADA just completed a Falling Wedge breakout on the 3-day timeframe, followed by a successful retest.
It also broke

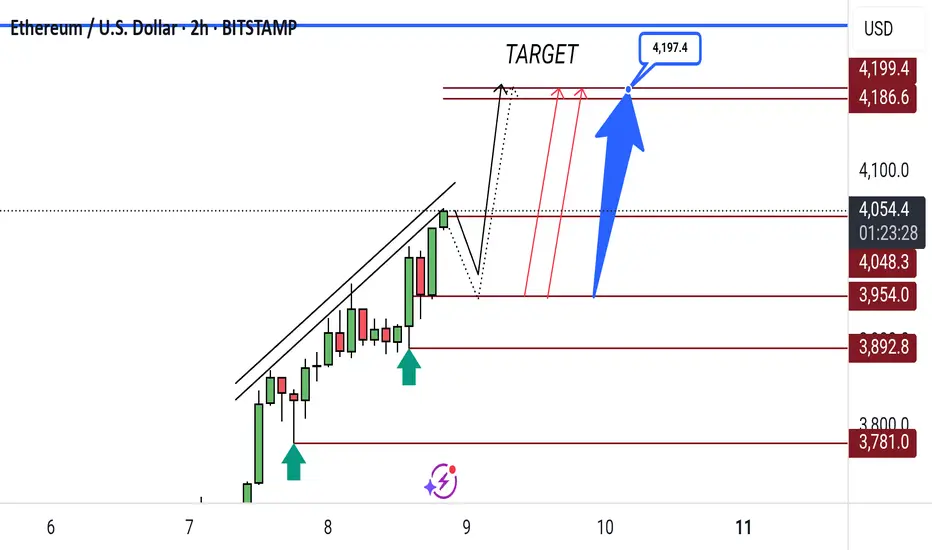
ETH/USD Bullish Breakout Targets 4,197Ethereum (ETH/USD) is showing bullish momentum on the 2H chart, with price targeting the 4,197 level after breaking above the channel. Key supports are at 4,048 and 3,954.
DOGEUSDT to the moon(1$ is not Far)Wow such a good chart we have here the channel breakout and also retest of breakout is completed and i am thinking about easy path non stop pump here to the moon for CRYPTOCAP:DOGE holders now.
price test 0.61 Fibonacci support level and the market here was healthy and all leverage players are mo

Doge...Is a 50% Pump Coming?Hello guys!
Trend Structure:
The price is moving within a broad ascending channel, with both upper and lower boundaries acting as dynamic resistance and support. The midline (dotted blue) appears to function as a short-term pivot zone.
Recent Movement:
After a mid-July decline from around $0.2

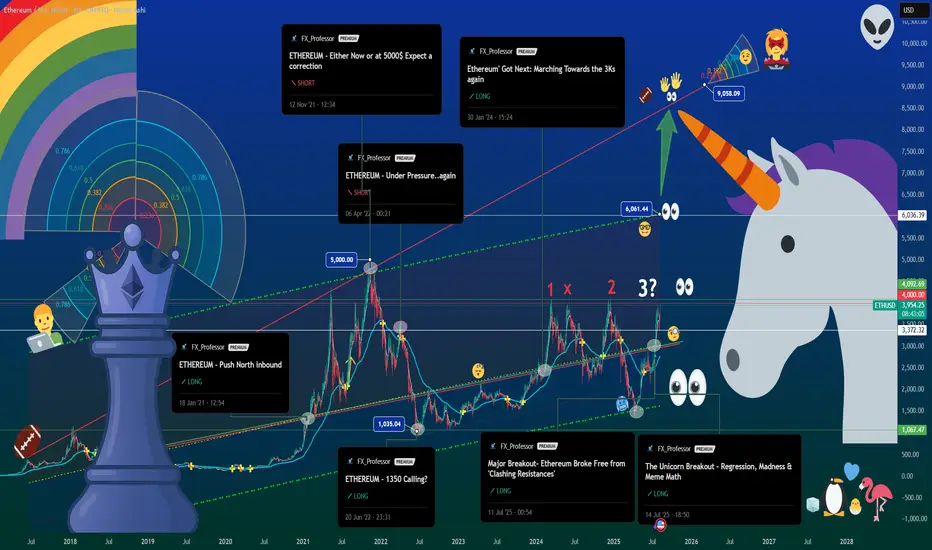
The Unicorn Breakout Part II – Ethereum at $4K, Queen of Crypto🦄👑 The Unicorn Breakout Part II – Ethereum at $4K, Queen of Crypto 📈♟
I’ve had a lot of conversations these past months.
Some friends told me ETH had no power, no influence.
One even called it the “bitch coin.”
Others insisted it lacked dynamics, that it was doomed to trail behind Bitcoin forever
BITCOIN Bounced on its 1D MA50. Bull Flag breaking soon?Bitcoin (BTCUSD) made a beautiful technical rebound on its 1D MA50 (blue trend-line), testing and holding it on 3 separate 1D candles. This has caused a short-term rebound so far, taking the price to the top of the Channel Down.
As we mentioned on previous analysis, if BTC breaks above that Channel

BTC 1d forecastBTC WILL GO DOWN from 11-20 of August till the end of Aug (25 +/-1day)
From there we are PUMPING till beg of Nov, from there DUMP till mid Dec and one last PUMP til mid JAN beg FEB!
Than - THE END!!!! FINISH! Sayanara

BTC - Short Trade / Crash Update and DetailsPer my previous post here are the details on my personal trade. Note this is NOT financial advice, and this is my own personal trading plan only. Please use your own judgement.
Entry - 116,300 to 116,600
Stop Loss - 121,800
Target 1 - 95,700
Target 2 - 61,500
Target 3 - 35,000
Target 4 - 8,000

See all popular ideas
Community trends
Crypto collections
All coinsTotal value locked rankDeFi coinsGainersLosersLarge-capSmall-capMost tradedMost addresses with balanceMost daily active addressesMost transactionsHighest transaction volumeLowest supplyHighest supplyMost expensiveMost volatileDevelopment activityAll-time highAll-time low52-week high52-week lowSee all