BTC - Short Setup at 0.702 Fibonacci & Fair Value GapMarket Context
Bitcoin recently rejected from a major resistance area and has since been retracing downward, finding temporary support inside a bullish Fair Value Gap. The market is currently in a corrective phase, with buyers attempting to defend lower levels while sellers look for optimal positions to reload shorts. This environment shows a classic tug-of-war between these two forces as price moves between supply and demand zones.
Consolidation and Current Phase
Although the prior consolidation has been broken, the current price action can still be described as corrective, with intraday structure forming lower highs. The bullish Fair Value Gap beneath price has been respected so far, creating a temporary base. However, the path remains complex, as the market has unfilled imbalances both above and below.
Bearish Retest Scenario
One key scenario involves a retracement toward the bearish Fair Value Gap near 117K, which also aligns with the 0.702 Fibonacci retracement level. This confluence makes it a high-probability area for sellers to step in again. A rejection from that zone would likely resume the downtrend, with the next logical target being the deeper unfilled bullish Fair Value Gap around 110K. This zone acts as a magnet for price due to the inefficiency left behind during the last rally.
Bullish Defense Scenario
For bulls to regain control, the current Fair Value Gap at 114K must hold, followed by a strong move that invalidates the lower-high structure. Such a move would need to break above the 117K bearish FVG with conviction. Only then could momentum shift back to the upside, opening the door for another challenge of the higher resistance zones.
Final Words
Patience and precision are key when dealing with setups like this. Let the market come to your level — and react with intent.
If you found this breakdown helpful, a like is much appreciated! Let me know in the comments what you think or if you’re watching the same zones.
Crypto market

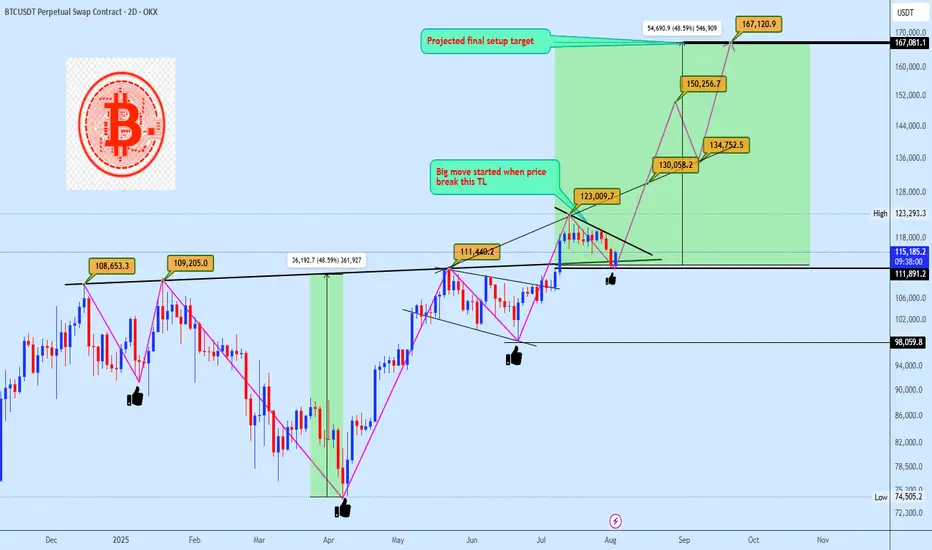
Bitcoin Preparing for Explosive Breakout Toward $167KBitcoin is currently respecting a clean trendline resistance following a bullish pennant formation. Price is holding firmly above the neckline breakout from the inverse head and shoulders (ISHS), confirming demand strength around the $111K–$113K region. The structure implies another 48% rally projection, mirroring the previous measured move, which points toward a potential target at $167K.
A breakout above the immediate diagonal resistance would likely trigger an impulsive continuation, replicating earlier moves from similar setups as annotated. Bias remains bullish while price holds above the neckline pivot.
Technical Confluence
Pattern Structure: Bullish Pennant + Retest of ISHS neckline
Market Geometry: Symmetrical move projection based on previous breakout leg
Momentum Flow: Higher lows forming against compressing resistance
Volume Expectation: Volatility expansion likely on breakout confirmation
Key Trendline: "Big move started when price break this TL"
Key Price Levels
• Support Zone: $111,800 – $113,000
• Confirmation Zone: Above $123,000
• Primary Target: 🎯 $167,000
• Invalidation Level: ❌ Below $105,000
Execution Plan
• Entry: Watch for bullish pennant breakout and retest of diagonal TL
• Trigger Method: Limit buy post-breakout or confirmation on volume surge
• SL: Just below $105K zone
📥 Let us know your thoughts in the comment section, and feel free to tag your preferred altcoins for analysis.
Attention: Our August Altcoin requests will be managed through this post. Kindly submit your preferred altcoins in the comment section below.
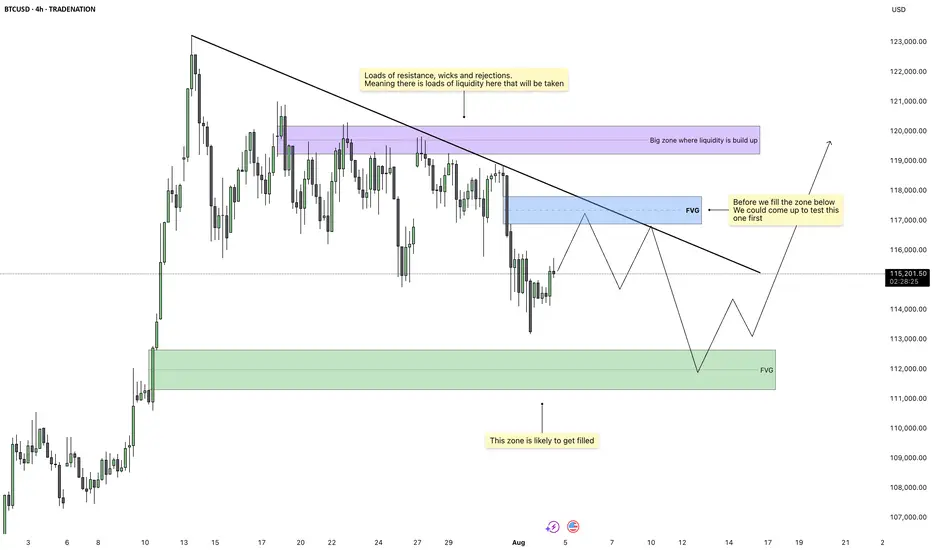
Bitcoin - Imbalance Fill Before Liquidity ExpansionBitcoin is trading inside a compressing structure beneath a clean descending trendline. Price action has been choppy but controlled, creating multiple zones of inefficiency that remain unfilled. We’re currently positioned between two major Fair Value Gaps, one above and one below, which gives us a clear roadmap. The broader market context suggests accumulation beneath key resistance, and the chart structure points toward a two-legged play before any breakout.
First Target: Upper Imbalance and Liquidity Trap
The first objective for price is to reach into the Fair Value Gap sitting just above current levels. This zone overlaps with the trendline and is backed by several wicks and failed breakouts, which likely means liquidity is built up there. Price may push through this area to trigger stop losses and induce breakout buying, only to reverse shortly after. The imbalance makes it an attractive magnet for price and a likely turning point once filled.
Retracement Move: Clean-Up Below
After sweeping the highs and filling the upper imbalance, price is expected to rotate back down. The area below holds an untouched Fair Value Gap from a previous bullish impulse, now acting as a demand zone. Once the upper inefficiency is filled, the market should drop into this zone to rebalance. This move will also help clear internal liquidity from the structure formed during the short-term rise.
Trendline, Inducement, and Execution Layers
The descending trendline plays a critical role here. With many traders watching it for a breakout or rejection, it acts as inducement. A false break or a touch just above the trendline may trigger entries in the wrong direction. The optimal move would be for price to react from the upper imbalance, reject at or just above the trendline, then fall into the lower zone, where we look for confirmation of reversal or continuation.
Final Expansion: Breakout After Cleanup
Once both Fair Value Gaps are filled and internal liquidity is cleared, Bitcoin will be in a clean position to rally. The area above the prior wicks and rejections is likely to hold significant liquidity, and the final move would aim to sweep that. This would complete the full cycle of imbalance fill, liquidity grab, and directional expansion. Price is unlikely to sustain a move higher until both zones have been addressed.
Conclusion
This setup focuses on efficient price delivery between key imbalances. Expect a short-term push up into the upper FVG and liquidity cluster, followed by a clean rejection into the lower demand zone. Once both sides are filled, Bitcoin should be ready for a real move higher, targeting liquidity above the current range. Let the market complete the cycle before looking for continuation.
Disclosure: I am part of Trade Nation's Influencer program and receive a monthly fee for using their TradingView charts in my analysis.
___________________________________
Thanks for your support!
If you found this idea helpful or learned something new, drop a like 👍 and leave a comment, I’d love to hear your thoughts! 🚀
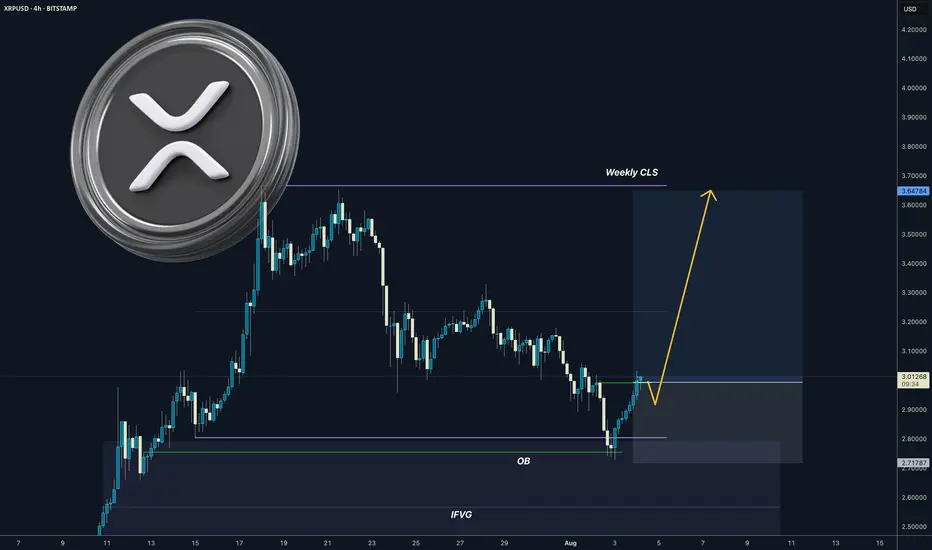
XRP I Weekly CLS I Model 1 I OB confirmations - Highs in playYo Market Warriors ⚔️
Fresh Crypto Analysis— if you’ve been riding with me, you already know:
🎯My system is 100% mechanical. No emotions. No trend lines. No subjective guessing. Working all timeframes. Just precision, structure, and sniper entries.
🧠 What’s CLS?
It’s the real smart money. The invisible hand behind $7T/day — banks, algos, central players.
📍Model 1:
HTF bias based on the daily and weekly candles closes,
Wait for CLS candle to be created and manipulated. Switch to correct LTF and spot CIOD. Enter and target 50% of the CLS candle.
For high probability include Dealing Ranges, Weekly Profiles and CLS Timing.
“Adapt what is useful. Reject whats useless and add whats is specifically yours.”
David Perk aka Dave FX Hunter
💬 Comment any Coin I ll give you my quick view
Adding to our first bitcoin sell position now We are adding to our first sell position on bitcoin because we are to see more sell off from here

Bitcoin: 113K Support Bounce Buy Signal.Bitcoin has retraced thanks mostly to "unexpected" revisions to labor market statistics. While this move has many making outrageous forecasts, price has simply retraced to the 113K support levels and has generated a swing trade long signal (break of 114K). IF the momentum stays intact, it is within reason to anticipate a test of the low 120K's while a more aggressive expectations would be a break out into the 130K's. Keep in mind if 123K is broken, even by a small amount, that would confirm the current movement as the wave 5 of 5 which means it becomes the most vulnerable to a broader correction.
This NFP report and BLS situation is the perfect example of a catalyst that NO ONE in the financial "expert" space saw coming. Even Chairman Powell on Wednesday was pointing out how stable employment growth has been and emphasized the importance of this statistic for their rate decisions. Which means the Federal Reserve is making decisions based on totally inaccurate data. Which also means the entire market has been priced completely wrong for months. My point is, "official" information that you may be basing your investments on can be totally inaccurate and can be revealed out of nowhere. This risk alone puts every investor at the mercy of the market and why it is so important to recognize the limitations of ANY market information through the lens of RISK management.
I have been writing about a potential bullish range breakout beyond 120K for a test of the 130s OR if the range support breaks instead, to watch for a test of the key support at 113K. There is NO way to know which way the market will choose in advance, it all depends on the outcomes of specific events which act as catalysts for one scenario or the other.
This is why being knowledgeable about wave counts and other forecasting techniques can be very helpful in terms of gauging risk and potential. And based on this, AS LONG AS the 108K area is NOT overlapped, the current price structure is still within the boundaries of a bullish sub wave 4. This is why I am still short term bullish on Bitcoin and why I believe the current buy signal has potential to test at least the low 120's in the coming weeks. IF the 108K area is broken instead, that reduce the chances of a short term bullish break out, and may be the proof that the broader Wave 5 structure is complete.
The risk at this point can be measure from the 112K low area and nearest profit objective 118K which offers an attractive reward/risk. Measure everything from RISK first, and always be prepared to be wrong. If the market pays, consider it a gift.
Thank you for considering my analysis and perspective.

The next bull week gonna start soonWe had new ATH around 123K$ and market is now facing some correction and fall and i think soon we can expect end of this correction and also more gain this time will lead price to new ATH at least around 137K$.
it seems that red trendline is not broken yet and for confirmation of breakout we need price at least stay above 116K$ and close daily candle above there.
DISCLAIMER: ((trade based on your own decision))
<<press like👍 if you enjoy💚

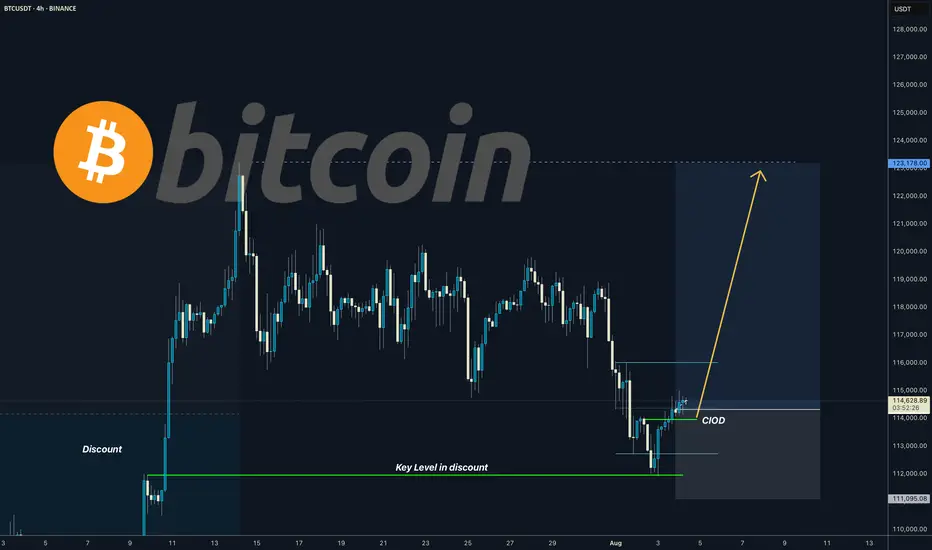
BITCOIN I Daily CLS I KL OB in the discount - ATH comingYo Market Warriors ⚔️
Fresh outlook drop — if you’ve been riding with me, you already know:
🎯My system is 100% mechanical. No emotions. No trend lines. No subjective guessing. Just precision, structure, and sniper entries.
🧠 What’s CLS?
It’s the real smart money. The invisible hand behind $7T/day — banks, algos, central players.
📍Model 1:
HTF bias based on the daily and weekly candles closes,
Wait for CLS candle to be created and manipulated. Switch to correct LTF and spot CIOD. Enter and target 50% of the CLS candle.
For high probability include Dealing Ranges, Weekly Profiles and CLS Timing.
“Adapt what is useful. Reject whats useless and add whats is specifically yours.”
David Perk aka Dave FX Hunter
💬 Don't hesitate to ask any questions or share your opinions
Bitcoin Hits $40,000, It Will Recover —Name Your AltcoinSorry, there is a typo there on the title, I meant to say: Bitcoin hits $114,000, soon to recover.
As you can see from our trading range, Bitcoin just went beyond the lower boundary and hit a new low, the lowest since 10-July but there is good news. There isn't room for prices to move much lower, this is part of the consolidation phase.
The first low happened 25-July and notice the high (bear) volume. The second low happens today and we have lower volume compared to 25-July, but Bitcoin hit a lower low. This reveals that the bearish move is already weak and losing force. It also reveals the fact that Bitcoin is about to recover.
Also notice the RSI, 2H. It hit oversold recently and went the lowest in a long while. Reversals tend to happen when the RSI becomes oversold.
Bitcoin is testing the lower boundary of the trading range, when this happens, the action reverses and moves back up. Prepare to see Bitcoin back above $120,000. It is normal and it will happen... But it is wise to give the market a few days. 5-August was bad last year. It gets bad but it also marks the bottom. Once the bottom is hit, growth long-term.
— Name Your Altcoin
Leave a comment with the altcoins you are holding now and I will do an analysis for you. The altcoins will also recover and we are witnessing just a small retrace. Hold strong as this is the most important part. We will have a very strong new bullish wave develop within days.
As Bitcoin moves to test support, it will reverse to test resistance next. Which one is your top altcoins choice?
Thank you for reading.
Namaste.

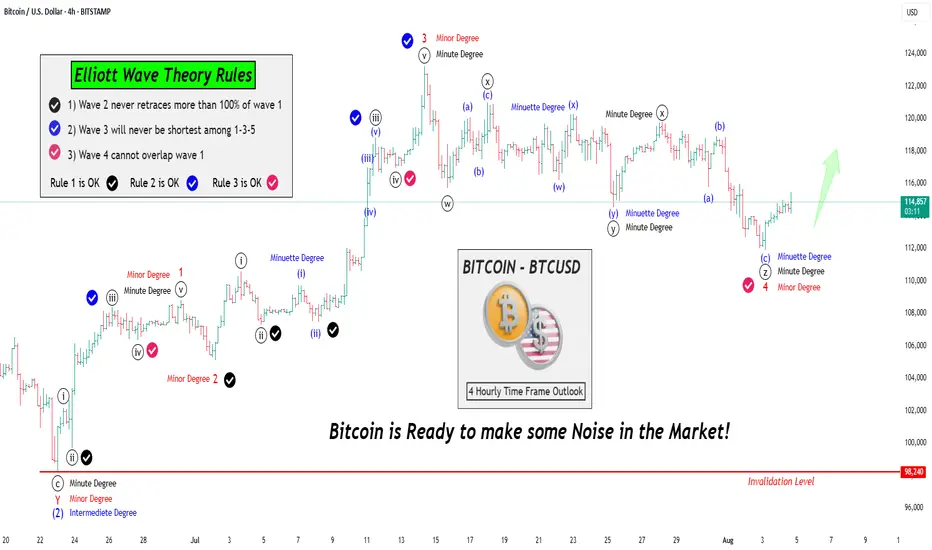
Let's learn & Apply Elliott Wave Rules on chart: BTCUSD BitcoinHello Friends,
Welcome to RK_Chaarts,
Friends, Today we are going to learn 3 Rules of the Elliott Wave theory, there are three principles and some patterns. Impulses move in a 1-2-3-4-5 pattern, either as an impulse or a motive wave. However, within impulses, there are three rules:
Rule No 1:
Wave 2 will never retrace more than 100% of Wave 1.
Rule No 2:
Wave 3 will never be the shortest among Waves 1, 3, and 5; it can be the largest, but never the smallest.
Rule No 3:
Wave 4 cannot overlap Wave 1, except in diagonals or triangles; in impulses, it cannot overlap.
We've checked these three rules and marked them with separate tick marks on the chart with different colors, making them clearly visible. You can review the chart and verify these rules yourself, learning how wave principles are applied and checked.
We've explained all this through a drawing on the chart, so we won't elaborate further here. Moving forward, let's analyze what the wave theory suggests about the current market trend. This entire analysis is shared for Educational purposes only.
I hope you'll consider this educational post as a learning resource, Definitely, I encourage you to review the chart as an image or picture to better understand the concepts we've worked hard to explain.
Our effort will be successful if you gain a deeper understanding and learn something new from this post. If you find this helpful and informative, our hard work will have paid off. Please keep this in mind as you review the material.
Now let's explore how wave counts within wave counts, or lower degrees within higher degrees, unfold through complete wave theory patterns and following theory Rules all the times.
Let's take a closer look at the Bitcoin chart we've analyzed using Elliott Waves. From this perspective, it's clear that the Intermediate Degree Wave (2) concluded around June 23rd.
After this, we observe that the internal wave counts of the lower degree, specifically Wave 1-2-3 (in red) have completed their cycle of Minor degree. Furthermore, Red Wave 4 of same Minor degree has been moving sideways, characterized by a downward trend.
Notably, the fall of Red Wave 4 is classified as a Minor Degree movement. Interestingly, this downward movement appears to have terminated in an even lower degree, namely the Minute Degree, which we've marked in black as ((w))-((x))-((y))-((xx))-((z)) that means Wave 4 of Minor degree (in Red) is complete.
Given that Red Wave 4 Minor has reached its conclusion, it's highly plausible that Wave 5 has initiated. This development suggests that Bitcoin is poised to make a significant move.
Moving on to the analysis, we observe that:
- Rule 1: Wave 2 has not retraced more than 100% of Wave 1, so this rule is intact.
- Rule 2: Wave 3 is not the shortest among Waves 1, 3, and 5, so this rule is also valid.
- Rule 3: Wave 4 does not overlap Wave 1, so this rule is also satisfied.
Bitcoin is all set to shake things up! We eagerly anticipate further rallies in the market.
This post is shared purely for educational purpose & it’s Not a trading advice.
I am not Sebi registered analyst.
My studies are for educational purpose only.
Please Consult your financial advisor before trading or investing.
I am not responsible for any kinds of your profits and your losses.
Most investors treat trading as a hobby because they have a full-time job doing something else.
However, If you treat trading like a business, it will pay you like a business.
If you treat like a hobby, hobbies don't pay, they cost you...!
Hope this post is helpful to community
Thanks
RK💕
Disclaimer and Risk Warning.
The analysis and discussion provided on in.tradingview.com is intended for educational purposes only and should not be relied upon for trading decisions. RK_Chaarts is not an investment adviser and the information provided here should not be taken as professional investment advice. Before buying or selling any investments, securities, or precious metals, it is recommended that you conduct your own due diligence. RK_Chaarts does not share in your profits and will not take responsibility for any losses you may incur. So Please Consult your financial advisor before trading or investing.
BITCOIN PREDICTION: THIS Breaks - and BTC WILL CRASH TO HERE!!!!Yello Paradisers! I’m sharing my Bitcoin prediction with you. We’re using technical analysis on TradingView, specifically Elliott Wave theory.
On the ultra-high time frame, we noticed a Shooting star candlestick pattern. We’re analyzing the channel where the zigzag formation is occurring.
We’re also looking at bearish divergence on the ultra-high time frame chart and the zigzag on the high time frame chart. There’s a bullish divergence visible there. The Fibonacci level at $108,000 is also noteworthy, as is the volume, which shows that bears are still in control on the medium timeframe. We’re also analyzing the head and shoulders target plus bearish divergence on the low time frame. On the low time frame, we’re looking at the impulse of the flat C, which is an expanded flat and is currently creating its fourth wave.
Remember, don’t trade without confirmations. Wait for them before creating a trade. Be disciplined, patient, and emotionally controlled. Only trade the highest probability setups with the greatest risk to reward ratio. This will ensure that you become a long-term profitable professional trader.
Don't be a gambler. Don't try to get rich quick. Make sure that your trading is professionally based on proper strategies and trade tactics.

August 4th - Cardano (ADA) bull flag to print 250% move to $2.50
On the above 10 day chart price action is shown with a 40% correction since December last year. A number of reasons now exist for a bullish outlook, including:
Support and resistance
Price action confirms support on past 3 year resistance around 60 cents
Trend reversal
The support confirmation is followed by higher low and higher high prints.
The Bull flag
A measured move from the first impulsive wave will see price action move to the previous all time high of circa $2.50
Summary
The flag set up is fairly reliable with a high success rate for continuation with 60% probability. However avoid greed at the forecast area, many people entered the market at $2.50 in 2021. This was the worst possible moment and have been waiting for this opportunity to exit. Do not be their exit liquidity!
Is it possible price action continues lower? Sure.
Is it probable? No.
Ww
SOL may test 170 before fallingThe SOL structure is quite weak. The price previously broke the upward trend and entered the range of 170-157 as part of a downward movement.
The market is reacting to Bitcoin's rebound, and in this case, SOL may test resistance at 169-170 before falling.
The upward trend has been broken by a H&S reversal pattern. The potential is temporarily changing, and before the long-term bullish trend continues, the market may test deep areas of interest from the support side.

Important Trend Determination Area: 3708.87-3762.33
Hello, traders!
Follow us to get the latest information quickly.
Have a great day!
-------------------------------------
(ETHUSDT 1D Chart)
The price began to rise after breaking above the important 2419.83-2706.15 area.
This can be interpreted as the beginning of a step-up trend, with an upward breakout of the HA-High ~ DOM(60) range.
The HA-High ~ DOM(60) range corresponds to the 2581.59-2681.60 range.
This suggests that the price is currently testing whether a second step-up trend will continue or whether it will simply end as the first step-up trend.
The HA-High ~ DOM(60) range is currently 3708.87-3762.33.
Therefore, if the price rises above 3708.87-3762.33 and maintains this level through the upcoming volatility period, a second step-up trend is expected.
The conditions for this are as follows:
- The K value of the StochRSI indicator must rise from the oversold zone and show an upward trend with K > D. - The OBV indicator must rise above the High Line and maintain an upward trend.
- The TC (Trend Check) indicator must continue its upward trend. (If possible, it's best to stay above 0.)
The next volatility period for ETH is expected to last from around August 6th to 10th.
However, it's worth keeping an eye on the movements during the BTC volatility period.
-
Thank you for reading to the end.
I wish you successful trading.
--------------------------------------------------
- This is an explanation of the big picture.
(3-year bull market, 1-year bear market pattern)
I will explain in more detail when the bear market begins.
------------------------------------------------------

BTC - About to TankBitcoin is holding below these bearish trendlines pointed out on previous posts.
Here we can see liquidation levels on the HTF.
I see two potential moves:
Scenario A)
115,000 to 17,000-20,000 range
Scenario B)
3 Wave Corrective Pattern
115,000 to 35,000
35,000 to 83,000
83,000 to 8,000-10,000
DXY is retesting a major bearish breakdown on the weekly / monthly time frame. This is why we have been seeing the recent drop, and preparation for a mass liquidation / flash crash.
The above stated is my own personal views and is not intended as financial advice. Please trade responsibly.

MTF 2nd bearish macro outlook on Eth, final wave of (Y) coming?This is an idea I've had for a while (unpublished) but looking at local structure, I have to revive this..
It's a very rare expanding triangle idea as the Y wave of the macro WXY wave.
The December 2024 high took out the March 2024 high. And, it's not uncommon, especially in crypto, for B/W wave to take out the previous high (i.e. overshoot). But, considering that the pink a-b-c-d-e's April 2024 low (c) hit the exact 1.618 extension, and the high likelihood of (d) about to hit 4k+ and overshoot the December high of 2024, there is a likelihood that you're seeing an expanding triangle play out.
If you see a rejection at previous December 2024 high (i.e. a swing failure pattern), you must entertain the idea of expanding triangle at the very least.
The unfortunate part is, if this is true, the (e) wave has a huge range, from ~$1400 to $700. The minimum requirement of (e) is to take out the (c) low but can extend to 1.618 at $700.
Will have to see the local structure playout once we get close to (c) or below.
More evidence for expanding triangle is the volume and the open-interest. From March 2024, volume has been steadily increasing (not visible on Bitstamp chart here, but go look at Binance Ethereum chart, for example) and open-interest has been increasing since March 2024, all the while price has kept peaking at ~$4k. For bulls, this should be very concerning as it means the kettle's been boiling hotter and hotter and the pressure's been building up - and long-to-short ratio is still very much positive. A swing failure pattern at (d) and with late longs entering in the market at the peak, it's possible a cascade of liquidation could result in a quick move down to (e).

The Final PushNot long ago Terry started a journey. He led with faith and a determined spirit. Now the time has come for the end. Fortunes were made and fortunes were lost. The end must come so..........
That his new journey may begin,
Thanks for the adventure cant wait to see what is next.
All in XRPRegulatory Shift: Barriers for Ripple and XRP are easing, clearing the path for dominance in crypto/blockchain markets.
End of Retail Bubble: The retail-driven crypto era is fading, with institutional players paving the way for entry.
XRP ETF Progress: Eight XRP spot ETF applications from major funds await SEC approval, expected within months.
Ripple Lawsuit Nearing End : Resolution is imminent, setting a precedent for other crypto projects.
Blockchain as Infrastructure: The new U.S. Treasury Secretary and SEC Director recognize blockchain as critical national infrastructure, comparable to railroads and the internet in its transformative potential. This perspective aligns with the rhetoric of global financial authorities like the IMF, BIS, and WEF, as well as leading consulting firms, which have championed blockchain’s role in revolutionizing finance and cross-border transactions over the past few years.
Market Trends : Stablecoins, CBDCs, tokenization, and cross-border payments will drive growth, settling on public blockchains.
XRP’s Advantage : Stress-tested by global banks and governments for over a decade, XRP is uniquely equipped for large-scale enterprise adoption. Backed by Ripple, a leading fintech with connected leadership and top talent, XRP leverages unmatched expertise and a global network of bank and payment partners, driving innovation and solidifying its enterprise-grade infrastructure.
Market Performance: Post-election, XRP surged 500%, outperforming all coins, with stop-loss hunting below $3 likely over.
Conclusion and price prediction XRP remains largely unnoticed by mainstream media, its transformative potential yet to resonate with the broader public. Compared to Bitcoin, XRP is still in its infancy as a store of value and speculative asset for retail investors. Yet, as market dynamics shift and critical developments unfold, a potent blend of utility-driven demand and speculative momentum could propel XRP to $10 by the end of 2025. If Ripple’s vision of an Internet of Value takes root—enabling seamless, instant, and low-cost global transactions, capturing a substantial portion of SWIFT’s payment flows, and harnessing the power of tokenization—XRP could emerge as a cornerstone digital asset commodity, potentially soaring to triple-digit valuations by 2030 and fundamentally redefining its role in the global financial ecosystem.
[Deep Dive] OP – Edition 4: Accumulated Pressure!Optimism (OP) may be quietly setting the stage for a classic reversal play — with structure, sentiment, and cycle theory all lining up.
After a sharp markdown throughout Q4 2024 and early 2025, OP has spent several months forming what appears to be a rounded accumulation base. And if history rhymes, a markup phase could be next.
🔍 Phase Breakdown
📉 Markdown
The aggressive downtrend sent OP tumbling from above $3 all the way to the $0.50–$0.60 support region, wiping out months of bullish structure and triggering capitulation.
📦 Accumulation
Since then, the price has been compressing sideways in a tight range, respecting the $0.50 psychological zone while creating a rounded bottom pattern. This sideways action — combined with declining volatility — suggests sellers are exhausted, and accumulation may be underway.
📈 Markup Potential
The current setup mirrors textbook market cycles, where markdown gives way to accumulation, followed by expansion. If OP breaks above the $0.70–$0.85 resistance zone with volume, the door opens for a rally toward $1.85 and even $2.00 — the next key supply zones.
⚙️ Fundamental Fuel
Optimism is more than just a Layer 2 — it’s the engine behind the Superchain vision. With OP Stack now powering not only Optimism but also chains like Base and Zora, the protocol is becoming the backbone of Ethereum’s scalability roadmap.
Recent key updates include:
- New governance structures via RetroPGF Round 3 distribution.
- Continued expansion of OP Stack rollups.
- Growth in on-chain activity and TVL thanks to Base's rapid adoption.
All of this adds up to strong long-term tailwinds — especially if Ethereum Layer 2 narratives reheat.
🧠 What to Monitor Next
🔍 Break above $0.85 = confirmation of phase shift.
📊 $0.50 remains the key invalidation level for the current bullish thesis.
🧨 Watch for volume spikes near resistance — they often precede explosive markups.
💬 Are we witnessing the calm before Optimism’s storm — or just another pause in a longer downtrend?
🔔 Disclaimer: This post is for educational and informational purposes only. It does not constitute financial advice. Always do your own research and manage risk carefully.
📚 Always follow your trading plan => including entry, risk management, and trade execution.
Good luck!
All strategies are good, if managed properly.
~ Richard Nasr

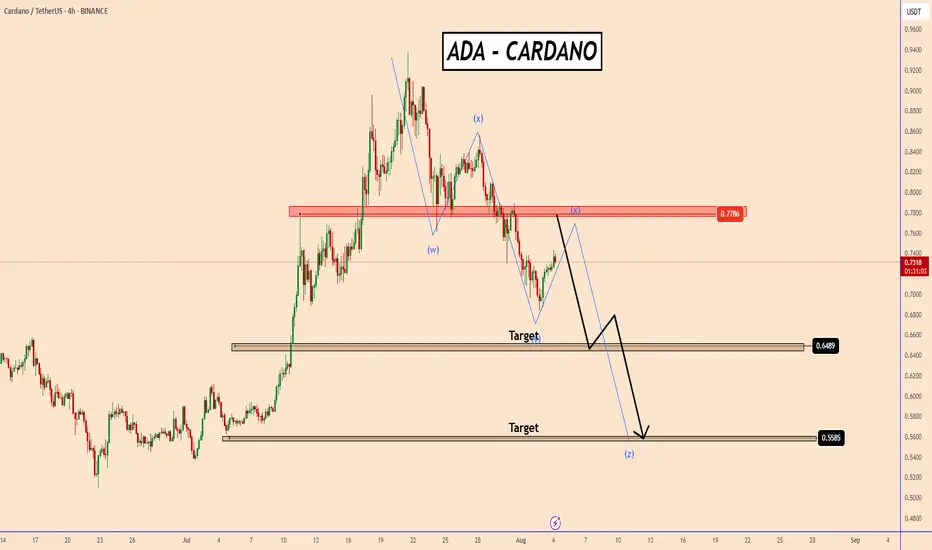
ADA has broken out from a key structure zone near 0.7780ADA - CARDANO, has broken out from a key structure zone near 0.7780
As long as the price remains below this level, the likelihood of a decline toward 0.6490 and potentially 0.5580 remains elevated.
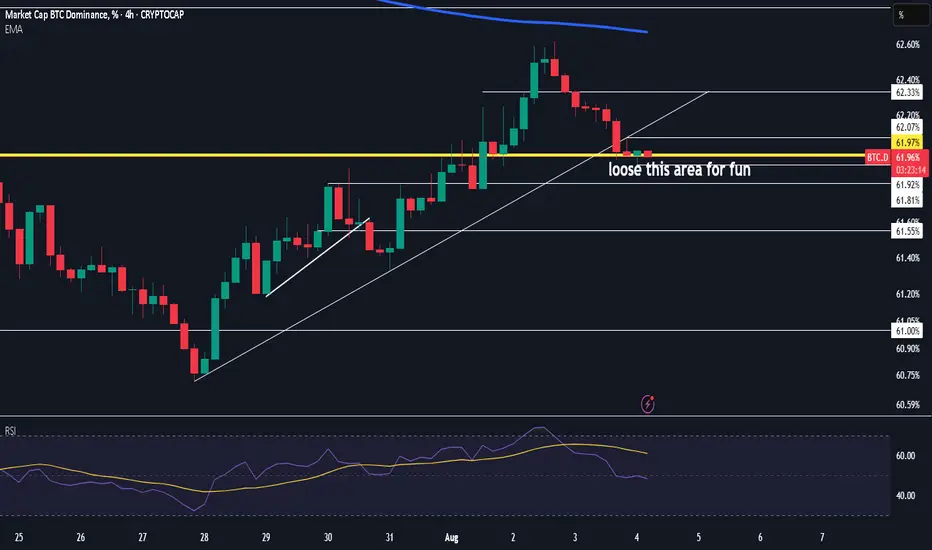
This bearish potential is further supported by BTC, which appears to be entering a broader corrective phase or possibly accumulating before the next upward leg.
This uncertainty is exerting short-term selling pressure across altcoins. While this could hint at an emerging shift in trend, it's premature to confirm any long-term directional change at this stage.
You may find more details in the chart!
Thank you and Good Luck!
PS: Please support with a like or comment if you find this analysis useful for your trading day
$BTC.D are we there yet?? Silly $$ timeok people is it just me excited af
survived yet another cycle of dominance lets run it back to hades from here ;)
time to step on the gas
when you do see a flush moving on !
all the best
DOGE kill all leverage players and now ready to rocketAbout 30% of dump is insane and huge amount even for the holders which where positive and happy about new market pump after years but this market specially the BINANCE:DOGEUSDT market makers are in another level of surprising us.
but soon i think we will see huge gain and pump here so get ready!!
DISCLAIMER: ((trade based on your own decision))
<<press like👍 if you enjoy💚

Lingrid | ETHUSDT Short-Term Move: Buying Opportunity at SupportThe price perfectly fulfilled my last idea . BINANCE:ETHUSDT is attempting a bounce after dipping into the lower boundary of its channel near the $3,400 support level. Price action has followed a descending structure with lower highs inside a broad downward channel. As long as the $3,400 zone holds, a rebound toward the mid-range resistance at $3,630 remains viable. Current positioning inside the "BUYING area" suggests momentum may flip bullish if a reversal structure forms.
📉 Key Levels
Buy trigger: Break above $3,630
Buy zone: $3,250 – $3,400
Target: $3,630 – $3,720
Invalidation: Break below $3,250
💡 Risks
Momentum still favors sellers from the recent sell-off
Failure to reclaim mid-range resistance could cap upside
Broader trend remains within a bearish channel structure
If this idea resonates with you or you have your own opinion, traders, hit the comments. I’m excited to read your thoughts!
