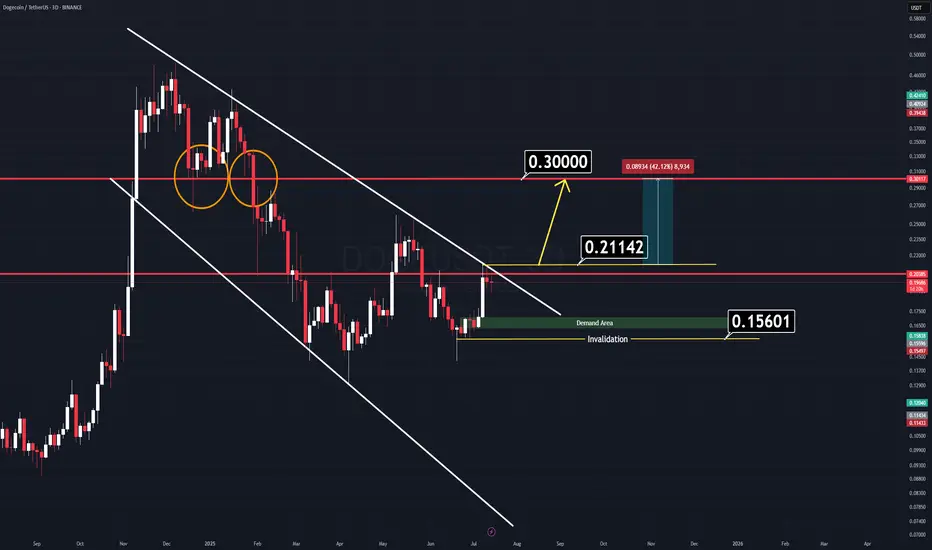
DOGE Analysis (3D)There’s a very simple and clear chart setup on Dogecoin (DOGE) right now.
We have two major horizontal key levels and a channel that is about to break down. If the price manages to close above the yellow-marked line ($0.21142), we can expect a strong rally to follow.
There’s no need for complicated indicators cluttering the screen — all relevant levels are clearly marked on the chart.
Two Logical Entry Approaches:
1️⃣ Breakout Entry: Enter on a confirmed breakout. (Waiting for a daily candle close on a memecoin might slightly reduce your profit range, but it’s the safer approach.)
2️⃣ Demand Zone Entry: Wait for the price to retrace to the green demand zone — though this scenario seems less likely for now.
A combined approach can work best: enter on breakout, use the horizontal levels as support, and set a tight stop-loss to manage risk.
Good Luck.
Crypto market
BTCUSD Possible senarioas long as the price is above this suport BTCUSD is bullish and if price drops below these support then short term bearish may be possible. let us see. currently price is rejecting from fib 0.5 of recent swing
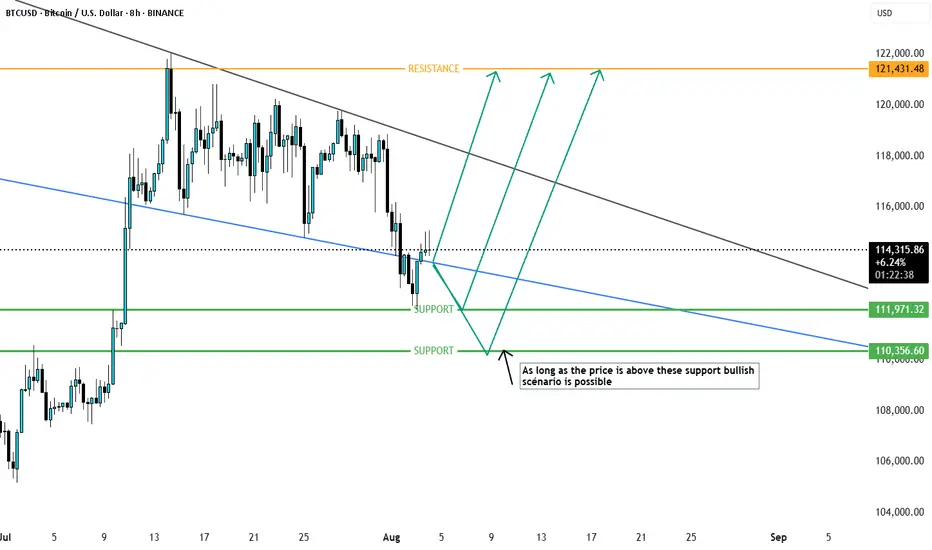
A descending triangle Commonly known as bearish pattern. Price has been increasing for the past few weeks forming a descending triangle. It has attempted to two weeks in a row and price got rejected. As it got close the volume decreased in this particular patten, will this be the invalidation and is it in an accumulation period before the price breaks higher, or will it validate, trap bulls to reverse the price. Another opportunity developing itself for both players. What are your thoughts ?

virtual Trade Planhuge wave 1 completion towards the upside making 5 wave of wave 1 complete and now wave 2 is now it's ending Traders can enter this coin slowly for an explosive wave 3 towards ATH
the whole 5 wave target is around 12.62$ making this trade a solid 12 RR

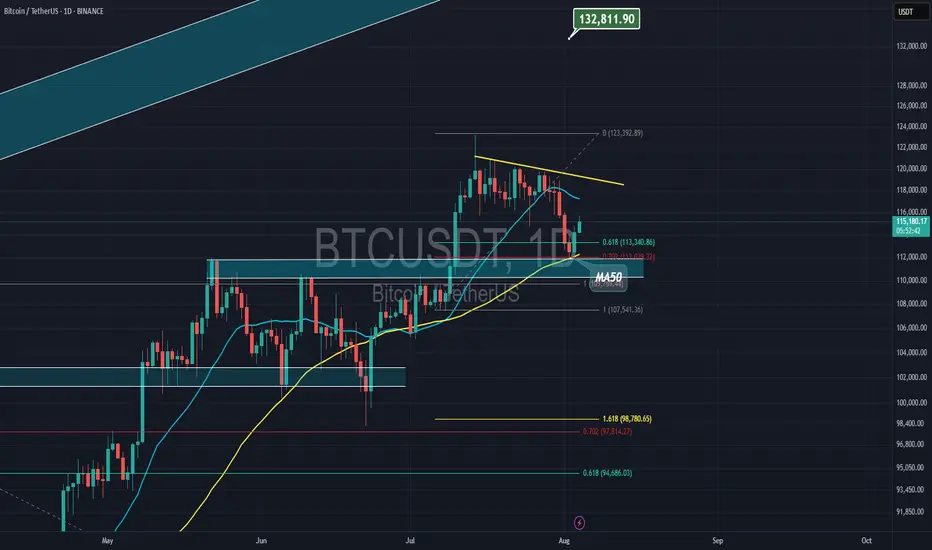
Bitcoin & strong supportBitcoin is holding above 50MA and 61% of Fibonacci, it also has bullish divergence on RSI with bullish engulfing candle. upside movement is coming soon
Sol/Btc✨ Solana vs Bitcoin — a quiet moment before the move?
📍 First week of August 2025
From the roaring highs of 2021,
Solana slowly faded under Bitcoin’s shadow…
Now resting around 0.0014 BTC,
breathing quietly, perhaps gathering strength:
🔸 RSI shows a bullish divergence — momentum building.
🔸 Moving averages (red & yellow) still overhead, but the gap is narrowing.
🔸 Key resistances:
▫️ 0.0020 → 38.2% Fib
▫️ 0.0025 → 50% Fib
▫️ 0.0030 → the golden 0.618 Fib.
🔮 Scenarios:
1️⃣ Break above 0.0020 → a fresh wave toward 0.0030 and beyond.
2️⃣ Rejection → a revisit to 0.0012 ~ 0.0014 BTC zone to reload.
📌 For now, the market holds its breath…
Will Solana awaken?
Or remain in Bitcoin’s shadow a little longer? 🌙

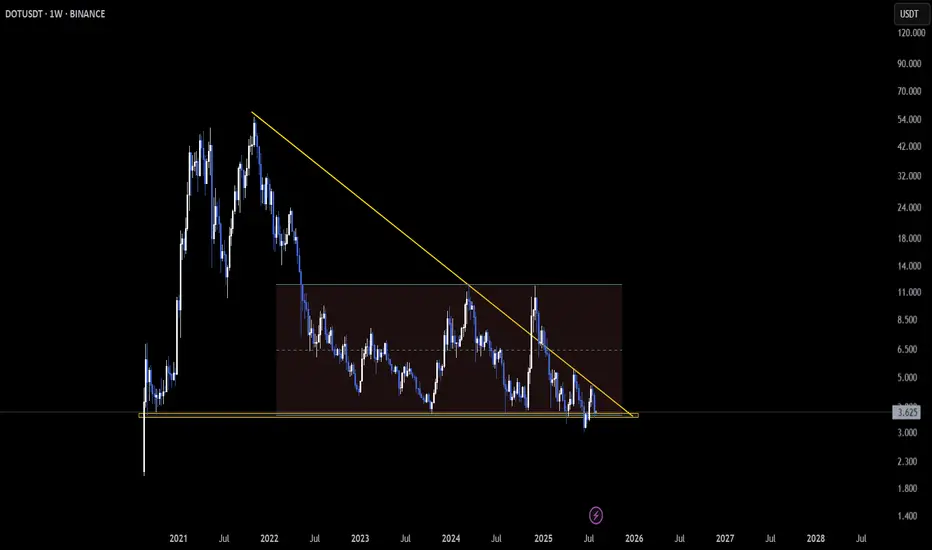
DOT Approaches Key Confluence Zone on Weekly and Daily Charts📅 CRYPTOCAP:DOT is at a crucial juncture, with major structure overlap across timeframes.
On the Weekly, price is testing support from a descending triangle 🛡️ — a level that has held multiple times in the past.
📆 Meanwhile, the Daily chart shows a falling wedge pattern forming 📐, a classic setup known for bullish reversals.
The confluence here adds weight — this is a zone where price often reacts.
👀 Bounce incoming or breakdown loading? This one deserves close attention.
What’s your take on the next move?
Not financial advice. BINANCE:DOTUSDT
SOLANA'S GOLDEN CROSSSolana just printed a golden cross on the daily chart, with the 50-day moving average crossing above the 200-day. That’s usually a bullish sign, but here’s the kicker – price is sitting right at the crossover point, which is when these signals actually matter. That said, it is hard to tell if both MAs are support or resistance until the day closes.
Instead of running higher, SOL is hovering in no man’s land, stuck between two big levels: resistance around $187 and support near $140. After a nasty pullback from the $200s, price bounced at the moving average cluster, but hasn’t done much since. If bulls step in and push us back toward $170+, the golden cross could play out nicely. But if we drop below $155, it starts to look like just another fakeout. Either way, the next move should be telling.

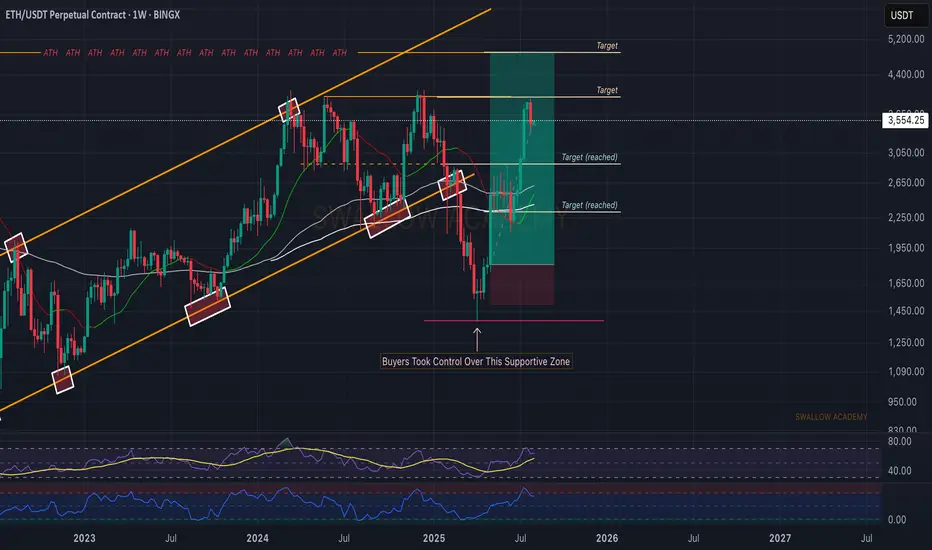
Ethereum (ETH): Looking For Break of $4000 | We Are BullishETH is still bullish in our opinion;recently we had a really good upside movement that got stopped right before reaching the $4000 zone.
Now we had a smaller pullback, which is normal as we had a really strong upside movement so we see it as a natural pullback, which will give us another bounce opportunity (accumulation zone).
Since our entry we have had a good movement, and we are keeping the position open until we reach the ATH zone!
Swallow Academy
BITCOIN RUN IS NOT OVER!bitcoin historically ends its run in Q4, the year after the year in which the major downtrend breakout occurs

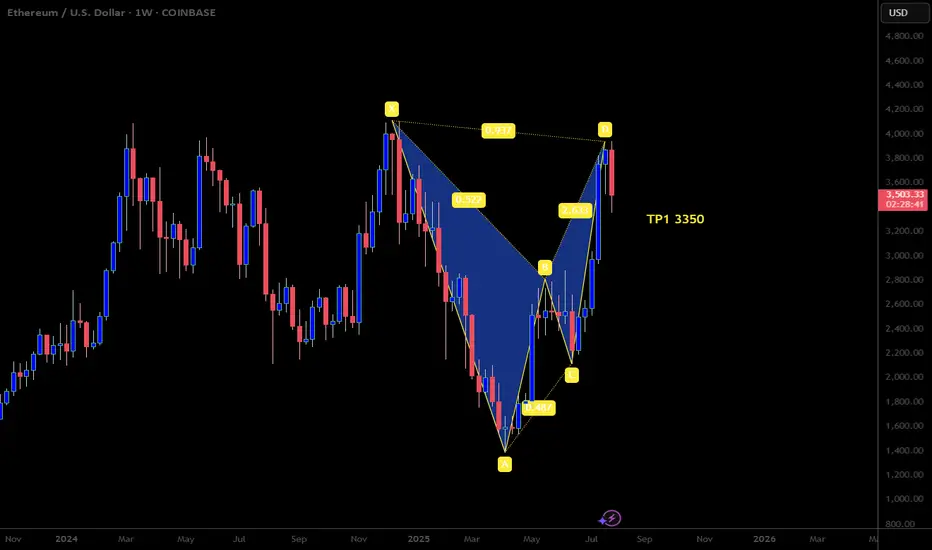
Bearish Bat Pattern on ETHUSDLooking to continue selling here with this beautiful harmonic bat pattern that just formed. We also got a bearish candle close on the weekly timeframe which gives us solid sells confirmation. Happy Trading
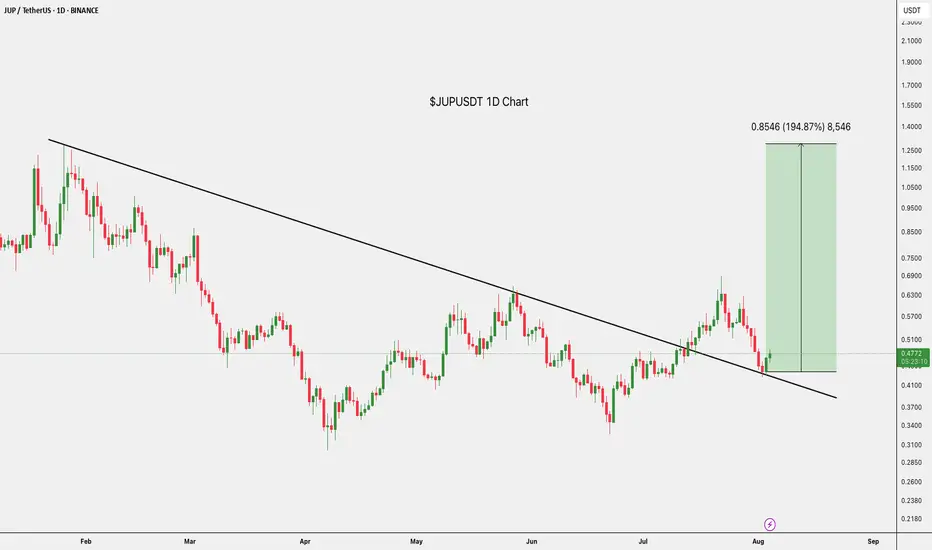
$JUP Breakout Targeting 195%LSE:JUP has broken out of a long-term downtrend and successfully retested the breakout around $0.4675.
The bounce looks strong, and with momentum building, a move toward $1.3354 (nearly 195% upside) is on the cards.
Signs of accumulation are clear; this could be the start of a trend reversal.
DYOR, NFA
LTCUSDT sleeping giantLTC was consolidating for a long period of time, and ready to blast off soon.
Targets are on chart.
DYOR
NFA

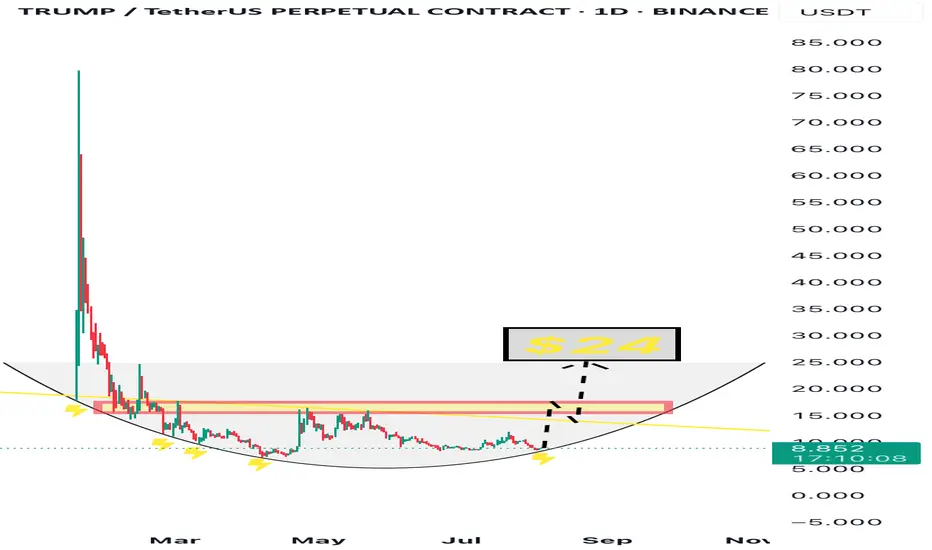
$TRUMP - Rounding Bottom + Strong Narrative We’re currently witnessing a classic rounding bottom formation on the $TRUMP chart.
The price has touched the base 4 separate times, each followed by a bounce — clearly indicating strong support and accumulation.
Now, once again, $TRUMP is testing this base, and structurally the chart suggests a potential breakout toward $24, the top of the cup.
But it’s not just a technical story — the fundamentals are stronger than ever:
• 🎲 A Trump-themed Monopoly game has been officially confirmed by Bill Zanker and the project’s team
• 💸 Justin Sun has publicly announced he will purchase $100 million worth of $TRUMP tokens
• 🛡 Eric Trump revealed that $TRUMP will be added to WLFI’s strategic reserves
This is no longer just speculation — it’s momentum backed by real players.
All eyes on the $24 breakout.
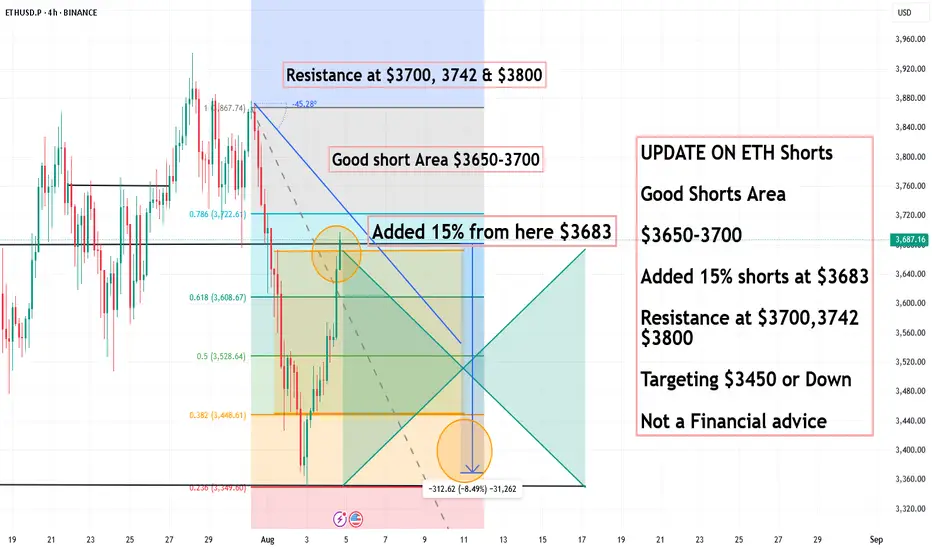
UPDATE ON ETH Shorts, Good Shorts Area $3650-3700UPDATE ON ETH Shorts
Good Shorts Area
$3650-3700
Added 15% shorts at $3683
Resistance at $3700,3742
$3800
Targeting $3450 or Down
Not a Financial advice
BTCUSD going to touch 116,800BITSTAMP:BTCUSD Long trade, with my back testing of this strategy, BTCUSD need to touch 116,800
This is good trade, don't overload your risk like greedy, be disciplined trader, this is good trade.
Use proper risk management
Looks like good trade.
Lets monitor.
Use proper risk management.
Disclaimer: only idea, not advice

Technical Analysis: All About Its Origin
Technical Analysis is the discipline that studies and graphically records the price and volume changes of a stock or asset, with the aim of exploiting recurring patterns and phenomena with predictive characteristics.
The origins of Technical Analysis date back to 17th-century Japan, in the rice futures markets of Osaka. After a century of internal wars among the daimyo—Japanese feudal lords—General Tokugawa emerged victorious at the Battle of Sekigahara (1600), initiating the unification of Japan. To maintain the loyalty of his subjects, Tokugawa, appointed Shogun, consolidated his power and ensured the allegiance of his followers by concentrating the political-military elite and their families in Edo (modern-day Tokyo).
At that time, the primary source of income for the daimyo was rice collected from the peasants working their lands. Since transporting rice to Edo was impractical, it was stored in the port of Osaka. The proximity of the daimyo in Edo sparked a competition for prestige, manifested through luxuries and other excesses. To sustain this lifestyle, the daimyo sold stored rice and even future harvests. For this “future rice,” warehouses began issuing contracts known as “empty rice.” These contracts were traded in a secondary market, giving rise to one of the world’s first futures markets.
The most prominent trader in this market was Munehisa Homma, who operated in the early 18th century. For Homma, markets were heavily influenced by the psychology of investors, who sometimes perceived a harvest differently from reality. In his book, *The Fountain of Gold*, he expressed ideas that remain highly relevant today, particularly what many Western traders know as contrarian opinion:
“When the price of rice begins to rise, orders come in from all directions at once, and soon the Osaka market joins the frenzy. The price of rice rises faster when people place orders even for stored rice, and it becomes clear that a buying fever is underway. But when you want to be in the position of placing buy orders like everyone else, it’s important to be on the side of those placing sell orders. When people move in unison, rushing westward with the determined intention of participating in the rise, that’s the moment for you to head east, and you will discover great opportunities.”
Steve Nison, an investor who popularized the use of Japanese candlesticks in the West, states in his book *Beyond Candlesticks*:
“In the material I translated, candlestick charts are often called Sakata charts, in reference to the port city of Sakata, where Homma lived. However, based on my research, it is unlikely that Homma used candlestick charts. It is more likely that these charts were developed in the early part of the Meiji period in Japan (late 1800s).”
It is worth noting that, although Homma may not have used candlestick charts, this type of graphical representation was the evolution of centuries of experience using price records for predictive purposes.
The Revolution of Japanese Candlestick Charts
The graphical representation of prices has been a determining factor in the evolution of technical analysis, marking a clear distinction between investment approaches in the East and the West. While traditional bar charts, predominant in the West, were limited to showing opening and closing prices, Japanese candlestick charts offered a more comprehensive view of investor psychology. These charts incorporated not only the opening and closing prices but also the highs and lows of each session, represented intuitively through the body and wicks of the candles.
Perhaps Western investors, constrained by the simplicity of bar charts, developed an approach more focused on studying price formations, while the Japanese could make decisions based on the analysis of small groups of candles. Over time, however, both approaches proved equally practical, and a multi-timeframe understanding became part of the operations of both Western and Japanese investors.
An example of the application of a multi-timeframe approach in the West is found in the father of modern technical analysis, Richard W. Schabacker, who, despite his short life, left a prolific body of work. In his book *Technical Analysis and Stock Market Profits* (1932), he classifies markets into major movements (monthly), intermediate movements (weekly), and minor movements (daily). In Japan, Goichi Hosoda, the creator of the Ichimoku Kinko Hyo indicator, is the best example of an investor who dedicated his life to cataloging and studying price formations beyond the use of candlestick patterns.
Over time, modern Western investment platforms adopted the innovations of Japanese candlestick charts, integrating the ability to display highs, lows, openings, and closings in a single format.
In the early 20th century, scholars of charts in the West were known as chartists, but today, “Chartism” is associated with a classical methodology popularized by journalist and investor Richard W. Schabacker (1899–1935) and later by the book *Technical Analysis of Stock Trends* (1948) by authors Robert D. Edwards and John Magee.
Theory on the Emergence of Technical Analysis
Since the dawn of humanity, people have sought to represent the phenomena around them to understand or communicate information. Whether through cave drawings, symbols, or written records, visual representation has been a fundamental tool for making sense of the world. Undoubtedly, price fluctuations were a phenomenon that invited analysis.
The earliest investors, using graphical representations, aimed to find order in chaos. By meticulously recording price movements, these pioneers likely discovered something surprising: repetitive patterns that seemed to predict future behavior. This discovery must have been thrilling, as it offered the promise of significant profits, often with seemingly low risk.
Without needing to understand market psychology, as later technical analysts would, these early investors found a practical advantage in these patterns. When enough of them identified and acted on the same pattern, it tended to fulfill itself more frequently, reinforcing its validity. Thus, what began as an intuitive observation evolved into a structured practice, laying the foundation for what we now know as Technical Analysis: a discipline that thousands of investors use to interpret market behavior and make informed decisions.
Fun Fact
The first work to describe the phenomenon of stock market investing is titled *Confusion of Confusions* (1688) by José de la Vega, set in Amsterdam, the financial hub of Europe at the time. More than a detailed study of the investment methods of the era, this novel seeks to entertain and inform readers about the risks of speculation.
Its author, moreover, employs a narrative style that surpasses even the florid prose of his contemporaries:
“They strive to perpetuate the unrest of those who frequent their dealings, and just as they imprison them in their towers, they cast the locks into the sea so that the hope of ever removing the bolts may never flatter them.”
Conclusions
Some might consider the history of technical analysis a curious but irrelevant tale for modern practice. However, history shows us that markets are more than just numbers—they are a reflection of human psychology. Far from being a mere catalog of tricks to memorize, technical analysis invites us to understand psychological dynamics to make informed decisions.
Recognizing that markets are shaped by historical patterns grants us a strategic advantage. By studying how past investors interpreted prices and emotions—from rice traders in 17th-century Japan to modern analysts—we can anticipate market movements with greater precision. This perspective not only enriches our trading but also positions us as more aware and prepared investors in an environment where collective psychology remains the dominant force.
References
Nison, S. (1994). *Beyond Candlesticks: New Japanese Charting Techniques Revealed*. New York, NY: John Wiley & Sons.
Schabacker, R. W. (1932). *Technical Analysis and Stock Market Profits*. New York, NY: B.C. Forbes Publishing.
Edwards, R. D., & Magee, J. (1948). *Technical Analysis of Stock Trends*. Springfield, MA: John Magee.
Rabassa, Y. (n.d.). *How to Master Japanese Candlesticks?* . YouTube.
ALICE/USDT – Will It Rebound from Demand Zone or Break Down?🧭 Analysis Summary:
ALICE is at a critical turning point, once again testing a historical demand zone that has provided strong support since Q2 2025. The current price action suggests potential accumulation, setting the stage for a significant move — either a powerful bounce or a devastating breakdown.
---
📌 Chart Details (Daily Timeframe):
Main Trend: Still in a macro downtrend since December 2024
Current Price: $0.3714
Key Demand Zone: $0.35 – $0.41 (highlighted yellow box)
Nearest Supports: $0.35 → $0.3102 (2025 low)
Layered Resistance Levels: $0.4786 → $0.5672 → $0.6481 → $0.7986 → $0.9754
---
🧱 Market Structure & Patterns:
Price has been consolidating in a tight range over recent weeks — indicating possible accumulation or distribution.
The long-standing descending channel shows signs of exhaustion, with repeated rejections from the demand zone.
A small double bottom pattern appears to be forming, suggesting a possible reversal if validated.
---
📈 Bullish Scenario – Reversal Potential on Confirmation:
✅ If the price holds above $0.35 and forms a higher low, a trend reversal could take shape.
✅ A breakout above $0.41 would act as the first bullish confirmation.
🎯 Upside Targets:
$0.4786 → minor resistance, good for short-term swing trades
$0.5672 – $0.6481 → mid-range resistance & Fibonacci levels
$0.7986 – $0.9754 → longer-term recovery zone if sentiment improves
💡 Stronger confirmation would come from increasing volume and Daily RSI crossing above 50.
---
📉 Bearish Scenario – Breakdown and Trend Continuation:
❌ A breakdown below $0.35 would likely push price toward the $0.3102 support — the lowest level of the year.
❌ If $0.31 fails, further downside toward $0.25 or even $0.20 is possible, due to a lack of nearby historical support.
💀 This would confirm the continuation of the major downtrend, signaling sellers still have control.
---
📊 Market Sentiment:
On a broader scale, altcoins are still under pressure amid regulatory uncertainty and declining DeFi activity.
However, ALICE’s demand zone remains a high-interest area for traders seeking mid-term accumulation opportunities.
---
🎯 Strategy Ideas:
Strategy Type Action Key Levels
Buy on Breakout Enter on confirmed breakout > $0.41 Target: $0.48 – $0.64
Sell on Breakdown Short below $0.35 Target: $0.31 or lower
Range Trade Buy low, sell high between $0.35–$0.41 Tight stop-loss recommended
---
📝 Conclusion:
ALICE/USDT is at a technical and psychological crossroads. This yellow zone is where big moves often begin — the question is, will bulls take control or will bears pull it deeper? All eyes should be on how price reacts to this demand area.
#ALICEUSDT #CryptoTA #AltcoinAnalysis #DemandZone #BreakoutOrBreakdown #PriceAction #VolumeAnalysis #CryptoReversal #SwingTradeSetup #ALICEAnalysis #CryptoTrend

Gaming Narrative Just Getting StartedHello Traders 🐺
Usually, I’m a big fan of large market cap coins — you can rely on them and make solid profits, especially with proper leverage.
But sometimes, especially at the beginning of an Altcoin season, I like to pick one or two small-cap alts that have the potential for a 50x–100x run from my entry point.
So, here’s one of the bags I’m holding.
Everything looks fine — it's currently ranked around #1500 on CMC, and I believe it can easily reclaim a spot below #1000.
Tokenomics look solid, and in my opinion, the gaming sector this cycle could be mind-blowing, with huge upside potential.
Even better, this project is about to launch its mobile version, which in my view will make the game way more accessible — and that could change everything.
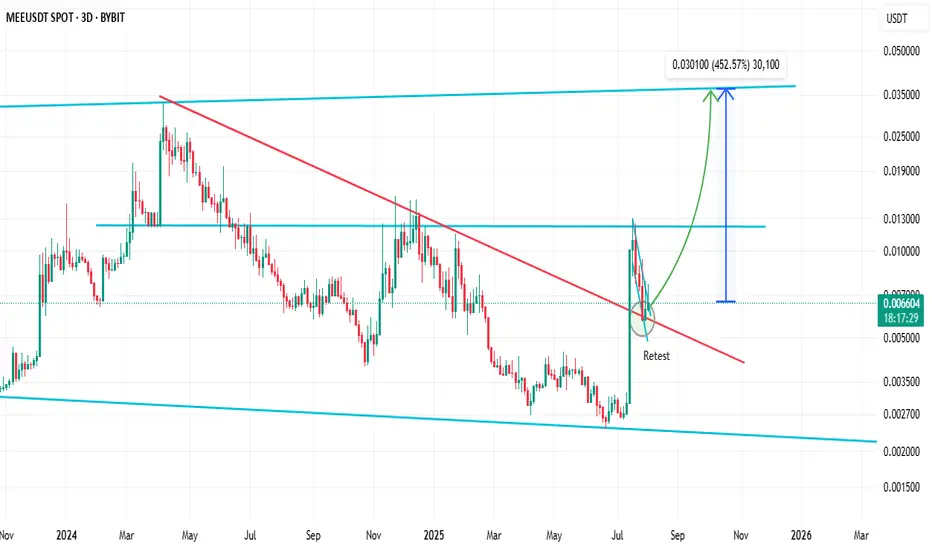
As for the chart:
Price is breaking above the weekly resistance and currently retesting it as support.
If it manages to break out of the daily channel, I believe the next stop is the ATH at $0.033.
Let’s see how this plays out.
As always —
🐺 Discipline is rarely enjoyable, but almost always profitable. 🐺
🐺 KIU_COIN 🐺

VIRTUAL/USDT – Rebound Incoming or Deeper Collapse?🔍 Overview: Bearish Pressure, But Structure Holds
VIRTUAL/USDT is currently consolidating within a well-defined Descending Channel pattern that has been forming since early May 2025. While the trend is bearish, price action remains within a controlled structure — a potential sign of hidden accumulation or smart-money positioning.
What makes this setup compelling is that price has just touched the lower boundary of the channel while also interacting with a historical demand zone around 1.20–1.25 USDT, which previously triggered a strong rally back in May.
---
🧠 Key Technical Pattern: Descending Channel + Historical Demand Zone
Descending Channel → Suggests consistent selling pressure but within a structured range — no real breakdown yet.
Demand Zone (1.20 – 1.25 USDT) → A historically strong support level that has launched sharp upward moves in the past.
Decreasing Volume → Could indicate weakening bearish momentum as price approaches key support.
---
📈 Bullish Scenario (Bounce from Support):
If the price manages to hold and forms a reversal signal (such as a bullish engulfing or hammer candle), we could see a relief rally toward key resistance levels.
🎯 Potential Bullish Targets:
1. 1.6787 USDT – Mid-channel resistance
2. 1.9000 USDT – Psychological and structural resistance
3. 2.0848 – 2.4571 USDT – Horizontal resistance zone and top of the channel
4. 3.7620 – 4.6267 USDT – Extended targets if breakout occurs with volume
📌 Bullish Confirmation Needed: A strong breakout above the channel midpoint + increasing volume to confirm a potential trend reversal.
---
📉 Bearish Scenario (Breakdown from Channel):
If the price fails to hold above the 1.20–1.25 support and breaks below the channel support, we may see increased selling pressure and a continuation of the downtrend.
🎯 Downside Targets:
1.00 USDT – Psychological support
0.90 – 0.70 USDT – Previous accumulation range
0.4110 USDT – All-time low and ultimate downside target
🚨 A strong breakdown with high volume could trigger panic selling and a prolonged bearish leg.
---
🎯 Conclusion:
> VIRTUAL/USDT is at a pivotal decision point — hold and bounce, or break and slide.
The structure is still intact, and the price is testing two critical technical zones simultaneously: the descending channel support and a major demand area.
This is not the time to chase price, but to observe and prepare for confirmation. A strong signal here could set the tone for the next major move.
#VirtualUSDT #CryptoTechnicalAnalysis #DescendingChannel #DemandZone #ReversalSignal #AltcoinAnalysis #CryptoTradingSetup #PriceActionTrading #SupportResistance

ETH forming double topETH is forming a double top, nice confluence to what BTC is doing rn
Maybe that's the turnaround and its going back down for now.
