Crypto market
BTC - 1H Elliott Wave AnalysisWelcome back to another Elliott Wave Analysis for Bitcoin! :)
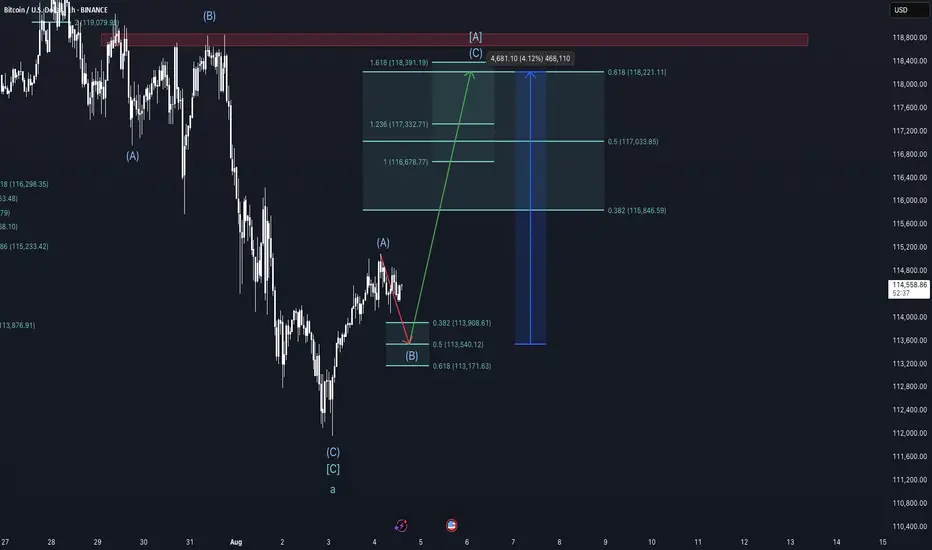
In this analysis we want to focus on the short term. We have been in a correction displayed as pink ABC and it seems that this correction is coming or has come to an end in the pink Wave C.
It is hard to say if the pink Wave C has finished yet. The last low at 111'850 USD is the 1 to 1 ratio of the pink Wave A to the pink Wave C which is a common target for Wave C.
Looking at the sub-count in white we think another low in white Wave 5 would look cleaner but it is not given to happen.
For now we added the white Wave 4 resistance of which we touched the 0.5 FIB retracement at 115'830 USD which is a rather deep but valid Wave 4. We also added the 0.618 FIB at 116'213 USD which would be the invalidation for the white Wave 4. If we hit it the probabilities shift to the case that the low at 111'850 USD is already the end of pink Wave C.
If we get white Wave 5 the first target would be at the 1 to 1 FIB at 111'319 USD which is right below the last ATH of which we bounced recently but that seems a bit shallow.
The next target would be at around 109'700 USD where we got some confluence between the 1.38 FIB target for white Wave 5 measured with the white Wave 1 as well as the 1.618 FIB target if we measure of the white Wave 4. It is also close to the 0.5 FIB of a bigger support area.
Be aware that the bigger support area below goes down to 103'000 USD which is the 0.786 FIB of the support area.
Due it looking likely that pink Wave C is finished we also added the support area for the potential Wave 2 in the bullish scenario.
It is between the 0.5 FIB at 113'640 USD and the 0.786 FIB at 112'616 USD. From this area we would like to see a bounce if the low is already in.
Thanks for reading.
We would appreciate a follow and boost if you like the analysis! :)
NO FINANCIAL ADVICE.

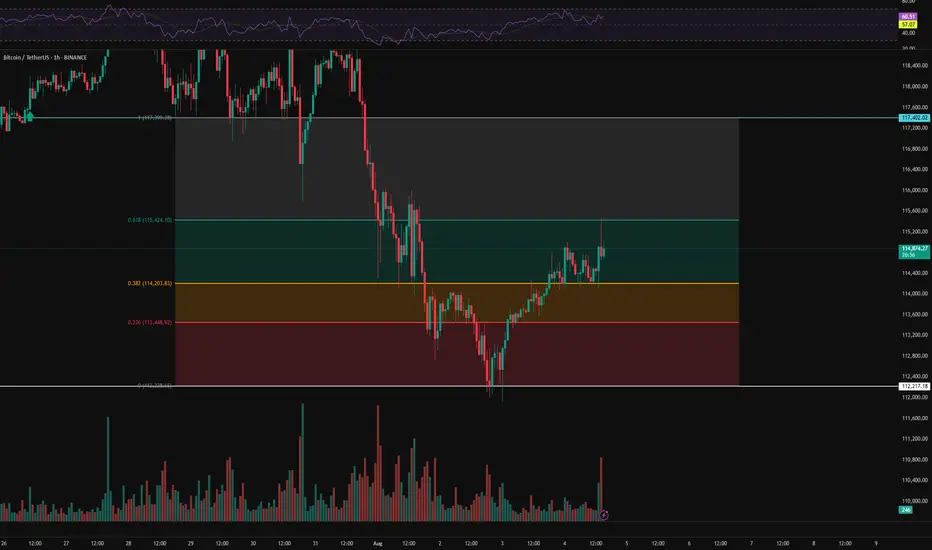
BTC Hourly Analysis – Day 1 | Trend Structure & Key Reactions⏱️ We’re analyzing Bitcoin on the 1-hour timeframe.
👀 After breaking below its support zone at 107,402, Bitcoin experienced a correction along with increasing sell pressure. The price then moved toward the 112,200 support area, where it formed a V-pattern — which has now been broken to the upside.
🎮 We’re using Fibonacci levels to identify key resistance zones and long-entry triggers. A higher low has formed above the 112,217 support and above the 0.382 Fib level, which could serve as a strong confirmation of the breakout .
⚙️ The RSI oscillator on the 1H chart is currently above 50. If buying volume increases, RSI may enter the Overbought zone. The critical level here is 70 — breaking above it can act as a confirmation for a long position .
☄️ A specific Fibonacci-based zone, linked to market maker sellers and supply pressure, was touched, triggering a reaction — around 177 BTC were sold following that touch .
🖥 Summary : As long as Bitcoin stays above its previous high, there’s no immediate concern for long positions. Based on the confirmations above, you may consider entering a long position upon a resistance breakout and taker-seller zone clearance .
📉 No short positions are planned until the 110,000 support level is clearly broken .
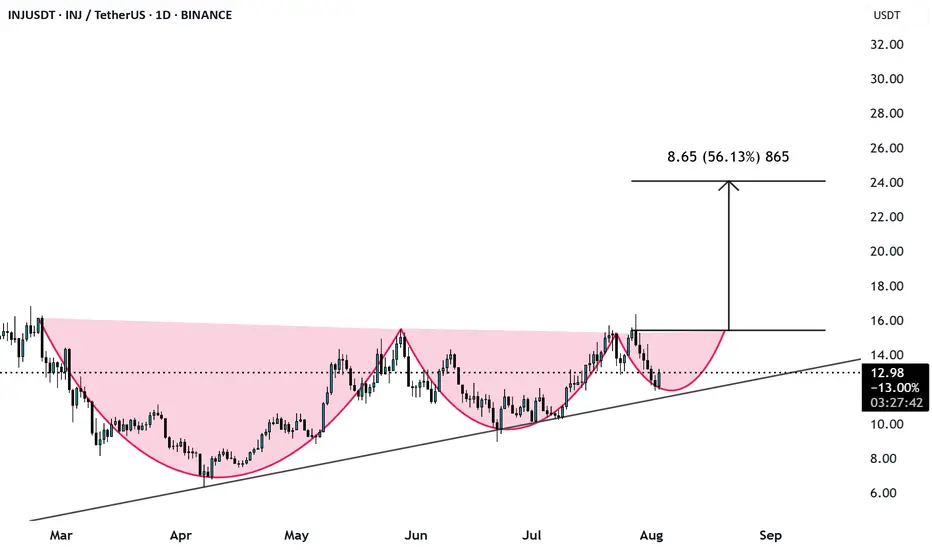
INJUSD Ascending triangle PatternINJUSD has forme a Ascending triangle pattern and looks like double cup and single handle pattern.
Bullish potential detected for EthereumEntry conditions:
(i) higher share price for COINBASE:ETHUSD along with MACD crossover on the 4 hour chart at the low end of the scale with histogram crossover zero,
(ii) bounce off potential support zones of 15 min / 1 hour and 4 hour intraday timeframes, and
(iii) observation of market reaction at these support zones.
Stop loss for the trade would be below the ultimate support level from the open of 22nd January (i.e.: below $3327.56).

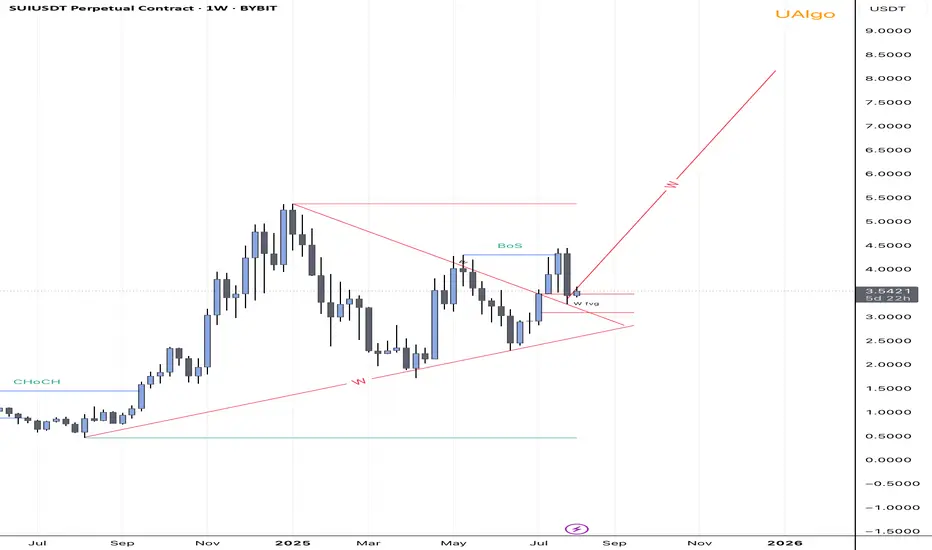
SUI Bullish Breakout Confirmed- $8 Target In sight! Hey everyone,
Today marks an important moment for SUI. We’ve just witnessed a clean breakout from a long-term symmetrical triangle on the weekly timeframe, supported by a confirmed Break of Structure (BoS) and a weekly Fair Value Gap (FVG) acting as strong support.
Price respected the FVG zone and bounced, showing clear bullish intent. With strong structure forming and momentum building, I’m targeting the $8 region as the next major level of interest. Market structure is bullish, and the confluence of trendline support, FVG, and the breakout gives me confidence in this move.
Key Highlights:
• Weekly CHoCH followed by BoS 🚀
• Price broke out of triangle and retested FVG🚀
• Bullish continuation structure (W formation)🚀
• Targeting $5.5 → $8 range if momentum holds🚀
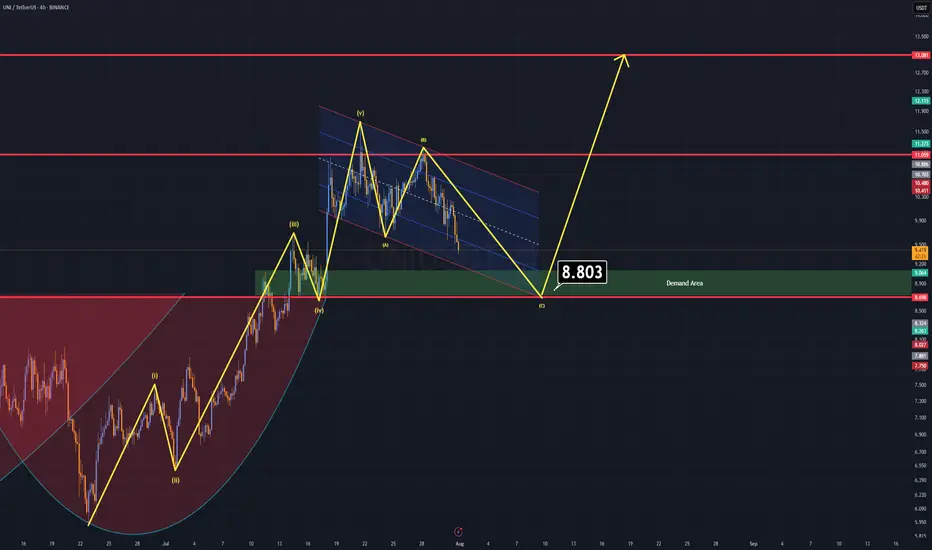
UNI Analysis (4H)UNI – Correction Might Bring Opportunity
Currently, UNI is forming an A–B–C corrective pattern, and based on technical structure, this correction may complete around the $8.8 level.
Key Zone to Watch: $9.0 – $8.5
There's a strong demand zone just below $9, supported by historical price action.
On the daily time frame, a broken cup & handle formation aligns perfectly with this area — the old neckline may now act as support, increasing the confluence.
This overlap of structure and demand makes the $9–$8.5 zone a favorable entry for a long position.
Once price reaches this area, expect a significant upward correction as part of the next move in the cycle.
Good Luck.
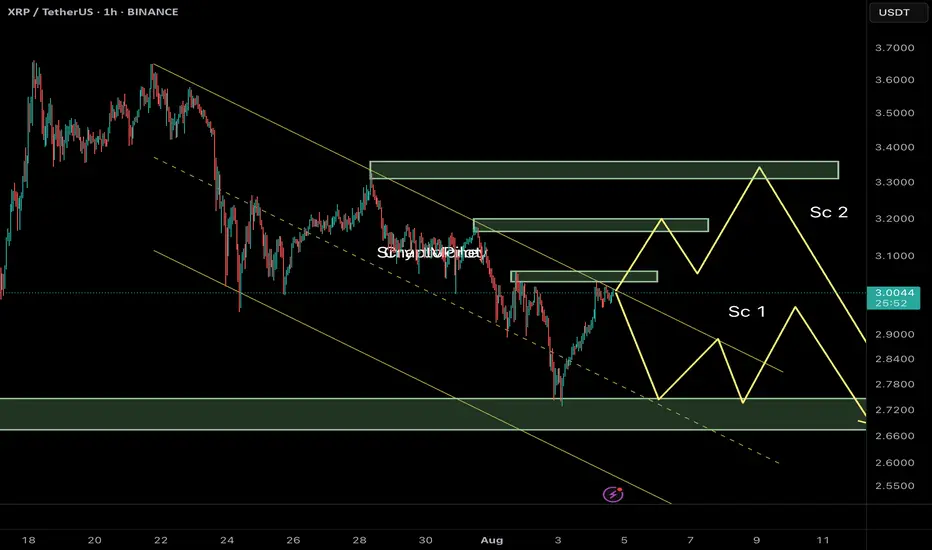
Ripple (XRP/USDT) Technical Analysis – 1H Timeframe🔰 Current Market Context:
After breaking below the ascending channel near $3.50, XRP has entered a corrective phase within a descending channel. Price is now hovering around a mid-range resistance zone, and we can outline two key potential scenarios from here:
⸻
📌 Scenario 1 (Sc1) – Immediate Rejection and Bearish Continuation
In this case:
• Price gets rejected from the current resistance zone ($3.05–$3.10).
• A quick corrective pattern (likely a Zigzag or Flat) plays out.
• XRP moves down to test the next demand zone near $2.70–$2.65, breaking below recent swing lows.
✅ This scenario aligns with the current weak structure and visible sell-side pressure. Liquidity above recent highs has likely been swept, creating a setup for continuation downward.
⸻
📌 Scenario 2 (Sc2) – Extended Correction with a Final Bull Trap
In this case:
• Price pushes higher toward a deeper resistance zone near $3.30–$3.40.
• A liquidity grab above the prior highs triggers a sharper reversal afterward.
• The overall structure could form a Diametric or Complex Correction, suggesting a deeper and more time-consuming wave before resuming the bearish trend.
⛔ This scenario requires strength and acceptance above $3.15, and should be treated as an alternative unless proven by price action.
⸻
🎯 Summary & Trade Strategy:
Scenario 1 is currently more probable unless we see a strong break and close above $3.10. Expectation: XRP may head toward the $2.70–$2.65 demand zone if resistance holds.
⚠️ Avoid entering early. Wait for confirmation via internal BOS (Break of Structure), bearish engulfing near OB zones, or signs of rejection with volume at resistance.
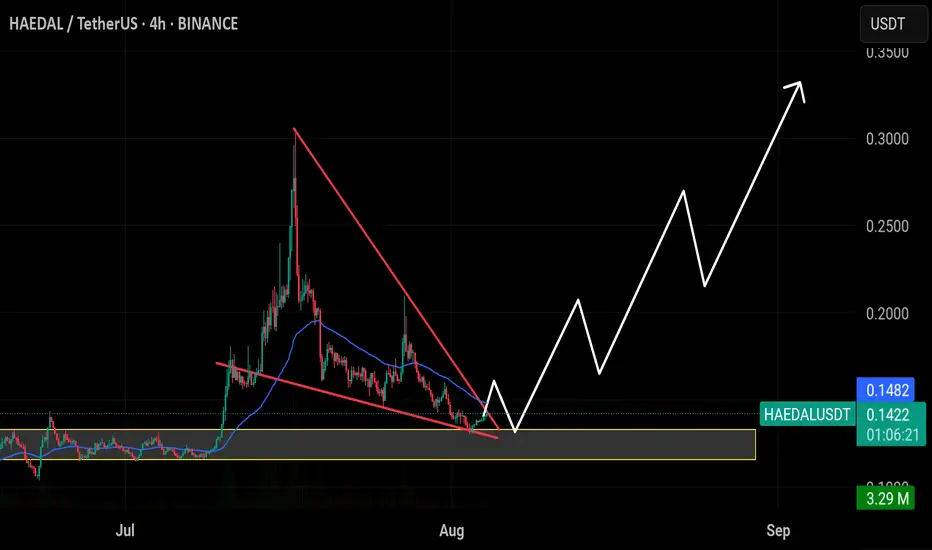
$HAEDAL is moving in a falling wedge. A breakout soon could give$HAEDAL is moving in a falling wedge. A breakout soon could give a 30–60% rise in the short term.
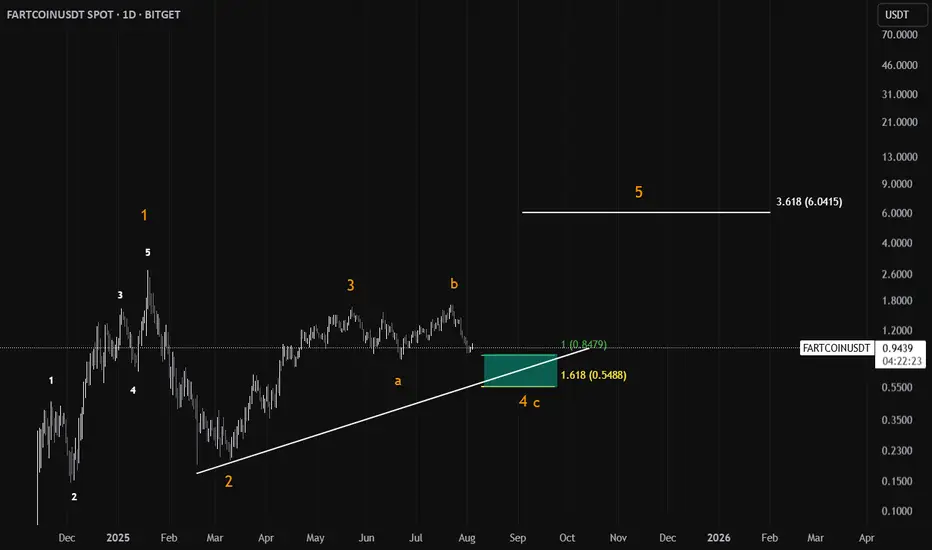
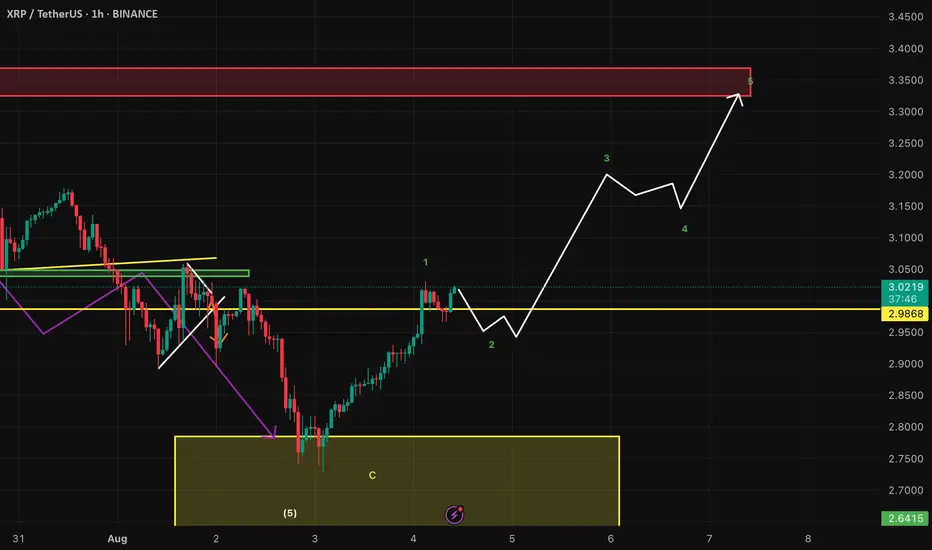
XRPUSD LongWe just finished the 5th wave as exspected and allready started the 1st wave of the next bullish move. I will wait for a correction and enter a long position.
SOLUSDT 1D - Bulls back in control with Golden Cross and channelOn the daily chart, SOLUSDT is forming a bullish continuation structure. After the Golden Cross (MA50 crossing MA200), the price is now pulling back toward the midline of the ascending channel and the 0.5 Fibonacci level at 166.38. This confluence with the broken trendline and 200 EMA makes this zone a prime technical area of interest.
Support: 166.38 (0.5 Fibo), EMA200 (161.77), broken trendline
Resistance: 182.84–189.67 (Fibo 0.705–0.79), 206.54, target - 255.93 (Fibo 1.618)
This retracement looks healthy, supported by higher volume during the prior bullish leg. As long as the 166.38–161.77 zone holds, continuation toward 206.54 and potentially 255.93 is on the table.
Fundamentally, Solana remains a key L1 narrative with strong traction in DePIN and AI-linked dApps. The rising TVL and investor sentiment support the trend.
Watch price action around 166 for confirmation - this is the battleground.

Bear trap on its way - Bitcoin Weekly Update August 4-10thThis week brings a series of macroeconomic and geopolitical developments that may influence global risk sentiment and, consequently, Bitcoin’s price trajectory.
On Monday, the U.S. releases Factory Orders, a key indicator of industrial demand. Surprises in this data can affect risk assets broadly, as they reflect business investment activity. Weak numbers would likely increase expectations of monetary easing, which tends to support Bitcoin.
On Tuesday, the spotlight turns to the ISM Non-Manufacturing PMI, a leading indicator for the U.S. services sector, which accounts for roughly 70% of GDP. A significant deviation from expectations—especially a decline—could reinforce rate-cut expectations and provide tailwinds for speculative assets like Bitcoin.
Thursday is a critical day, with the Bank of England's interest rate decision in focus. While direct effects on crypto are limited, a hawkish stance could weigh on global risk appetite if inflation concerns resurface. Also on Thursday, the U.S. releases its weekly Initial Jobless Claims—a timely barometer of labor market strength. A rising trend here would suggest economic cooling, strengthening the case for looser policy and potentially benefiting crypto.
However, the most geopolitically sensitive event this week is the reintroduction of country-specific reciprocal tariffs by the United States, taking effect on August 7. Affected countries include Canada (35%), Mexico (30%), and Brazil (50%). These measures could re-escalate trade tensions and trigger short-term market volatility. Retaliatory responses from these countries would likely fuel risk-off sentiment, pressuring assets across the board.
From a technical standpoint, Bitcoin remains within a multi-degree corrective structure according to the Elliott Wave framework. On the cycle degree, we are in a B-wave; on the primary degree, in an A-wave; on the intermediate degree, in a B-wave; and on the minor degree, in a C-wave. This implies that a short-term move lower is still expected, but once complete, a relief rally of approximately 4% could follow before the onset of a larger correction, likely Primary Wave B.
Chart structure suggests that Minor Wave C is in its late stages. Early signs of exhaustion, such as waning downside momentum or bullish reaction at key support zones, could offer clues of an approaching bottom. However, such a rebound should be viewed as temporary and not a trend reversal.
Taking a view between the lines on the on-chain data, the liquidity heatmap shows major liquidity around the red rectangle drawn into the chart, suggesting higher prices. Also, the rather low funding rate on futures suggest an exhausted downward trend and a trend reversal in the near future is likely.
Conclusion:
This week’s calendar offers several macroeconomic catalysts with the potential to move markets. U.S. economic data and tariff policy developments will likely shape near-term sentiment. Technically, Bitcoin remains in a corrective phase with limited downside left before a short-term recovery becomes more probable. Traders should stay alert for signs of a local bottom to position for a tactical bounce—but be cautious, as a larger correction likely looms beyond that.
This is no financial advice and for educational purposes only.
#BTC enters neckline resistance zone📊#BTC enters neckline resistance zone⚠️
🧠From a structural perspective, we hit the daily neckline support and began to rebound. Unfortunately, it's about $170 away from the overlapping support zone I'm focused on, and the rebound didn't establish a 1-hour bullish structure. This suggests a high probability of encountering resistance and a pullback after this rebound. Therefore, don't chase the rally at the neckline resistance zone! Only if we can break through the neckline resistance zone and stabilize for a day or so should we actively consider a bullish move.
➡️Support is clearly around 120,000. Even if it falls below this level, as long as the 4-hour closing price is above it, this support level will remain valid. Extreme support is still around 110,000!
🤜If you like my analysis, please like 💖 and share 💬
BITGET:BTCUSDT.P

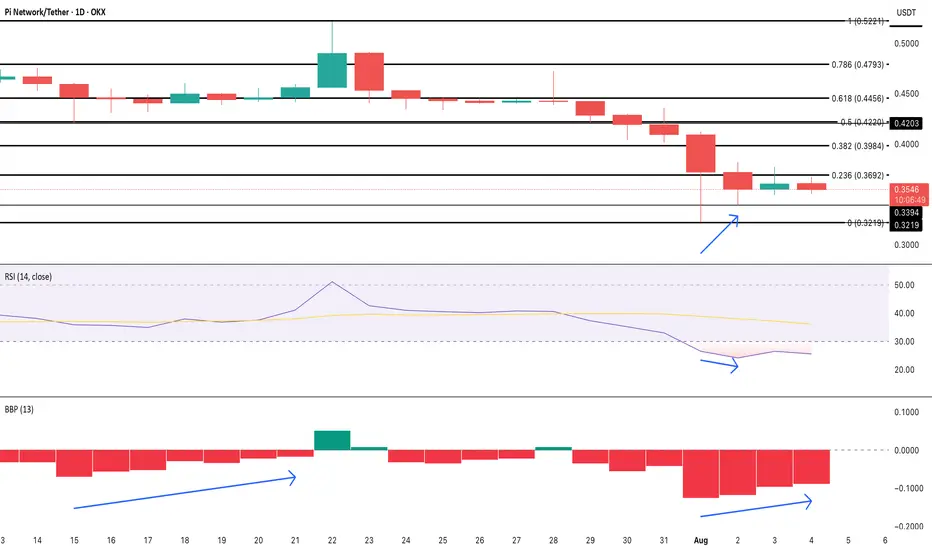
Pi Coin Bulls Whisper Comeback as Bears Ease OffOKX:PIUSDT has been in free fall, losing 25% over the past month and hitting fresh all-time lows. As of now, the OKX:PIUSDT price is holding around $0.35, hovering just above its recent bottom at $0.32. Despite the pressure, there’s a flicker of optimism on the charts.
The first encouraging sign comes from the Bull-Bear Power (BBP) indicator. This tool tracks the strength of bulls vs. bears by comparing price extremes with a moving average. Since August 1, BBP has been rising, flipping from a deeply negative zone to a softer print. That same behavior last occurred in mid-July, just before a bounce from $0.45 to $0.52. It’s not a confirmation, but it’s not nothing.
Backing this up is the RSI (Relative Strength Index), which has formed a hidden bullish divergence on the 4-hour chart. While the RSI dipped lower, price held a higher low; a classic setup that often appears right before continuation moves in an uptrend. RSI is still at 23, deep in oversold territory, but this divergence hints that sellers may be tiring.
There’s a sentiment twist too. OKX:PIUSDT ’s social dominance, its share of overall crypto discussion, has jumped three sessions in a row. This mirrors the chatter spike seen before the last short-term rally, suggesting that market attention is returning at a potentially pivotal moment.
Still, nothing breaks unless the price does. OKX:PIUSDT must close above $0.36 to even test resistance at $0.39. These levels are drawn from the Fibonacci retracement anchored from $0.52 to $0.32. Only above $0.39 can bulls breathe easier. Below $0.32? That invalidates the whole setup and leaves the door open for lower lows.
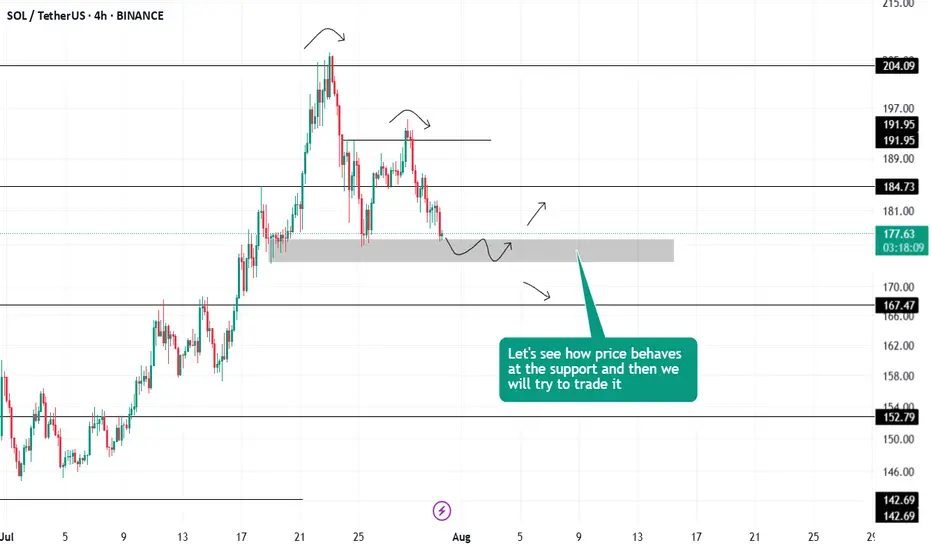
#SOL TRADE IDEASol has now approached an important support level. Let's see how the price behaves at this black zone to make further decision .
Next major support $157
Bitcoin BullishAfter exiting a correction, the first impulse (Wave 1) appears. I expect a retracement of at least 50% of the Fibonacci.

MAGIC Buy/Long Setup (1D)On the chart, an important trigger line has been broken. A strong bullish CH (Change of Character) is also visible on the chart.
The green zone is a low-risk area for a rebuy.
Targets are marked on the chart.
A daily candle close below the invalidation level will invalidate this analysis.
For risk management, please don't forget stop loss and capital management
Comment if you have any questions
Thank You

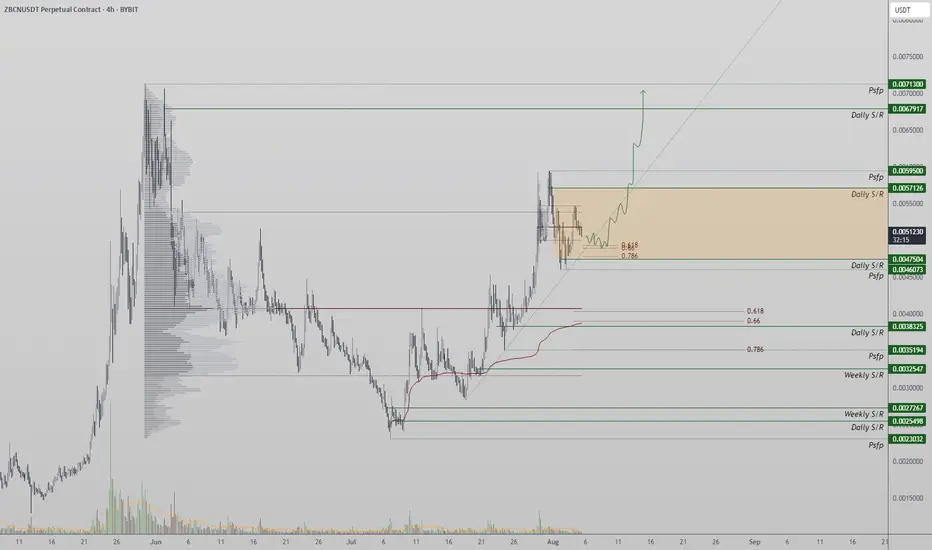
ZBCN Holds Structure at Support as Correction Continues ZBCN is consolidating just above the value area high as it undergoes a corrective phase. Despite the short-term pullback, the broader bullish structure remains intact while key support levels hold.
ZBCN has entered a technical consolidation following its recent rally, pausing near the high of its established value area. This correction is forming a potential equilibrium structure, and whether support holds or breaks will define the next directional move. Traders should be watching the current daily support zone closely, as it may act as the base for the next upward leg if the trend continues.
Key Technical Points:
- Support Zone: Daily SR level with 0.618 Fibonacci confluence
- Key Resistance: Swing high from previous rally
- Failure Point: Below daily support opens downside toward point of control
ZBCN’s price action is currently hovering near the value area high, consolidating in what appears to be a corrective formation. The bullish market structure is still intact, as there has not yet been a decisive breakdown below major support. The correction is forming above the daily support and resistance (SR) level, a key zone with high time frame significance.
This support level is reinforced by the 0.618 Fibonacci retracement, adding a layer of technical confluence to this potential bottoming region. If price maintains this level, it creates a high-probability setup for a bounce toward the previous swing high, which remains a logical upside target.
However, if ZBCN loses this daily level—particularly on an influx of volume—it would mark a structural failure and increase the probability of a deeper corrective move. The next logical downside target would be the point of control, where prior accumulation occurred and where strong historical volume resides. A move toward this area would not invalidate the larger uptrend entirely, but it would shift momentum into a deeper retracement phase.
Maintaining structure above the current support is crucial for bullish continuation. As of now, the uptrend remains valid, and the current movement can be considered a healthy correction as long as support holds. A successful retest of this region could trigger renewed interest from buyers and ignite a move back toward the range high.
If the level fails, however, traders should prepare for a drop toward lower support zones and reassess momentum accordingly. The overall sentiment remains bullish, but that bias is contingent on structure being respected at this stage.
What to Expect in the Coming Price Action
A hold above the daily SR and Fibonacci support could lead to a new rally toward the swing high. If the level fails, watch for a corrective move toward the point of control.
eth sell midterm "🌟 Welcome to Golden Candle! 🌟
We're a team of 📈 passionate traders 📉 who love sharing our 🔍 technical analysis insights 🔎 with the TradingView community. 🌎
Our goal is to provide 💡 valuable perspectives 💡 on market trends and patterns, but 🚫 please note that our analyses are not intended as buy or sell recommendations. 🚫
Instead, they reflect our own 💭 personal attitudes and thoughts. 💭
Follow along and 📚 learn 📚 from our analyses! 📊💡"

Long Hype, Looking for a retracement, we have double bottoms and double tops and then see London and NY trade to Sunday high.


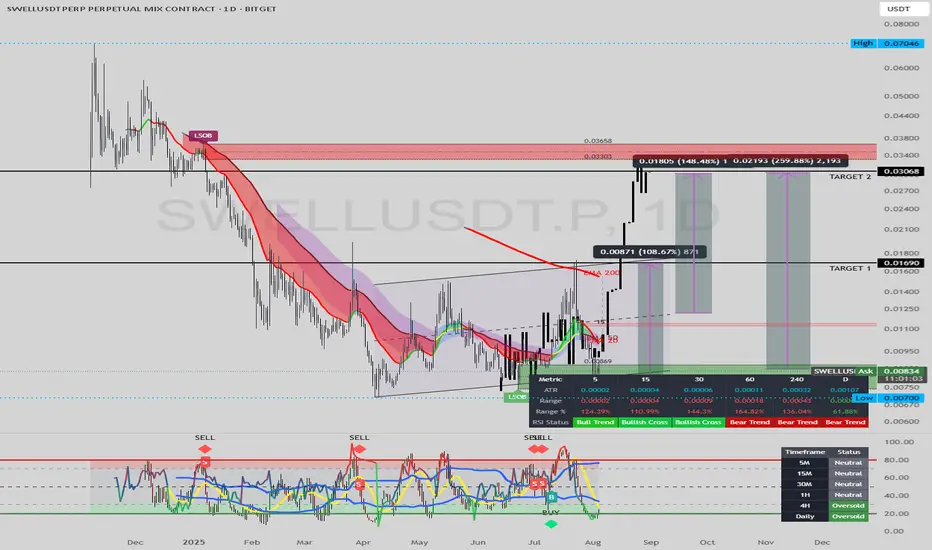
SWELLUSDT: Bullish Reversal in Play, Targeting Higher LevelsFirstly, our Algo-based indicators are used to create this analysis. Follow me so you don't miss, Boost and leave your comments if you profited with our posts, so we may continue:
This daily chart for SWELLUSDT suggests that a bottoming formation has completed, and a new bullish trend is emerging, with significant upside potential.
Analysis:
Market Structure Shift: A key "Bearish Choch" (Change of Character) is indicated on the chart, signaling that the previous downtrend has likely reversed. Since hitting the low at $0.00700, the price has been establishing a series of higher lows, which is a foundational element of a new uptrend.
Accumulation and Support: The price has been consolidating in an ascending channel, finding consistent support along the lower trendline and the EMA 20. This indicates a period of accumulation by buyers.
Indicator Confluence:
The middle indicator (a variant of RSI) is also trending upwards within its own channel, recently bouncing off its support line. This mirrors and confirms the price action.
The bottom Innotrade MC Signal indicator has flashed a "B" (Buy) signal from the oversold territory and is projected to move higher, suggesting building bullish momentum.
Price Projection and Targets: The drawn black line illustrates a potential path for the price. It anticipates a rally from the current support level. The key objectives are:
TARGET 1 : $0.01690. This level represents a significant structural resistance and a break of the previous high.
TARGET 2: $0.03068. This target aligns with a major "FVG" (Fair Value Gap) or price inefficiency, which often acts as a magnet for price.
Strategy:
Position: Long (Buy)
Entry: The current support zone around $0.0080 - $0.0085 is presented as a strategic entry area.
Targets: The primary targets for this bullish move are
0.01690
0.03068.
Conclusion:
With a confirmed market structure shift, strong support from multiple indicators, and clear upside targets, SWELLUSDT presents a compelling bullish setup. The current price level offers an opportunity to enter a potential new uptrend with significant room for growth.
Disclaimer: This analysis is for educational purposes only and should not be considered financial advice. Always conduct your own research and manage risk appropriately.
BRETTUSDT: Bullish Breakout Aims for $0.08 TargetFirstly, our Algo-based indicators are used to create this analysis:
This daily chart for BRETTUSDT suggests a developing bullish scenario following a key technical breakout.
Analysis:
Channel Support: The price is trading within a broad ascending parallel channel. It has recently respected the lower boundary of this channel, finding solid support and bouncing off it, which indicates a potential continuation of the larger uptrend.
Trendline Breakout: A significant descending trendline that was previously acting as resistance has been broken. The price is currently hovering just above this line, which appears to be a classic breakout-and-retest pattern. A successful hold above this line would serve as strong confirmation for further upside.
Indicator Signal: The custom indicator at the bottom of the chart shows the price moving out of the "oversold" territory. The projected path of the indicator is pointing upwards, suggesting building bullish momentum that aligns with the price action.
Price Projection: The drawn red line illustrates a potential path for the price, anticipating a move upwards towards the upper resistance of the ascending channel.
Strategy:
Entry: The current price level (around $0.052) could be considered an entry zone, as it represents a successful retest of the broken trendline.
Target: The primary target for this bullish move is clearly marked between $0.08 and $0.10. This level aligns with the upper boundary of the long-term ascending channel.
Conclusion:
With multiple technical factors pointing in the same direction—a bounce from channel support, a breakout and retest of a key trendline, and a supporting indicator signal—the outlook for BRETTUSDT appears bullish. The next major objective for the bulls is the 0.08−0.10 resistance area.
Disclaimer: This analysis is for educational purposes only and should not be considered financial advice. Always conduct your own research and manage risk appropriately.
