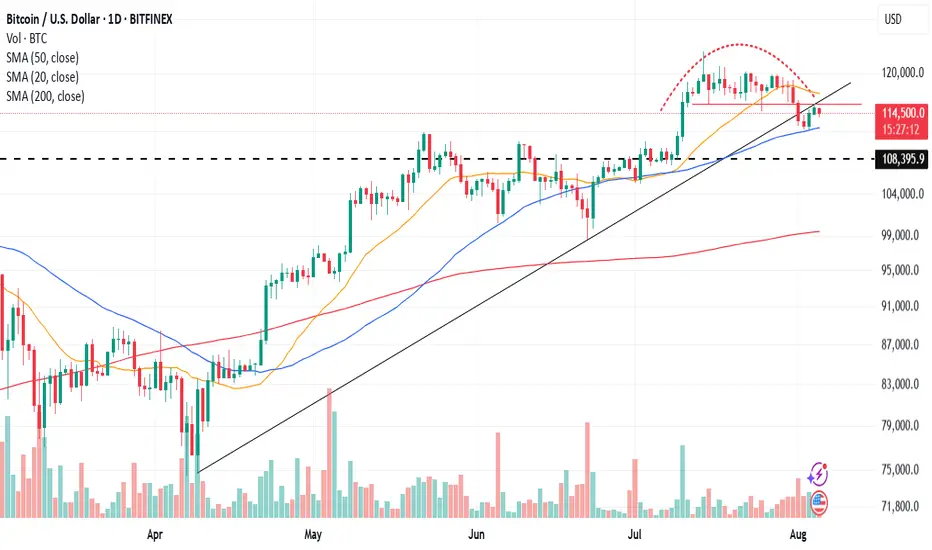
Bitcoin Rounding Top & April's Uptrend Line BreachAs an update to one of my prior ideas. The prior idea had mentioned that what may have appeared to be a bullish pattern on a lower time frame may have been misleading. I had pointed out why on higher time frames. Here is an update:
A Rounding top appears to have formed along with a breach of the April low's uptrend. The breach found support on the 50dma, then snapped back and retested the breached uptrend line. A downward continuation would be the most probable direction for price to trend within this scenario, in my humble opinion.
Crypto market
BTC.DChart Overview (1D TF – BTC Dominance):
1. Pattern in Play: Rising Wedge (Bearish Bias)
The chart shows a rising wedge pattern forming with:
Support line (PA (D)s) in blue, sloping upwards.
Resistance line (PA (D)r) in red, also sloping up, but less steep.
This pattern typically has a bearish outcome, especially when formed during a downtrend as we see post-June.
Price is nearing the apex of the wedge, meaning a breakout (likely down) could be imminent.
2. Key Horizontal Support and Resistance Levels
Support at 60.27%: Price previously bounced from this level—very significant zone.
Resistance at 61.89%: Acting as a key ceiling; price got rejected here recently.
66.03% (Top Black Line): Major macro resistance and the 2025 peak trendline intersects near that level around October.
3. Trendlines and Long-Term Context
Macro Uptrend Support in red intersects around the 61.89%–62% zone in early October. If dominance holds this zone and bounces upward from the rising wedge, this trendline becomes crucial support.
Previous Uptrend Line (purple) was broken significantly in June, which triggered the sharp drop. BTC dominance lost momentum and is now in recovery/decision zone.
Interpretation:
Short-Term Bias: Neutral to Bearish
As price is within a rising wedge post-downtrend, the probability of breakdown is higher.
Failure to break above 61.89% again and maintain momentum suggests downside towards 60.27% or even 58.60%.
Medium-Term Possibility:
If price breaks down from the wedge, support zones are:
60.27%
Then 58.60%
If price breaks up, it will need to reclaim 61.89% cleanly, then test toward 64%–66%.
Macro Trendline Intersection (~Oct 13): Could be a major decision point aligning with fundamental crypto market catalysts. Dominance could break sharply above or below that time depending on broader crypto cycles.

BTC-Stay Sharp. Self RegulateBTC Update
👀All Eyes on These Levels 👇
We’re back in A zone.
The level? 115,727.
This isn’t just any line on the chart — this is the same trendline that flipped from major resistance to support back to resistance on the same date of the infamous #bUCKmOON pump.
📈 If BTC breaks this level with strength and volume — I’m in long.🟢
No volume? No conviction. No entry.
But let’s not get carried away — resistance lurks right above at 117,000 — the former Exhaustion Zone Support now turned resistance.
A classic case of "what once held you up now wants to drag you down."
And if the bulls somehow clear that hurdle?
They'll run headfirst into the Exhaustion Zone Resistance — the real boss fight.
These are stacked walls — one after the other. No easy wins here.
🧠 As a chartist, I’m not here to write about what happens if we break through every ceiling like it’s some fanboy fantasy. That’s not analysis — that’s hopium.
🥂 Yeah yeah but— it’s fun to daydream about all the champagne showers, yacht parties, laser eyes, and the sudden urge to start a DAO that changes the world.
We all picture it.
We all love it.
And sure, when BTC rips through all resistance like butter, we’ll act like we "knew all along."
But anyways — snap back to reality...
There’s another level we can’t ignore:
112,388
👀 Even a 4-hour close below this level?
Just check the chart.
That’s when the bears come storming out of hibernation — angry, hungry, and ready to feast.
🎯Bottom line:
Stay sharp. Self Regulate.
The chart is the map. Discipline is the treasure.

Bitcoin at $117,000?After a deep correction, Bitcoin started an upward trend yesterday and is now at the midline of the 4-hour channel.
The signs suggest that Bitcoin might possibly reach \$117,000.

XRP 1H – Support Ladder Holding Strong Into Supply WallXRP continues to climb the support ladder on the 1H chart, forming a series of higher lows while building pressure against a well-defined supply zone around $3.15–$3.20. Each dip has been bought up quickly, with demand zones flipping into short-term support — a strong bullish signal in the short-term trend.
Momentum remains healthy, with Stoch RSI just turning back up from mid-range, suggesting there's still fuel left if the upper resistance breaks.
🔍 Key Highlights:
– Clear multi-step structure of higher lows and support retests
– $3.15–$3.20 has acted as major rejection twice — third test incoming
– Stoch RSI reset and turning upward = potential continuation
– Break above $3.20 could open up a move toward $3.50+
The key question now: Will bulls finally crack the wall, or will this zone continue to act as a ceiling?
👇 What’s your bias from here — breakout or fade?

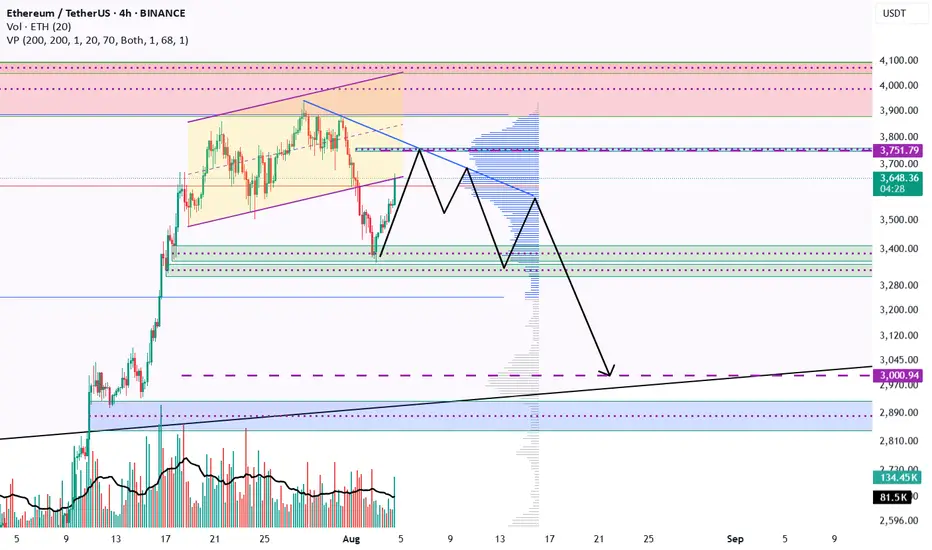
Ethereum Technical Update: $3,750 Target with $3,000 Correction Ethereum could rise to $3,750, and the correction may continue down to $3,000 by the end of August.

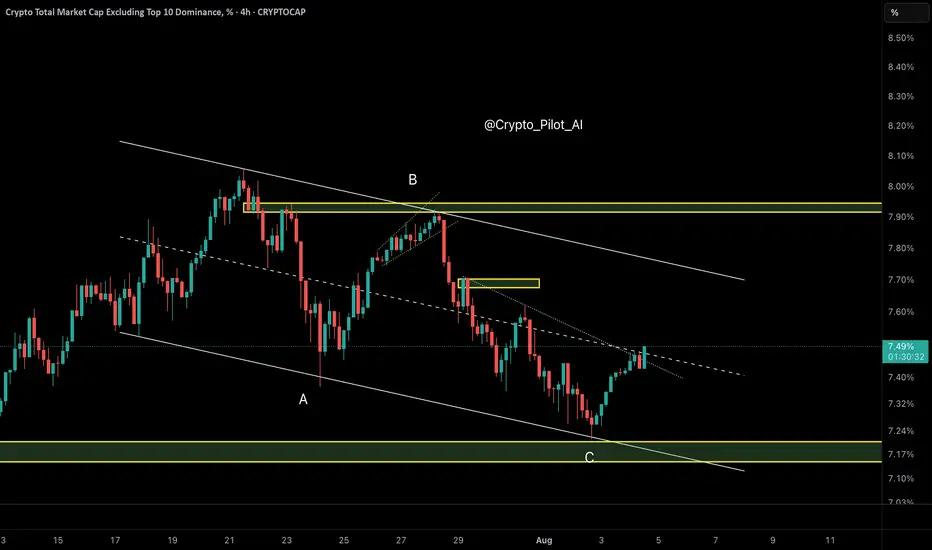
Altcoin Dominance (Others) – Triangle Progress UpdatePrice is likely unfolding a Contracting Triangle after the previous impulsive move. We are currently inside Wave D, which has broken above the midline of the descending channel.
📌 Key Point:
Watch the reaction near the channel top. If rejected, Wave E (final leg down) may follow. A breakout would shift the structure bias.
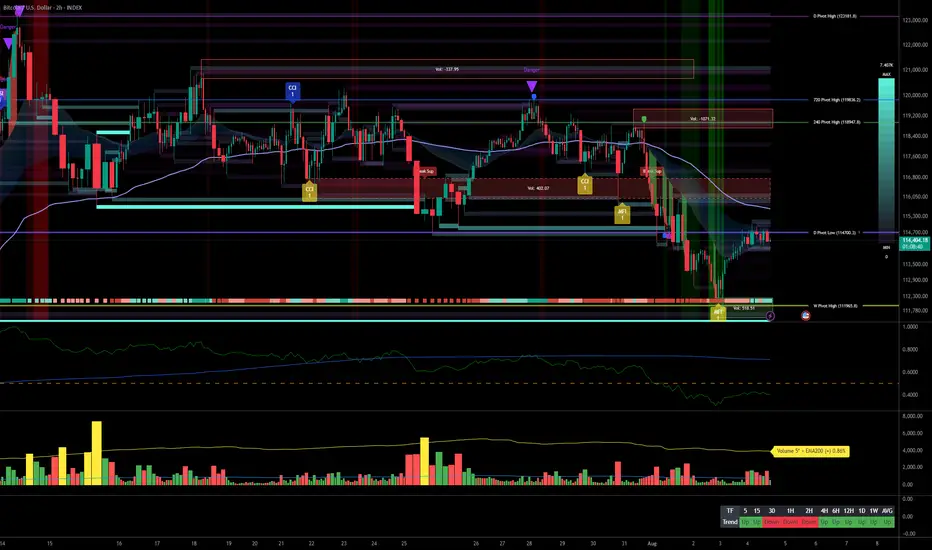
Multi-Timeframe: Range, Accumulation Opportunity on Pullbacks__________________________________________________________________________________
Technical Overview – Summary Points
__________________________________________________________________________________
Overall Momentum: Dominant bullish trend above 4H. Short-term momentum shifts bearish on 2H/1H/30min, warrants caution.
Key Supports: 114,000 USDT (short term), 111,900 USDT (major pivot), 98,200 USDT (structural failure if lost).
Critical Resistances: 115,900 / 118,900 / 119,900 USDT, daily pivot high 122,318 USDT.
Risk On / Risk Off Indicator: Bullish confirmation on most higher timeframes.
ISPD DIV: Behavioural indicators neutral across all frames, no extreme signals (no panic or euphoria).
Volume: Normal overall, with isolated yellow bars signaling recent volatility spikes.
Multi-timeframe: Higher timeframes (1D, 12H, 6H, 4H) remain bullish. Lower timeframes (2H, 1H, 30min, 15min) show short-term downside momentum without systemic panic.
__________________________________________________________________________________
Strategic Summary
__________________________________________________________________________________
Main Bias: Bullish structure so long as 111,900 USDT holds. “Buy-the-dip” on pullbacks, tactical range approach below 115,900 USDT.
Opportunities: Scalping on key supports (113,000–114,000 USDT), accumulation on deep test of 111,900 USDT, adaptive exits at major resistances.
Risks Zones: Clear break of 111,900 USDT opens the way to a deeper corrective move, potentially to 105,000–110,000 USDT.
Macro Catalysts: FED on hold, ETF outflows, ongoing geo/trade war risks, US job stats uncertainties; to be monitored.
Action Plan: Adjust position size to intraday volatility, strict stop-loss below 111,800 USDT, firm monitoring of ETF flows, on-chain trends, and Risk On / Risk Off Indicator .
__________________________________________________________________________________
Multi-Timeframe Analysis
__________________________________________________________________________________
1D - Daily: Bullish trend until 111,900 USDT fails on close. Volume and behaviourals neutral.
12H / 6H / 4H: Range trading dominant. Pivots cluster in 114,700–116,000 USDT.
2H / 1H: Short-term bearish bias (MTFTI Down), increased risk of flush below 113,000 USDT; patience required for exhaustion or seller reversal.
30min / 15min: Volatility up, no behavioural extremes detected. Key watch on breaks below 113,000 USDT.
Risk On / Risk Off Indicator: Confirms bullish bias on higher frames (>4H), momentary loss of bullish momentum on short-term (30min–2H).
Summary: 111,900 USDT is the prime protection node; above = bullish. Below = risk of corrective extension. No current panic detected.
__________________________________________________________________________________
Macro & Bitcoin – Twitter Synthesis & Fundamental Insights
__________________________________________________________________________________
Macro: Mixed global sentiment, ongoing US-China trade tensions, persistent geopolitical volatility, equities and crypto under pressure but no systemic break yet. FED in wait-and-see, next big pivot in September.
BTC: Technical & on-chain accumulation at major supports, ETF outflows by retail but institutional accumulation, significant liquidations but no outright panic.
On-chain: 97% of BTC supply in profit, risk of distribution on overextended rallies, STH cost basis support intact ($105–117k zone).
Strategy: Base scenario = buy deep pullbacks, exit prudently at resistance, monitor ETF flows & macro headlines for tactical adjustment.
__________________________________________________________________________________
Practical Conclusion & Recommendations
__________________________________________________________________________________
Underlying trend remains bullish, extension likely if 111,900 USDT holds.
Monitor: volume/sell capitulation, Risk On / Risk Off Indicator, ETF flows.
Maintain strict risk management, adapt tactics to range volatility.
Avoid excessive leverage, keep tactical intraday flexibility as microstructure is volatile.
__________________________________________________________________________________
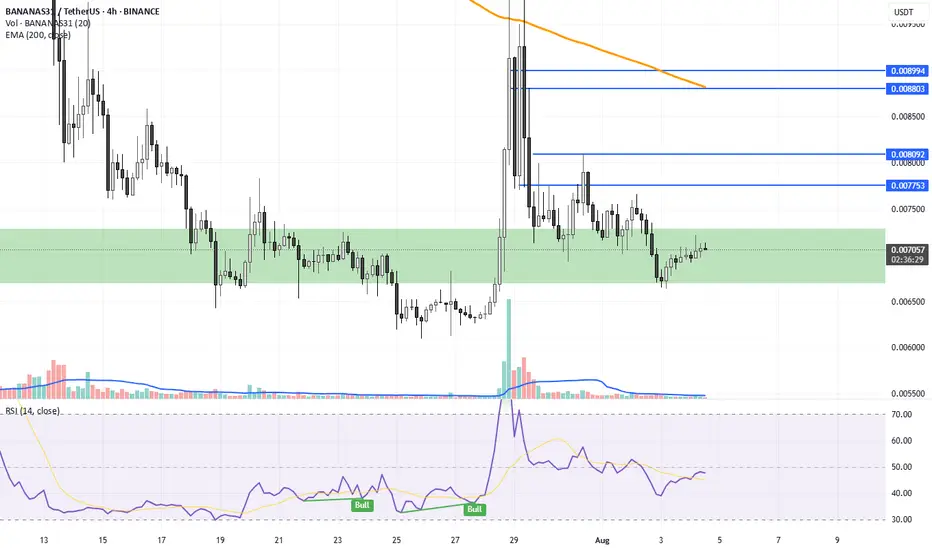
bananas31 usdtBuy area in green box like 0.0067 to 0.0071
Sell area are blue lines
0.0077
0.0080
0.088
0.089
Stop Loss under the Green box
last week it pumps 50% in just 2 days.
Same situation now also.
BTC New Upodate (4H)This analysis is an update of the analysis you see in the "Related publications" section
We previously stated that Bitcoin lacks the strength to move upward, and we expect the price to soon reach the green zone (114K-112K).
The price is now dropping toward this zone, which is the rebuy area.
The process of reaching the green zone has been and still is somewhat time-consuming, and during this time, it may repeatedly mislead beginners.
For risk management, please don't forget stop loss and capital management
Comment if you have any questions
Thank You

#GALA/USDT Sustain the Current Bullish Momentum or Will it Fal#GALA
The price is moving within an ascending channel on the 1-hour frame, adhering well to it, and is poised to break it strongly upwards and retest it.
We have support from the lower boundary of the ascending channel, at 0.01420.
We have a downtrend on the RSI indicator that is about to break and retest, supporting the upside.
There is a key support area (in green) at 0.01392, which represents a strong basis for the upside.
Don't forget one simple thing: ease and capital.
When you reach the first target, save some money and then change your stop-loss order to an entry order.
For inquiries, please leave a comment.
We have a trend of stability above the Moving Average 100.
Entry price: 0.01550
First target: 0.01600
Second target: 0.01658
Third target: 0.01727
Don't forget one simple thing: ease and capital.
When you reach the first target, save some money and then change your stop-loss order to an entry order.
For inquiries, please leave a comment.
Thank you.

ETHUSD – Holding the LineETH is flirting with breakout mode, reclaiming its 200 SMA at $3,477 and pushing to $3,569. RSI is recovering from a dip and regaining upside pressure. Momentum holds above $3,525.

Watch Pudgy Penguins Hold Support, Targeting 0.45 With %28 Hello✌️
Let’s analyze Pudgy Penguin’s price action both technically and fundamentally 📈.
🔍Fundamental analysis:
Pudgy Party is a new game with Web3 features, coming this August. They’re giving away $5K in PENGU tokens to early sign-ups, and your NFT avatar can earn rewards while you play. 🎮
If lots of players join (over 500K), it could boost PENGU’s value and help reduce supply. But if fewer people play (under 100K), the token might just be hype without real support. 🚀
📊Technical analysis:
BINANCE:PENGUUSDT is sitting on a crucial daily support level 📉. Holding this zone could spark a 28% rally toward 0.45 🎯.
✨We put love into every post!
Your support inspires us 💛 Drop a comment we’d love to hear from you! Thanks, Mad Whale

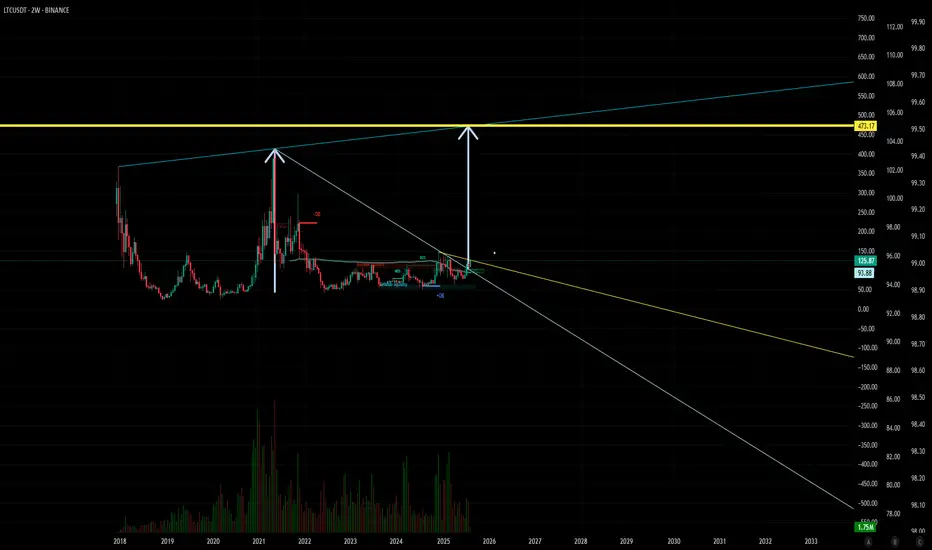
473$$$LTC/USDT Technical Analysis: Bullish Breakout Targeting $473.17
This chart presents a long-term bullish forecast for Litecoin (LTC/USDT) on the 2-week timeframe. The analysis suggests that LTC is on the verge of completing a multi-year consolidation pattern, with a potential for a significant upward price movement.
Key Observations:
Macro Symmetrical Triangle: The chart highlights a massive symmetrical triangle pattern that has been forming for approximately seven years (from 2018 to 2025). This pattern is defined by a descending trendline connecting the major highs and an ascending trendline connecting the major lows, indicating a long period of price contraction and energy accumulation.
Bullish Breakout: The analysis projects a breakout from the upper resistance of this triangle around mid-2025. A breakout from such a long-term consolidation pattern is considered a powerful bullish signal, suggesting the end of the sideways/downtrend and the beginning of a new major rally.
Price Target Activated: The primary target for this bullish move is set at $473.17. This price level corresponds to the historical all-time high of May 2021. After a major pattern breakout, it is common for price to target previous significant highs where "buyside liquidity" is presumed to rest. The text "473 target activated" implies that the breakout event is the trigger that sets this price objective in motion.
In summary, the chart illustrates a scenario where LTC breaks out of a multi-year consolidation, leading to a powerful rally with the ultimate target of reclaiming its previous all-time high of $473.17.
BTC_TRADING IDEA 08/01/25So we had a nice retracement. I’m now patiently waiting in a discount zone, aiming for a MTF LQ.
I have plenty of reasons to wait here:
– FVG
– OB
– OTE
If it doesn’t play out, I’ll look for another PD Array.
Let’s see!

SOLUSDT- Golden Pocket Bounce: Bullish Phase or Another Fakeout?🔍 In-Depth Technical Analysis (1D Timeframe)
The SOL/USDT pair is currently showing a highly significant technical reaction as price bounces from the Fibonacci Retracement 0.5 - 0.618 zone (also known as the Golden Pocket), located between $166.63 - $157.13.
This level also aligns perfectly with a historical demand zone that has previously acted as a strong support during high-volume selloffs, creating a powerful confluence area.
---
🧩 Market Structure & Pattern
✅ Golden Pocket + Demand Zone: This overlap strengthens the probability of a valid bullish reversal.
🟠 Previous Movement: Price dropped from the recent swing high near $188 after failing to break through major resistance.
📉 Short-Term Downtrend: Currently in a corrective phase after an earlier bullish run.
---
🟢 Bullish Scenario (Rebound Confirmed from Golden Pocket)
If the price manages to hold above the $157 - $166 range and prints a bullish candle with volume confirmation:
1. A bullish breakout above $179 and more importantly $187.80 could open the door to further upside.
2. Potential midterm bullish targets:
🎯 Target 1: $205.69 (key psychological + structural level)
🎯 Target 2: $218.13 (previous reaction zone)
🎯 Target 3: $257.10
🎯 Target 4 (macro): $295.14
> The current zone offers an attractive risk-to-reward opportunity for swing traders, as long as the higher low structure is maintained.
---
🔴 Bearish Scenario (Breakdown from Key Support Zone)
Should the price break below $157 with strong selling volume:
1. That would invalidate the bullish setup and suggest a shift in structure.
2. Potential deeper correction targets include:
⚠️ Support 1: $140 (minor support from past structure)
⚠️ Support 2: $122 - $110 (major support zone from March–April 2025)
> A confirmed breakdown here would likely initiate a lower high – lower low structure, signaling a possible shift into a bearish medium-term trend.
---
📌 Additional Key Indicators to Watch
🔄 Volume Spike: Essential for validating any breakout or breakdown.
📉 Daily RSI: If RSI shows bullish divergence or bounces from oversold territory, that would strengthen the bullish case.
⏳ Daily Candle Close: Monitor the next 2–3 daily candle closes around this key zone for directional confirmation.
---
💡 Conclusion
SOL is at a crucial inflection point. The reaction around the $157 - $166 support confluence will likely determine the medium-term trend:
Bullish: If price reclaims $179–$188 zone with strong momentum
Bearish: If price breaks below $157 and closes with volume
This could be a high-reward opportunity for technical traders if confirmed properly.
---
🧠 Suggested Strategy:
🔹 Entry: Upon bullish confirmation in current demand zone
🔹 Stop Loss: Below $155 (for swing setups)
🔹 Take Profit Zones: $179 → $205 → $218 → $257+
#SOLUSDT #Solana #CryptoTechnicalAnalysis #FibonacciLevels #GoldenPocket #PriceAction #CryptoReversal #SwingTradeSetup #Altcoins #CryptoChart

Bearish revrsal?The Ethereum (ETH/USD) is rising towards the pivot and could reverse to the 1st support.
Pivot: 3,760.94
1st Suport: 3,372.83
1st Resistance: 3,936.31
Risk Warning:
Trading Forex and CFDs carries a high level of risk to your capital and you should only trade with money you can afford to lose. Trading Forex and CFDs may not be suitable for all investors, so please ensure that you fully understand the risks involved and seek independent advice if necessary.
Disclaimer:
The above opinions given constitute general market commentary, and do not constitute the opinion or advice of IC Markets or any form of personal or investment advice.
Any opinions, news, research, analyses, prices, other information, or links to third-party sites contained on this website are provided on an "as-is" basis, are intended only to be informative, is not an advice nor a recommendation, nor research, or a record of our trading prices, or an offer of, or solicitation for a transaction in any financial instrument and thus should not be treated as such. The information provided does not involve any specific investment objectives, financial situation and needs of any specific person who may receive it. Please be aware, that past performance is not a reliable indicator of future performance and/or results. Past Performance or Forward-looking scenarios based upon the reasonable beliefs of the third-party provider are not a guarantee of future performance. Actual results may differ materially from those anticipated in forward-looking or past performance statements. IC Markets makes no representation or warranty and assumes no liability as to the accuracy or completeness of the information provided, nor any loss arising from any investment based on a recommendation, forecast or any information supplied by any third-party.

BTC-----Sell around 114500, target 113500-113000 areaAugust 5th BTC Contract Technical Analysis:
Today, the daily chart closed with a small bullish candlestick pattern, with prices remaining high. However, the accompanying indicator forms a death cross. While the broader trend remains bearish, the market is still trending downwards. However, yesterday's significant upward trend suggests a range-bound trend in the short term. Without a continuation of the trend, a significant unilateral move is unlikely. On the hourly chart, yesterday's intraday gains continued in the European and American sessions, but prices failed to break above the previous high. The current candlestick pattern shows consecutive bearish candlesticks, with prices trading below the moving average and the accompanying indicator forming a death cross. Therefore, continued support is crucial for the day, with the strength and potential breakouts of the European session also key.
Today's BTC Short-Term Contract Trading Strategy:
Sell on pullbacks to the 114,500 area, with a stop-loss at 115,000, and a target of 113,500-113,000.

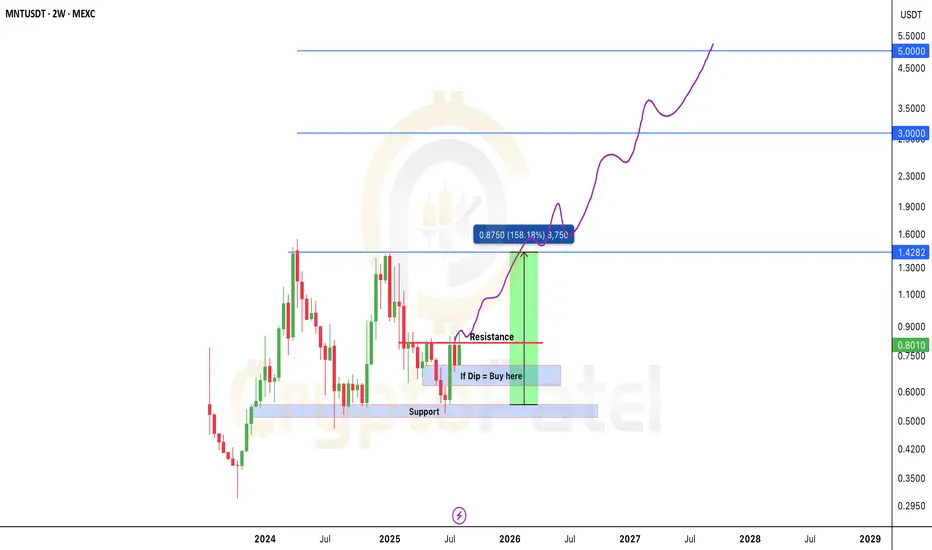
Will MNT/USDT 5x to 10x Potential Post BreakoutTSX:MNT Forming Bullish Structure – 5x to 10x Potential Post Breakout
#MNT is currently trading very close to a major resistance level at $0.82.
We’re waiting for a clean breakout above this zone. Once confirmed, price can potentially deliver a 5x–10x move in the coming days.
If price retraces, the best long-term entry zone would be around $0.70–$0.60 — right inside the accumulation box.
This bull run has strong structural support around $0.55–$0.50. As long as we stay above this zone, we remain highly confident in the upside move toward $5.
Key levels to watch:
Accumulation Zone: $0.60 – $0.70
Resistance: $0.82
Support: $0.50 – $0.55
Bull Run Targets: $1.42 / $3 / $5
NFA & DYOR
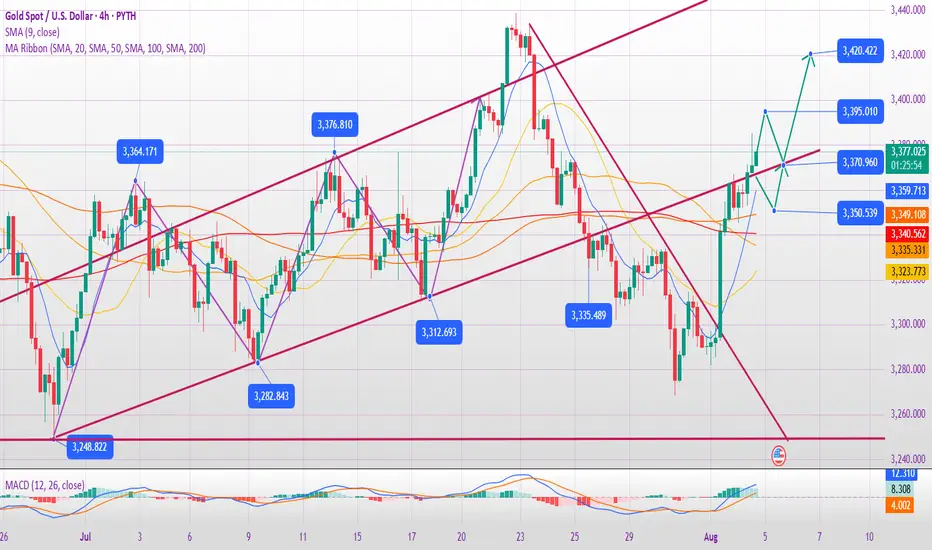
Will gold break through on August 5th?
1. Key News Drivers
✅ Expectations of a Fed Rate Cut Strengthen (Core Logic)
Weak non-farm payroll data (the probability of a September rate cut soars to 90%) leads the market to anticipate two rate cuts this year, with the first likely in September.
The US dollar weakens: expectations of interest rate cuts suppress the US dollar, and the attractiveness of gold as an interest-free asset increases.
✅ Rising risk aversion
Trump's tariff policy has sparked trade concerns, compounded by global economic uncertainty (such as a slowdown in Europe and geopolitical risks).
Fragile market sentiment: If subsequent economic data (such as CPI and retail sales) falls short of expectations, gold could rally further.
⚠️ Risk Warning: If Fed officials signal hawkishness (such as downplaying rate cuts) or if economic data rebounds, gold could experience a short-term correction.
2. Key Technical Signals
📈 Bullish Trend Confirmation Conditions:
A break above $3,375 (previous resistance level) opens up upside potential, with targets between $3,390 and $3,400, or even $3,450. Hold the support of 3335 (bull defense line). If the pullback does not break this level, the trend will remain strong.
📉 Pullback Risk Warning:
If 3335 is broken, a pullback to 3300 (a key psychological barrier) is possible, turning into a volatile market.
4-hour chart is overbought: Be wary of short-term profit-taking after consecutive days of gains.
🔍 Key Levels:
Resistance: 3375 → 3390-3400 → 3450
Support: 3360-3350 → 3335 → 3300
3. Today's Trading Strategy
🎯 Main Strategy: Buy on pullbacks (low-cost buying), supplemented by shorting at key resistance levels.
👉 Long Opportunities:
Conservatives: Enter after a pullback to 3360-3350 and stabilization. Stop loss at 3340, target at 3380-3390.
Aggressive: If it breaks through 3375, go long with a light position, set a stop-loss at 3360, and target 3400.
👉 Short Opportunities:
Short if it first hits the 3390-3400 range and finds resistance, set a stop-loss at 3410, and target 3375-3360.
⚠️ Notes:
Avoid chasing the ups and downs, and wait for key levels to be confirmed.
If it falls below 3335, pause long positions and wait for support at 3300 before repositioning.
4. Medium- to Long-Term Outlook
Bull Market Start Signal: A weekly break above 3400 could confirm the start of the Fed's rate cut cycle.
Potential target: 3500-3600 (historical high area).
Risks: If US economic data improves or the Fed turns hawkish, gold could experience a deep correction to 3200-3150.
Summary
Short-term outlook: 3375 is the dividing line between bulls and bears. If it breaks through, go long; if it hits resistance, trade in a range.
Medium- to long-term: Focus on Fed policy and economic data. Trend-setting long positions should wait for clearer signals.
📌 Action suggestion: Give priority to callback of long orders during the day, strictly set stop-loss, and be wary of high-level shocks and washouts!
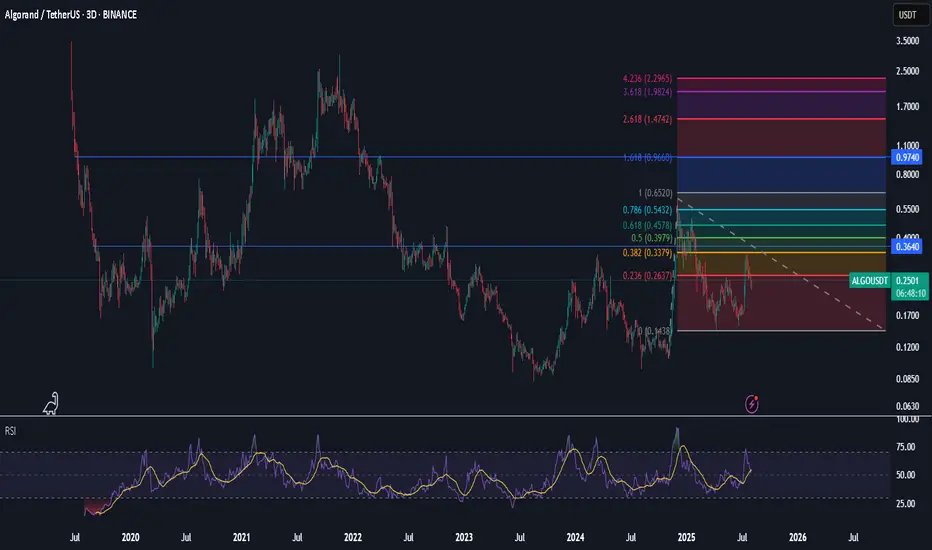
$ALGO above 200 ema on D3 just reclaimed it on H4
recon our large caps run this bubba i recon MJ is waiting to Gat figner
targetting $1 zone buy back on the rejection
for now waiting on 36c reclaim
soon...
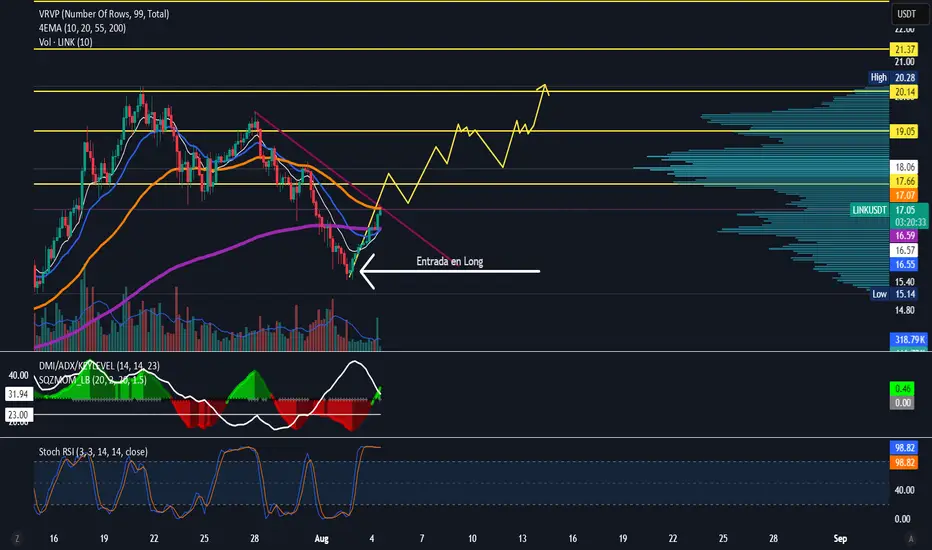
Buyer Setup BuildThere is a buyer setup already created. What to wait? Just some pullbacks, take longs, take profits on high demand zones, and wait for another pullback. This month I could wait for looking some new ATH on some criptos, i doubt a lot than link/usdt can reach yours, but nobody knows. In the meant time, keep waiting