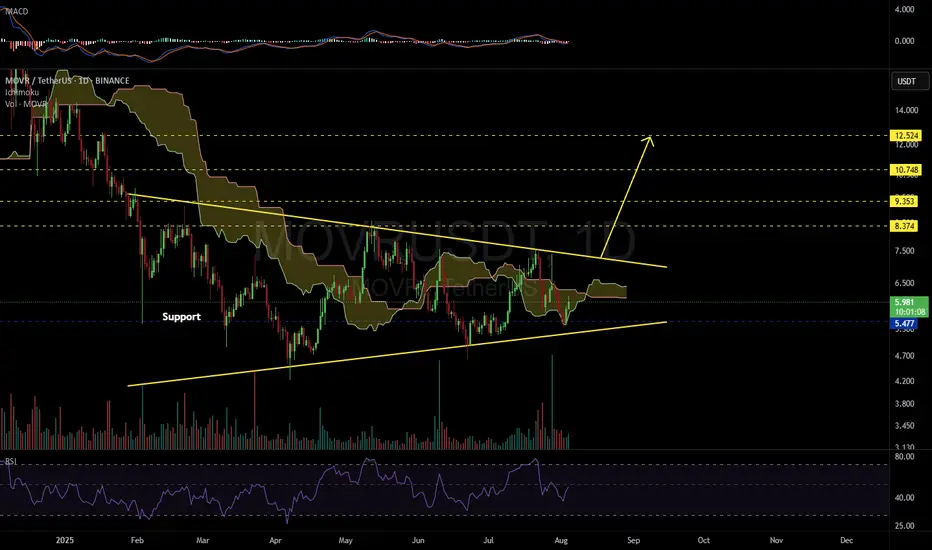
MOVRUSDT 1D#MOVR is moving inside a symmetrical triangle on the daily chart and has recently bounced from the edge of the Ichimoku Cloud — a promising sign of strength.
📌 Consider buying at the current level and near the support zone at $5.477.
In case of a breakout above the triangle resistance, the potential upside targets are:
🎯 $8.374
🎯 $9.353
🎯 $10.748
🎯 $12.524
⚠️ As always, use a tight stop-loss and apply proper risk management.
Crypto market
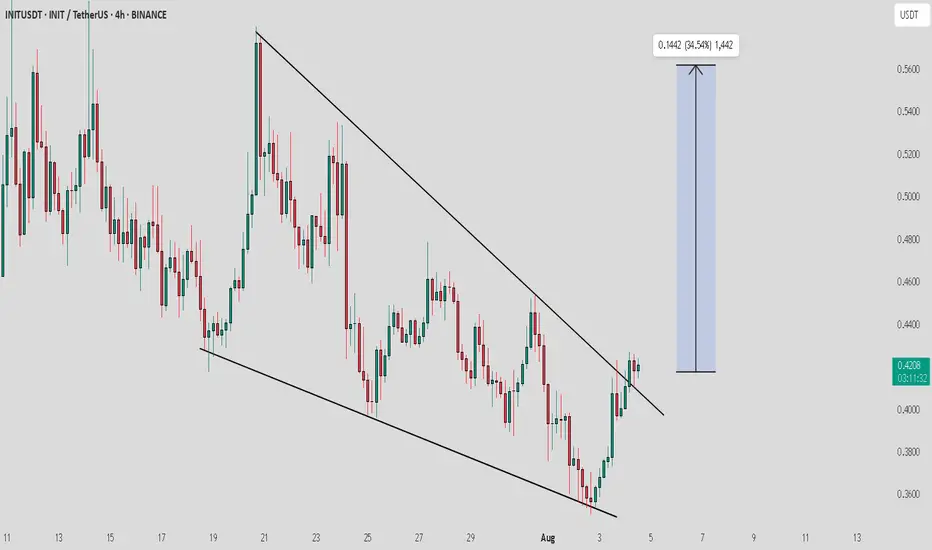
INIT / USDT : Momentum building..Keep a close watchINIT/USDT Breakout Alert
INIT/USDT is showing a strong breakout from a descending channel pattern, signaling a potential bullish move. This setup has great potential, and if the breakout continues, we could see significant upward momentum.
Target: Keep an eye on the next resistance levels, with a move potentially reaching towards $0.5.
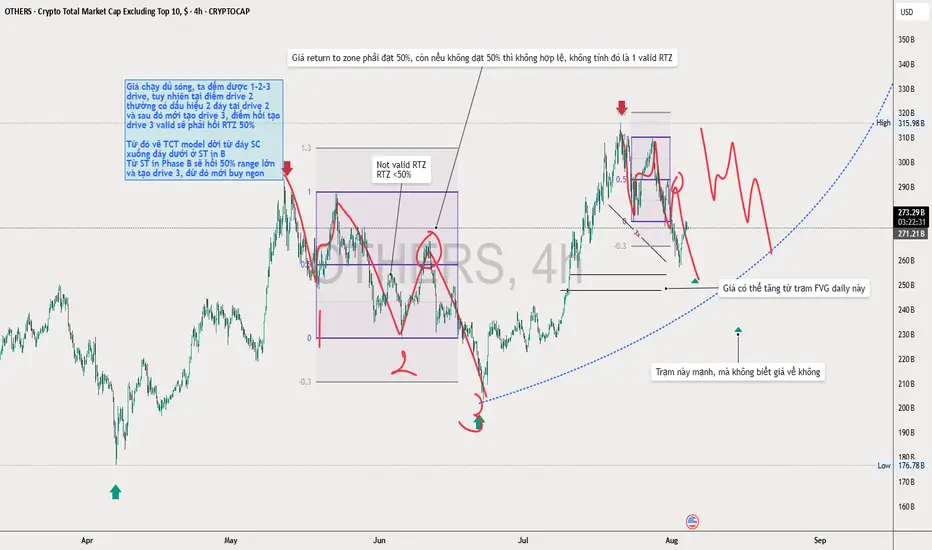
Valid Return to zone TCT modelValid Return to zone TCT model
This indicate the way to valid RTZ swing low
This is Kevin note to show the valid swing count
What to focus on is:
We find 3 drive pattern swing low and trade reversal
At swing low 2, we can see price cannot RTZ 50% and continues to the south and makes liquidity grab, then price return to 50% of the big zone. Here we can sell at drive 3 ( this is as we can see, the low volume swing of NDS, price moves fast to the downside to end the swing)
SHIB Still Faces Pressure Below Parabolic SAR ResistanceSHIB continues to struggle beneath its Parabolic SAR, which has established dynamic resistance above its current price at $0.00001382. This persistent downward positioning below the SAR dots suggests that sellers remain in control, limiting bullish momentum and keeping the asset under pressure in the short term.
The Parabolic SAR indicator tracks potential reversals and trend direction. When the SAR dots appear above the price, it typically signals a bearish trend, while dots below the price suggest bullish momentum.
In SHIB’s case, the indicator’s placement overhead means upward attempts may continue to face resistance unless a strong breakout occurs.
Until SHIB flips this level and closes above the SAR, traders may expect continued consolidation or downward movement.

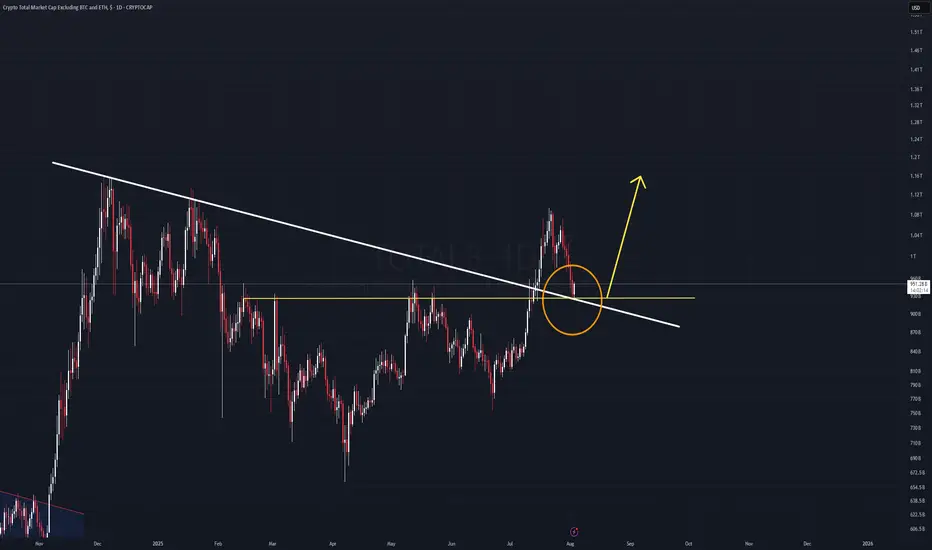
TOTAL 3 Analysis (1D)The TOTAL3 chart is currently retesting a key diagonal trendline that was broken previously. This is a classic bullish retest scenario.
If the current daily candle closes green, and is followed by a strong impulsive candle without invalidation, it could signal the start of a new leg upward, right from this zone.
The $900B market cap level remains the key support.
As long as TOTAL3 holds above this threshold, the bullish bias remains intact.
This structure could lead to momentum across the altcoin market.
BTCUSD long setup: Targeting the next bull move.Hello IGT FOLLOWERS
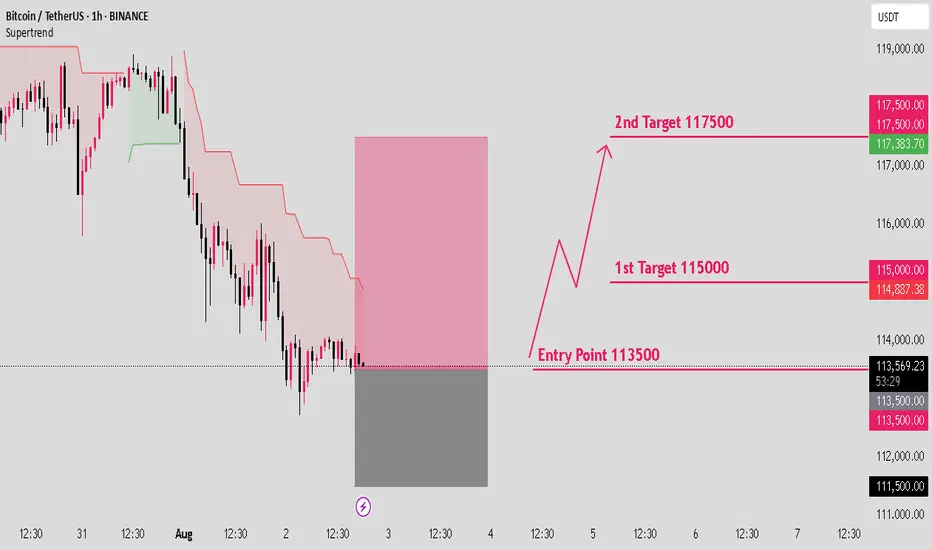
Here is my BTCUSD overview, Bitcoin is showing bullish momentum after holding strong support near $112,000. A breakout above the $115000 resistance suggests buyers are regaining control. RSI is turning upward, and volume is increasing on green candles signaling demand. As long as price holds above $113,000, bulls may push toward the $117,500 target.
Key points :
Entry point : 113500
1st Target : 115000
2nd Target : 117500
Follow me for more latest updates and signals
Doge is a LaggerHello I am the Cafe Trader.
Today we are looking at DOGE.
Normally I refuse to look at "Meme Coins" but with a 33 Billion Dollar Market cap, I don't think it falls into it's own category.
Doge, like many Crypto, have come alive. If this is one you are looking at, here are the Keys:
Short Term
A new seller did prevail as of July 23rd. It's important to note that they are still not in control of this rally. We need to see a key buyer get taken out first. This leads us to the scenario I have drawn.
Green Machine
Big buyers move markets... A lot. They can't buy what they want to buy on the open market without a reaction, so what do they do? Simple
Buy... then wait... then buy again near where they bought before.
So your "Strong buyer" is that area.
You have passive buyers looking to get a good price at 19.223 This would offer the greatest position for a reversal and a continuation.
Long
Entry - .19.250
Stop - .17.050
1st TP .24.050
2nd TP .28.600
Final TP .38.250
This should take at least a month. Be prepared to not look at it everyday.
Long Term
These prices should reflect your sentiment on DOGE.
Aggressive = .20.650
Good Price = .18.900 - 19.250
STEAL = 13.950 - 14.550
Thanks for reading, Don't forget to Boost and Follow !
Happy Trading
@thecafetrader

You Got Liquidated, Whales Used Your Liquidity To Fuel PumpsEver got stopped out right before a massive pump?
Felt like the market dipped just to take your position out?
Maybe it’s time to see whale pullbacks from a different angle...
Hello✌️
Spend 2 minutes ⏰ reading this educational material.
🎯 Analytical Insight on Dogecoin:
BINANCE:DOGEUSDT has breached all key Fibonacci supports and now rests on a critical daily support level. If this holds, a potential 20% upside toward 0.25 becomes likely. 📊🛡️
Now , let's dive into the educational section,
💣 Deep Game of the Market: Pullback or a Setup?
When we hear “pullback” we usually think of a buy opportunity. But is it always that simple? Or are some pullbacks just strategic moves by whales to hunt your liquidity?
Before major bullish moves the market looks for one precious thing: liquidity from over-leveraged poorly placed traders.
💡 How Whales Think 🤔
The biggest mistake retail traders make is assuming the market is fair
It’s not
Sudden pullbacks aren’t random They’re engineered to trigger SLs of over-leveraged traders absorb liquidity and kick off the real bullish move
🧠 Fear and Greed Psychology 😱
Retail trading is powered by two emotions
Fear leads to premature exits and tight stop-losses
Greed causes reckless entries without confirmation
These are exactly what whales feed on The market moves where emotions are strongest and liquidity is highest
🔄 After the Pullback: Time to Pump 🚀
Once the liquidity is taken the real game begins
The pump usually starts from the same level where your SL just got triggered
You’re out they’re in
This is where experience and structure reading come into play
📌 Real Pullback vs Whale Pullback 📉
A real pullback respects structure reacts to known zones and comes with volume confirmation
A whale pullback is usually fast erratic and hits zones that retail traders commonly use for SLs especially without logical support on the chart
🔁 This Pattern Repeats Just Look Back
Take a look at BTC or ETH history
Before almost every major pump there’s been a sharp fast dip that wiped out leveraged longs
Is that a coincidence or a well-crafted liquidity strategy?
🛠 How to Avoid Being Liquidated 🔐
Don’t place SLs in obvious local zones
Use volume-based tools seriously
Wait for multi-layer confirmations such as price action volume and liquidity
Avoid over-leveraging and don’t play the whale’s game
📊 Read Charts Like Maps Not Casinos 🧭
Charts tell you everything but only if you learn the language
Once you understand what whale pullbacks look like you’ll stop being a victim of pumps and start riding them
🧰 TradingView Tools to Catch Whale Pullbacks
Reading fake pullbacks or liquidity grabs isn’t easy with just candles. But TradingView offers a range of tools that act like night vision goggles in this game
🔹 Liquidity Zones Indicators: Tools like Liquidity Swipes or Session High and Low help spot areas where SL hunts are likely
🔹 Volume Profile: Highlights zones with heavy trading activity revealing where whales are likely building up positions
🔹 Relative Volume (RVOL): Spikes in volume during fast drops often signal fake pullbacks and trap setups
🔹 Fair Value Gap (FVG): These imbalanced zones usually get revisited and are prime zones for whale entries
🔹 Heatmaps (external tools): Connected to TradingView these show high liquidity zones which are perfect spots for SL hunts
Combining these tools gives you the edge to trade like a pro not a target
📎 Final Thoughts and Tip
If your SL keeps getting hit before every major move you’re not unlucky you’re playing exactly into their plan
Start using TradingView’s tools learn to read liquidity and always question whether that dip is really a pullback or a trap
✨ Need a little love!
We pour love into every post your support keeps us inspired! 💛 Don’t be shy, we’d love to hear from you on comments. Big thanks , Mad Whale 🐋
📜Please make sure to do your own research before investing, and review the disclaimer provided at the end of each post.

Ethena Poised for 29% Rally Toward Crucial 0.75 Target Hello✌️
Let’s analyze Ethena’s price action both technically and fundamentally 📈.
🔍Fundamental analysis:
Every $1B rise in USDe means more demand for ENA tokens as collateral. With $290M revenue, ENA shows strong, steady growth potential 🚀.
📊Technical analysis:
BINANCE:ENAUSDT is approaching a critical daily support zone that also coincides with a key level on the daily chart 📉. If this support holds firm, we could see a strong 29% rally toward the 0.75 target 🎯. This setup offers a clear risk-reward for traders watching closely.
✨We put love into every post!
Your support inspires us 💛 Drop a comment we’d love to hear from you! Thanks, Mad Whale

Potential BITCOIN HUGE BEARISH PATTERN PRINTING OUT It certainly fits from my perspective. A nice overdue correction that fits its approximate prior trough corrective range level. As above so below. In Nov 2022 the classical TA bottom pattern was an inverted head & shoulders.

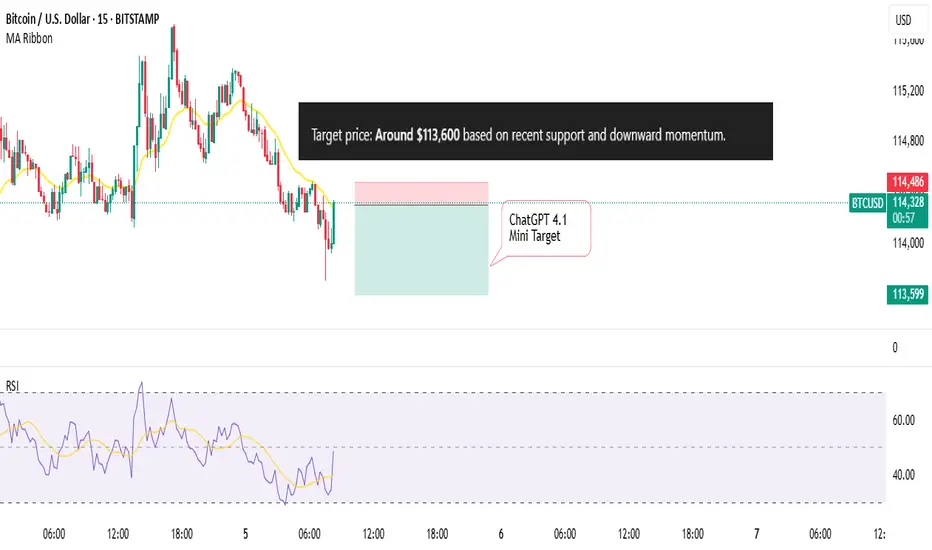
I asked ChatGPT to predict Bitcoin PriceAlso, I asked Grok to choose 2 indicators and then predict the next Move of
BITSTAMP:BTCUSD
We'll check back soon
BTCUSDT – Ascending Triangle Completing the Path!📊 Bitcoin is currently forming an ascending triangle, clearly marked in bold red.
This zone is showing high volatility and provides great Buy/Sell opportunities for traders. 🔄
📈 If the price breaks out above the resistance line, we can expect a strong bullish move, following the path highlighted in blue polyline, with potential to reach the long-term target of 🔹 1.4 million USDT. 🚀
📌 If you listen closely, this chart’s basically yelling: “Something’s coming...” 🎧👀
🧭 Next move will define the trend — don’t blink.

$Btc Bounce Signal is Locking in on the $108.5k Golden Pocket Bitcoin recently formed a higher low around the $111,600 level, which is an important structure to watch. This setup is still bearish in nature because if BTC loses this $111.6K support, it will confirm a deeper bearish trend taking hold. Right now, BTC is pulling back after being rejected at $115,000 and heading towards this crucial $111.6K zone.
If this support holds, we might see some relief or a bounce. But if it breaks, the next key area is the Fibonacci Golden Pocket between $107,000 and $108,000 — a critical level where bulls often try to defend. Failure to hold even the Golden Pocket would strengthen the bearish outlook further.
BTC is at a decisive point, and traders should closely watch how price behaves around these levels to understand if a recovery or a deeper drop is on the cards.

DOGEUSD Long Setup – Bounce from Strong Demand ZoneDogecoin is currently showing signs of a potential bullish bounce off a major demand zone (green area between $0.18049 – $0.19795). This zone previously served as a launchpad for the previous rally and is structurally significant for Smart Money participants.
🔑 Key Levels:
🟩 Demand Zone (POI): $0.18049 – $0.19795
🔵 First Resistance (TP1): $0.23329
🔵 Second Resistance (TP2): $0.27070
🔴 Current Price: $0.20494
📌 Smart Money Concept (SMC) Notes:
Break of Structure (BOS): Happened after the bullish rally from this same green zone.
Return to Discount: Price has now retraced into a discount level within the original demand zone.
Liquidity Grab: Sell-side liquidity likely swept from previous lows before showing signs of bullish intent.
🛠️ Trade Plan:
Entry: Inside the green zone upon bullish confirmation
Stop Loss: Below $0.18049 (structure break)
TP1: $0.23329
TP2: $0.27070
🔮 Forecast:
If buyers step in around the demand zone, DOGEUSD may begin a bullish impulse wave, targeting the upper resistance zones and potentially forming a new higher high.
🛑 Disclaimer:
This is not financial advice. For educational purposes only. Use proper risk management.
📎 Hashtags:
#DOGEUSD #Dogecoin #CryptoAnalysis #SmartMoney #PriceAction #OrderBlock #BOS #DemandZone #FrankFx14 #TradingView

2009-2025 Elliott Wave: BitcoinBitcoin is a decentralized digital currency, without a central bank or single administrator, that can be sent from user to user on the peer-to-peer bitcoin network without the need for intermediaries. Transactions are verified by network nodes through cryptography and recorded in a public distributed ledger called a blockchain. The cryptocurrency was invented in 2008 by an unknown person or group of people using the name Satoshi Nakamoto. The currency began use in 2009 when its implementation was released as open-source software.

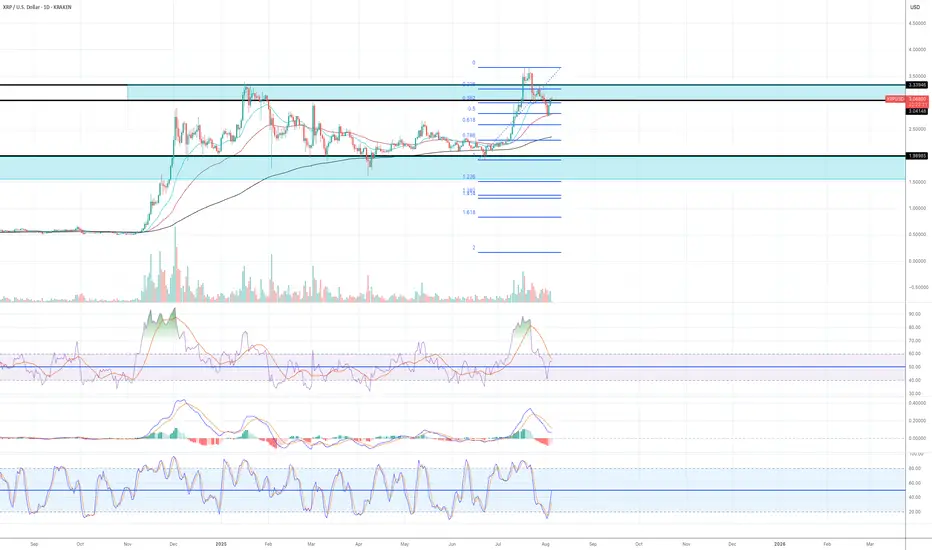
Working to move to the upsideMy views on XRP still hasn't change since my last article. The price action has been quite volatile, but if you look at it in the higher time frames such as monthly/weekly/daily, I think XRP is still working to move to the upside.
Daily:
1) The price has found the temporary support at Fib 0.5 level and EMA55.
2) yesterday's daily candle closed above $3.07 area (previous major resistance area)
3) Both RSI and MACD are still in the bull zone.
4) Stochastic has reached the oversold territory the lines have crossed and now are moving to the upside.
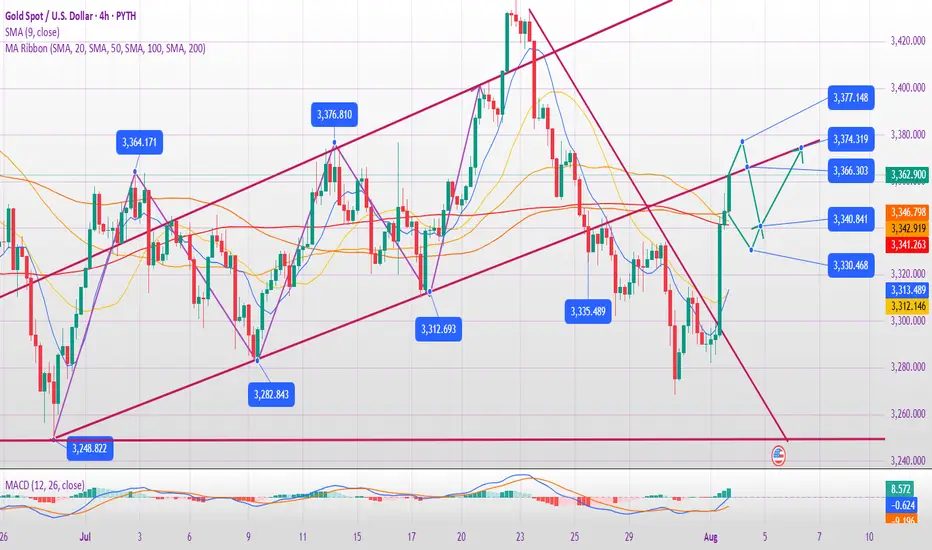
In-depth Analysis of the Gold Bull-Bear Game on August 4th:
I. Gold's Current Core Contradiction
Bull Support Factors
Weak non-farm payroll data reinforces expectations of a Fed rate cut, with the market betting on an over 80% probability of a September rate cut.
Risk Aversion: Although the tariff extension has not yet been finalized, the market remains concerned about escalating trade frictions, and gold is in high demand as a safe-haven asset.
Technical Breakout: Friday saw a strong breakout above the 3340-3350 resistance zone, with the daily chart showing a positive enveloping negative trend. Short-term bullish momentum prevails.
Potential Short-Term Opportunities
Monthly Top Signal: Consecutive high-level doji candlesticks with long upper shadows suggest medium-term selling pressure.
Fundamental Bearish Hidden Dangers:
The Fed's independence remains, and Powell may not cut interest rates prematurely due to pressure from Trump.
II. Key Technical Signals
1. Weekly Level: Range Unbroken
The 3268-3438 range persists, currently nearing its upper limit, so be wary of a pullback.
Bollinger Bands are converging, with the MA5/MA10 convergence signaling an approaching market reversal window.
2. Daily and short-term cycles: Overbought correction needs
After Friday's surge: 4-hour/1-hour RSI is overbought, the Bollinger Band opening is unsustainable, and a technical retracement is needed.
Key positions:
Resistance: 3376 (previous high) + 3385 (Fibonacci expansion level);
Support: 3340 (top and bottom conversion) + 3315 (bull defense line).
3. Triangle convergence pattern:
If it opens high and breaks through 3376 on Monday, August 4, it may test 3400; if it opens low and falls below 3340, it will look down to 3315-3280.
III. Operation strategy for next week on August 4
(1) Response to three opening scenarios
Scenario 1: Opening high (above 3370)
Strategy: Short in batches in the 3376-3385 area, stop loss at 3400, target 3340→3315.
Logic: Positive overdraft + technical overbought, betting on a pullback.
Scenario 2: Flat opening (around 3360)
Strategy: If the price rises from 3366 but does not break through, go short with a light position, stop loss at 3376, target 3340; if it falls below 3340, go short and look at 3315.
Alternative: If the support at 3340 is effective, go long, stop loss at 3330, target 3360.
Scenario 3: Low opening (below 3340)
Strategy: Go long in the 3338-3340 area, stop loss at 3325, target 3360; if it breaks through 3315, go short.
(2) Mid-term layout
Short opportunity: Go short in the 3385-3400 area, stop loss at 3420, target 3245 (monthly support).
Buy opportunity: If the price falls back to 3315-3280 at the beginning of the week and stabilizes, go long in the mid-term, stop loss at 3260, target 3400.
IV. Risks and Warnings
Beware of institutional manipulation: Friday's late-day surge may be a trap for buying; beware of a flash crash at Monday's opening.
Data disturbance: Pay close attention to the speeches of Fed officials. If inflation rebounds or hawkish remarks are made, it will be bearish for gold.
Undetermined trend: The market is still volatile and unilateral trends need to wait for confirmation of a breakthrough in the range.
Conclusion
Short-term: Prioritize shorting in the 3370-3385 area, and enter long positions in the 3340-3315 area when appropriate, maintaining strict stop-loss orders.
Mid-term: The monthly bearish pattern has not changed, and above 3385 is the ideal entry point for short positions.
Key Strategies: "Don't chase long positions during strong resistance; don't sell short during deep declines; follow the trend after a breakout; exercise caution in controlling the market."
EthusdHonestly probably marks up very heavily soon...
We are entering etf bid war phase of the cycle.
Can't even really draw how vertical this chart could go as certain macro economic conditions seem to be brewing...
15k is the predicted target of certain large tradfi firms that are accumulating, bitmine for example.
They are basing their targets from the success of the circle internet groups public listing as well as fundamental factors such as JPMorgan and other institutions launching their own stable coins on ethereum...
Multiple companies rushing to accumulate 5% of the supply while predictions of a 75bps rate cut from the fed are starting to brew...
Supply shock combined with inflationary event aswell as eths successful merge earlier this year are incredibly bullish catalysts and we aren't even at the ath valuations seen last cycle.

Bullish ETH!!!My inverse head and shoulder pattern played out close to perfect, as seen in pic.
Recent bullish move also, made perfect move to downside, with rsi at rock bottom and hitting target perfectly, I say the next bullish move woll break out and hit the new target as seen in pic.
Come on eth!!!

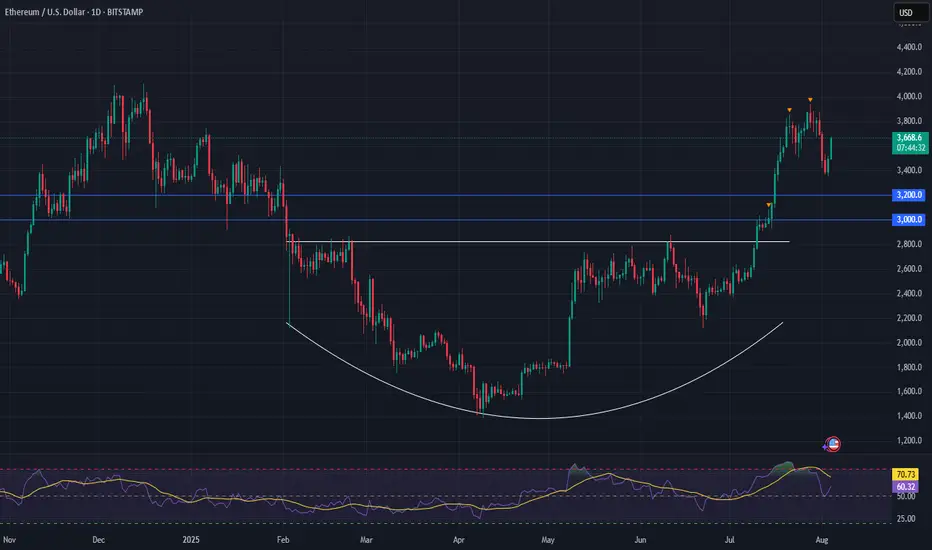
Ethereum (ETH) is setting up for a powerful moveFollowing a strong breakout, ETH has entered a healthy consolidation phase—setting the stage for its next leg higher.
Momentum remains firmly on the bulls’ side, with the breakout from a long-term saucer pattern fueling continued upside pressure.
📈 Technical Highlights:
✅ Short-term target: $4,000+ (breakout continuation)
✅ Long-term potential: $7,000+
🛡️ Key support: $3,000–$3,200 (bullish as long as this holds)
📣 Takeaway:
Ethereum is showing classic bullish structure. With higher-lows forming and strong support below, pullbacks are likely to offer high-probability entries for both traders and long-term holders.
#Ethereum #ETHUSD #Crypto #Trading #TechnicalAnalysis #CryptoTrading #EthereumPrice #Altcoins #Bullish #Breakout
Bitcoin fixed above the $112k ┆ HolderStatOKX:BTCUSDT is recovering after touching the $111,940 zone, now confirmed as strong support. The price is reversing from the lower wedge boundary, suggesting renewed momentum. A clean push could retarget $122,250 in coming sessions.

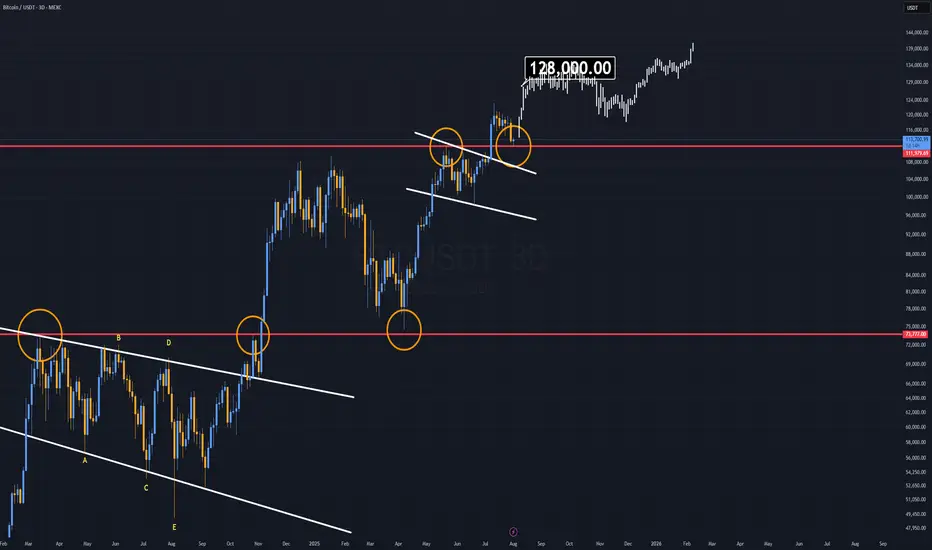
Bitcoin Analysis (3D)Bitcoin is currently trading in a very specific zone that resembles a classic bull flag continuation pattern, similar to the one we saw during last year’s rally.
Back then, a slow-forming bull flag broke to the upside, pushed to new all-time highs, and then retested the top of the same flag before continuing higher.
Now, we are witnessing a similar setup, but this time the formation has developed much faster.
The key difference:
While last year’s bull flag took a longer time to mature, the current one is more compressed, indicating a potentially sharper move if confirmed.
The $108K daily level is critical.
As long as Bitcoin remains above this level, the structure favors a new rally.
This could be the start of another impulsive leg, targeting the $128K Area.
CVX/USDT: Long-Term Breakout Signals Massive Upside PotentialFirstly, our Algo-based indicators are used to create this analysis: DON'T MISS US. FOLLOW US, COMMENT AND BOOST.
This weekly chart for CVX/USDT reveals a major bullish breakout from a long-term pattern, suggesting that the asset may be in the early stages of a significant new uptrend.
Analysis:
Descending Channel Breakout: For over two years, CVX has been trading within a clear descending channel. Recently, the price has decisively broken out of this channel to the upside, signaling a major shift from a bearish to a bullish market structure.
Pullback and Reentry: Following the initial powerful breakout, the price executed a healthy pullback. It found support right around the key 50% Fibonacci retracement level (approximately $4.262). The chart notes this area as a potential "REENTRY" point, especially with the formation of a "W-Pattern" (double bottom) on a smaller timeframe, which is a classic bullish reversal signal.
Confirmation Indicators:
The Innotrade MC Signal indicator at the bottom shows multiple "BUY" signals in the recent accumulation zone and the indicator line is now trending upwards, suggesting building momentum.
The RSI status confirms a "Bull Trend" on the daily and weekly timeframes, supporting a long-term bullish outlook.
Price Targets: Based on Fibonacci extension levels from the recent major swing, several targets are identified:
TP 1: $12.243 (aligns with the 127.20% extension and a previous key resistance level).
TP 2: $19.726 (aligns with the 161.80% extension).
Long-Term Projection: The aggressive black line projects a potential move towards the 2022 highs, indicating massive long-term potential if the bullish momentum continues.
Strategy:
Position: Long (Buy)
Entry: The current price level around $4.30 - $5.00 is highlighted as a strategic reentry zone following the successful pullback.
Targets: The primary targets are
12.243
∗
∗
a
n
d
∗
∗
12.243∗∗and∗∗
19.726.
Conclusion:
The breakout from a multi-year descending channel, combined with a successful retest of key support and confirming indicator signals, presents a compelling long-term bullish case for CVX. The current price level offers a strategic entry for a potential multi-hundred percent move towards the identified price targets.
Disclaimer: This analysis is for educational purposes only and should not be considered financial advice. Always conduct your own research and manage risk appropriately.
