ALICE/USDT – Will It Rebound from Demand Zone or Break Down?🧭 Analysis Summary:
ALICE is at a critical turning point, once again testing a historical demand zone that has provided strong support since Q2 2025. The current price action suggests potential accumulation, setting the stage for a significant move — either a powerful bounce or a devastating breakdown.
---
📌 Chart Details (Daily Timeframe):
Main Trend: Still in a macro downtrend since December 2024
Current Price: $0.3714
Key Demand Zone: $0.35 – $0.41 (highlighted yellow box)
Nearest Supports: $0.35 → $0.3102 (2025 low)
Layered Resistance Levels: $0.4786 → $0.5672 → $0.6481 → $0.7986 → $0.9754
---
🧱 Market Structure & Patterns:
Price has been consolidating in a tight range over recent weeks — indicating possible accumulation or distribution.
The long-standing descending channel shows signs of exhaustion, with repeated rejections from the demand zone.
A small double bottom pattern appears to be forming, suggesting a possible reversal if validated.
---
📈 Bullish Scenario – Reversal Potential on Confirmation:
✅ If the price holds above $0.35 and forms a higher low, a trend reversal could take shape.
✅ A breakout above $0.41 would act as the first bullish confirmation.
🎯 Upside Targets:
$0.4786 → minor resistance, good for short-term swing trades
$0.5672 – $0.6481 → mid-range resistance & Fibonacci levels
$0.7986 – $0.9754 → longer-term recovery zone if sentiment improves
💡 Stronger confirmation would come from increasing volume and Daily RSI crossing above 50.
---
📉 Bearish Scenario – Breakdown and Trend Continuation:
❌ A breakdown below $0.35 would likely push price toward the $0.3102 support — the lowest level of the year.
❌ If $0.31 fails, further downside toward $0.25 or even $0.20 is possible, due to a lack of nearby historical support.
💀 This would confirm the continuation of the major downtrend, signaling sellers still have control.
---
📊 Market Sentiment:
On a broader scale, altcoins are still under pressure amid regulatory uncertainty and declining DeFi activity.
However, ALICE’s demand zone remains a high-interest area for traders seeking mid-term accumulation opportunities.
---
🎯 Strategy Ideas:
Strategy Type Action Key Levels
Buy on Breakout Enter on confirmed breakout > $0.41 Target: $0.48 – $0.64
Sell on Breakdown Short below $0.35 Target: $0.31 or lower
Range Trade Buy low, sell high between $0.35–$0.41 Tight stop-loss recommended
---
📝 Conclusion:
ALICE/USDT is at a technical and psychological crossroads. This yellow zone is where big moves often begin — the question is, will bulls take control or will bears pull it deeper? All eyes should be on how price reacts to this demand area.
#ALICEUSDT #CryptoTA #AltcoinAnalysis #DemandZone #BreakoutOrBreakdown #PriceAction #VolumeAnalysis #CryptoReversal #SwingTradeSetup #ALICEAnalysis #CryptoTrend
Crypto market


FUN / USDT : Breaking out from Trendline resistance FUN/USDT Breakout Setup
FUN/USDT is currently breaking out from its trendline resistance, signaling a potential bullish move with strong momentum. The chart shows significant upward potential, and we’re expecting a nice move towards $0.015 in the coming hours/days.
Key Point: Keep a close watch for confirmation of the breakout. If the trend holds, this could lead to a substantial rally.

#SOLUSDT: A Big Move In Making Crypto Market Is BullishCrypto market remain bullish and as for the SOLANA we remain quite optimistic; currently price is trading at critical level and waiting for liquidity to emerge. We need strong volume for big price movement. Follow a strict risk management while trading crypto market.
Good luck and trade safe.
Team Setupsfx
VINE Long to 200EMA. - 7x7x
Entry $0.06804
SL $0.06363 - Is on trend line near the low from this weeks sell off
Target $0.082 is 200EMA - Sell 50%
2nd target $0.090 - Sell All
Entry is just below 25EMA
Risk 6/10

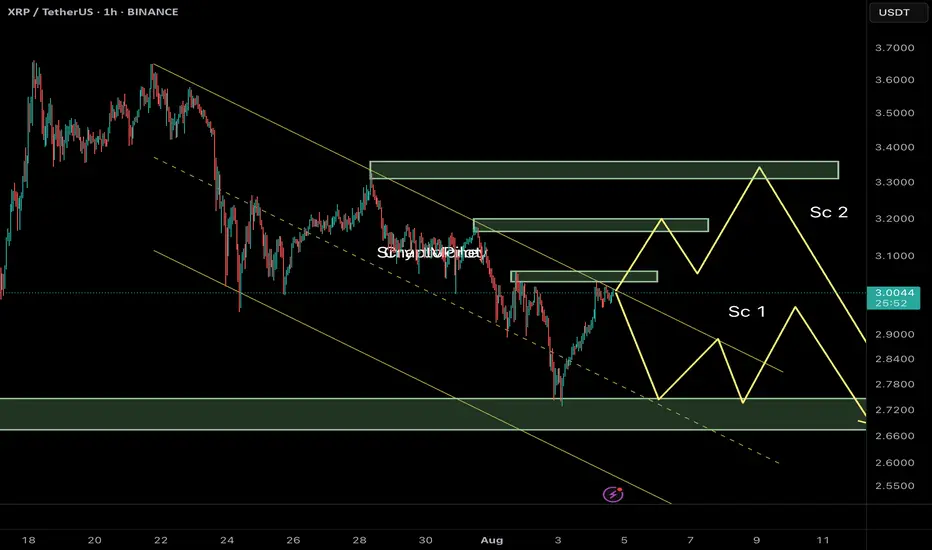
Ripple (XRP/USDT) Technical Analysis – 1H Timeframe🔰 Current Market Context:
After breaking below the ascending channel near $3.50, XRP has entered a corrective phase within a descending channel. Price is now hovering around a mid-range resistance zone, and we can outline two key potential scenarios from here:
⸻
📌 Scenario 1 (Sc1) – Immediate Rejection and Bearish Continuation
In this case:
• Price gets rejected from the current resistance zone ($3.05–$3.10).
• A quick corrective pattern (likely a Zigzag or Flat) plays out.
• XRP moves down to test the next demand zone near $2.70–$2.65, breaking below recent swing lows.
✅ This scenario aligns with the current weak structure and visible sell-side pressure. Liquidity above recent highs has likely been swept, creating a setup for continuation downward.
⸻
📌 Scenario 2 (Sc2) – Extended Correction with a Final Bull Trap
In this case:
• Price pushes higher toward a deeper resistance zone near $3.30–$3.40.
• A liquidity grab above the prior highs triggers a sharper reversal afterward.
• The overall structure could form a Diametric or Complex Correction, suggesting a deeper and more time-consuming wave before resuming the bearish trend.
⛔ This scenario requires strength and acceptance above $3.15, and should be treated as an alternative unless proven by price action.
⸻
🎯 Summary & Trade Strategy:
Scenario 1 is currently more probable unless we see a strong break and close above $3.10. Expectation: XRP may head toward the $2.70–$2.65 demand zone if resistance holds.
⚠️ Avoid entering early. Wait for confirmation via internal BOS (Break of Structure), bearish engulfing near OB zones, or signs of rejection with volume at resistance.
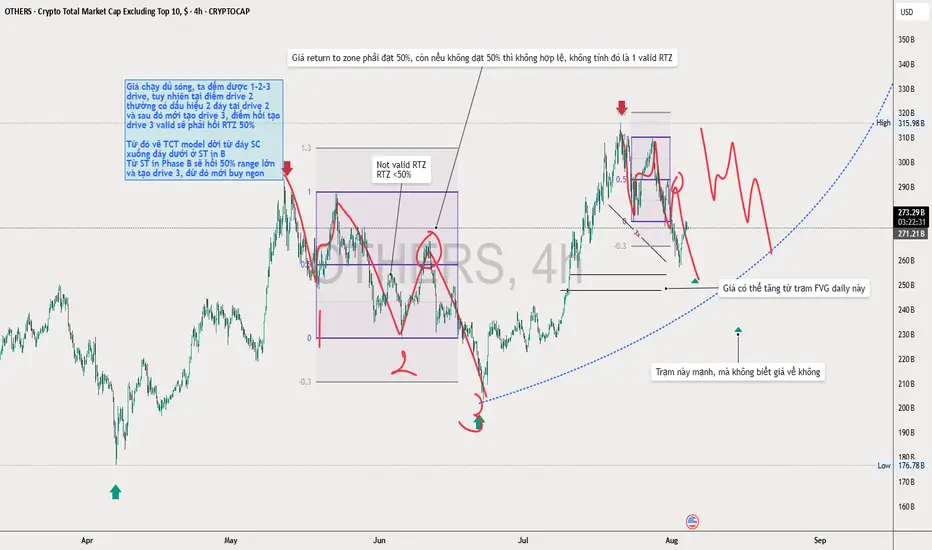
Valid Return to zone TCT modelValid Return to zone TCT model
This indicate the way to valid RTZ swing low
This is Kevin note to show the valid swing count
What to focus on is:
We find 3 drive pattern swing low and trade reversal
At swing low 2, we can see price cannot RTZ 50% and continues to the south and makes liquidity grab, then price return to 50% of the big zone. Here we can sell at drive 3 ( this is as we can see, the low volume swing of NDS, price moves fast to the downside to end the swing)
others \ btcOthers bitcoin pair has found support from the rising trend line since 2016 2017 and continues to recover

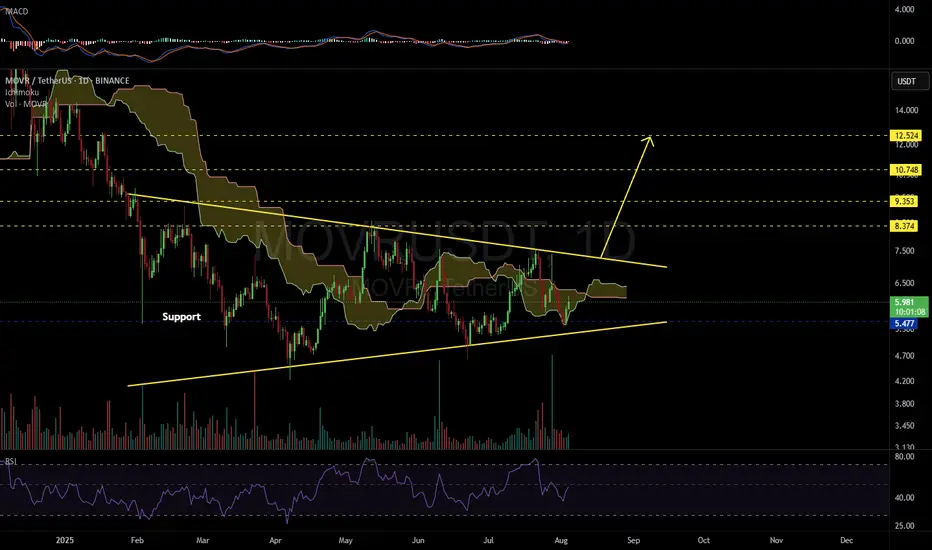
MOVRUSDT 1D#MOVR is moving inside a symmetrical triangle on the daily chart and has recently bounced from the edge of the Ichimoku Cloud — a promising sign of strength.
📌 Consider buying at the current level and near the support zone at $5.477.
In case of a breakout above the triangle resistance, the potential upside targets are:
🎯 $8.374
🎯 $9.353
🎯 $10.748
🎯 $12.524
⚠️ As always, use a tight stop-loss and apply proper risk management.
BTC Retrace RoadMap and 3 nearby supports worth watching NOWThis is a near-term followup to my big picture linked below.
Dip is underway after orbiting our Genesis Fib at 117.9k.
Quickly approaching the next three supports worth watching.
Supports get stronger below but each one needs to slow the dip.
$ 115,140 is a minor fib but possible end of dip wave.
$ 113,9xx is a double fib that should be pretty strong
$ 111,661 is the sister Genesis fib, and a MUST HOLD
.
Big Picture chart and why 117.9k was KEY
=======================================================
.

BTC accumulates, slightly adjusts down💎 BTC PLAN UPDATE – START OF THE WEEK (04/08)
🔍 1. Current Technical Structure
Price Pattern: The chart shows BTC is forming a falling wedge pattern, with converging support and resistance lines.
False Break: There was a false break below the strong support zone around ~112,000, followed by a sharp rebound. This indicates buyers are actively defending this level, showing potential buying pressure.
Fibonacci Retracement: From the recent low to high, the 0.5 (115,559) and 0.618 (116,361) Fibonacci levels are acting as key resistance zones.
Key Price Levels:
• Strong support: 111,800 – 112,300
• Near resistance: 115,500 – 116,500
• Next resistance: downtrend line and previous high around 118,000 – 119,000
🔄 2. Possible Trend Scenarios
✅ Main scenario (bullish):
BTC made a false break below the wedge → rebounded toward Fibonacci resistance → potential:
• Continue rising to the 115,500 – 116,500 zone
• If it breaks and holds above this zone, BTC could break out of the wedge pattern and target 118,000 – 120,000
• A longer-term target could be the 1.618 Fibonacci Extension around ~123,159
❌ Alternative scenario (bearish):
If BTC fails to break above 116,000 and gets rejected:
• It may retest the 112,000 support zone again
• A breakdown below this support would bring back the downtrend
🔄 3. Bullish Supporting Factors:
• The false break signals a shakeout of weak sellers.
• A potential inverse head-and-shoulders pattern is forming, supporting a bullish reversal.
• Moving Averages (MA): Price is nearing the 200 MA (red) – a possible bullish crossover with shorter-term MAs may occur, signaling a buy.
🧭 Suggested Trading Strategy
• Safe buy zone: Around 113,500 – 114,000 if there’s a pullback.
• Take profit in stages: 116,500 – 118,000 – 120,000
• Stop-loss: Below 112,000 in case of a confirmed breakdown

SHIB Still Faces Pressure Below Parabolic SAR ResistanceSHIB continues to struggle beneath its Parabolic SAR, which has established dynamic resistance above its current price at $0.00001382. This persistent downward positioning below the SAR dots suggests that sellers remain in control, limiting bullish momentum and keeping the asset under pressure in the short term.
The Parabolic SAR indicator tracks potential reversals and trend direction. When the SAR dots appear above the price, it typically signals a bearish trend, while dots below the price suggest bullish momentum.
In SHIB’s case, the indicator’s placement overhead means upward attempts may continue to face resistance unless a strong breakout occurs.
Until SHIB flips this level and closes above the SAR, traders may expect continued consolidation or downward movement.

ENA/USD: BBTrend Suggests Latent Bullish Momentum UnfoldingSince June 29, the BBTrend (Bollinger Band Trend) indicator on ENA’s daily chart has shown a steady series of growing green bars. This expansion signals increasing underlying bullish momentum, even as the token’s price trended mostly downward over the past week.
However, today’s 10% rally marks the strongest upside move in that entire period—potentially signaling the start of a reversal. In technical terms, when BBTrend bars expand during price consolidation, it often precedes a breakout. That appears to be playing out now. If this renewed momentum sustains, ENA could be setting up for further upside in the sessions ahead.

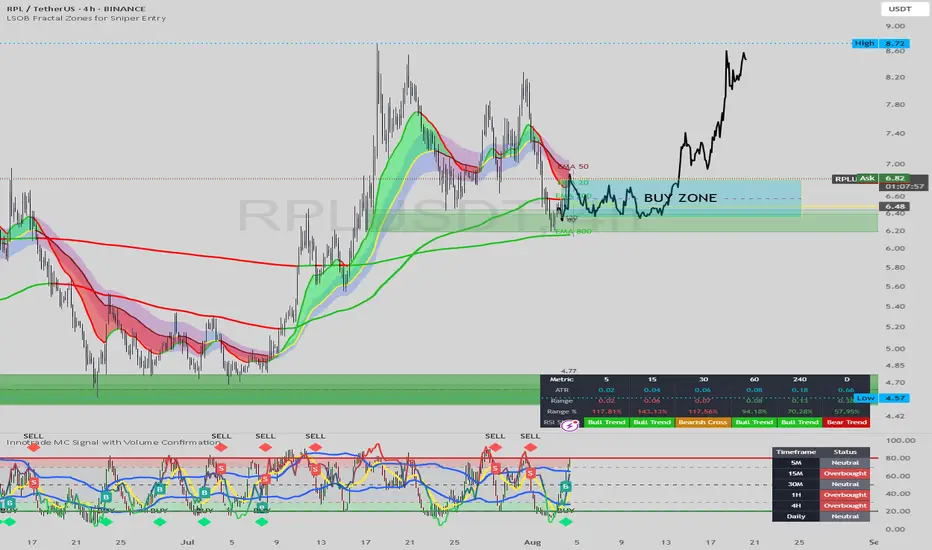
RPL/USDT Enters Prime Buy Zone: Accumulation Before Next Leg Up?Firstly, our Algo-based indicators are used to create this analysis. Please Follow, Boost and leave your comments if you profited with our posts, so we may continue:
This 4-hour chart for RPL/USDT highlights a key support area that could serve as a launchpad for the next bullish impulse.
Analysis:
Corrective Pullback: After a strong rally that peaked near $8.72, the price has entered a corrective phase, pulling back to a significant area of interest.
The "BUY ZONE": A critical support zone has been identified between $6.48 and $6.80. This area represents a confluence of technical support:
Horizontal Structure: It aligns with a previous support/resistance level, where price has reacted multiple times.
Moving Averages: The price is currently testing the EMA 200 and is hovering just above the longer-term EMA 800, both of which often act as dynamic support during uptrends.
Indicator Confirmation: The custom indicator at the bottom of the chart shows the price has dipped into the oversold "BUY" territory, and a fresh "B" (Buy) signal has just appeared. This suggests that selling pressure is exhausting and buyers are beginning to step in.
Price Projection: The drawn black line illustrates a potential scenario where the price consolidates and accumulates within the "BUY ZONE." This period of sideways action would build a base before a strong continuation of the primary uptrend, targeting a retest and potential break of the recent high at $8.72.
Strategy:
Idea: Look for buying opportunities within the defined support zone.
Entry: The area between $6.48 and $6.80 is the designated "BUY ZONE." Traders might look for signs of consolidation or bullish price action within this range to initiate long positions.
Target: The initial target would be the recent high of $8.72.
Conclusion:
The current price action presents a classic dip-buying opportunity. The confluence of structural support, key moving averages, and a bullish indicator signal in the "BUY ZONE" suggests a high probability of a bullish reversal. Accumulation in this zone could fuel the next significant move upwards for RPL.
Disclaimer: This analysis is for educational purposes only and should not be considered financial advice. Always conduct your own research and manage risk appropriately.
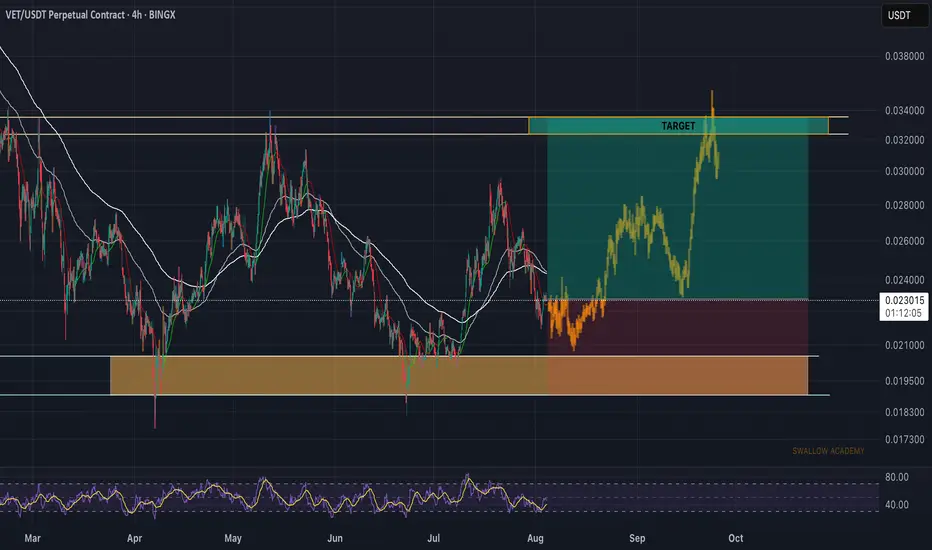
VeChain (VET): Good 1:3 Risk:Reward Trading OpportunityVET is giving us a decent 1:3 R:R ratio trade. We are seeing that sideways channel that has formed on VET coin where the price has tested the lower side of it, yet the upper side has not been tested for quite some time, which means we are intending to see that tested, and maybe broken as well, which would give us a good opportunity to long the coin on bigger timeframes until that bigger bullish CME gap!
Swallow Academy
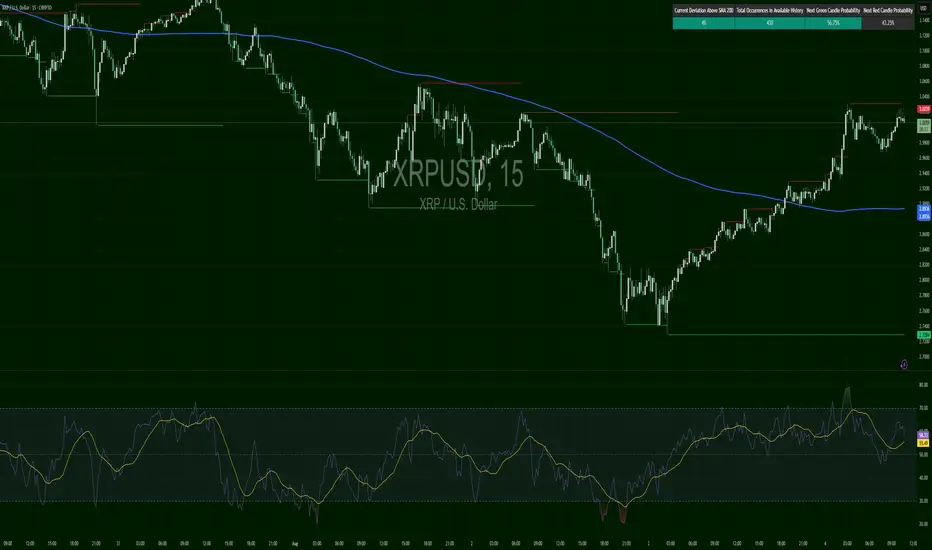
XRPUSD – Return to BattlefrontXRP lifted hard off support and is now hovering near $3.0166, just below resistance at $3.0329. RSI has surged back over 60, while green candle probability is decent at 56.69%.
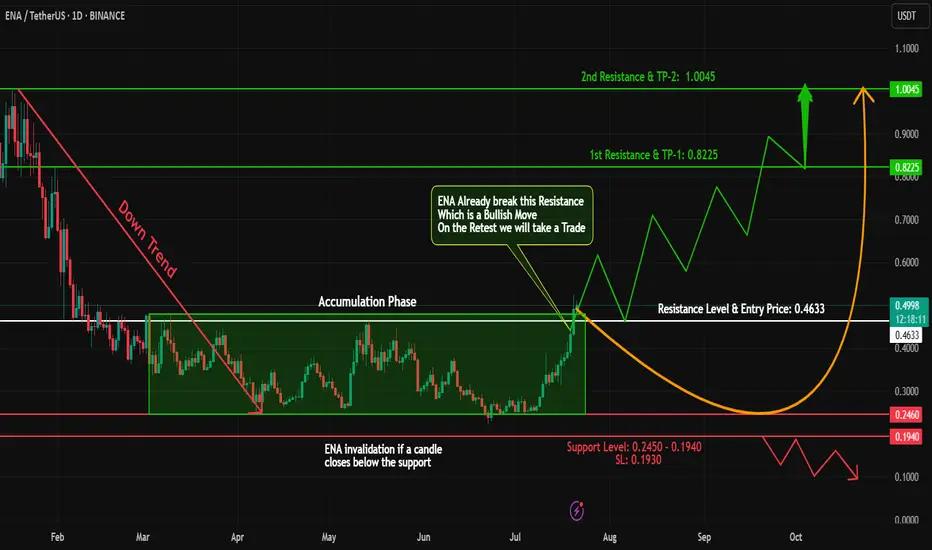
ENA Breakout Alert – Bullish Opportunity Ahead!#ENA has shown a classic accumulation + breakout structure!
🔹 Phase 1: Downtrend – From 1.00 to 0.25, #ENA went through a steep correction.
🔹 Phase 2: Accumulation – Price consolidated for a while, forming a strong base.
🔹 Phase 3: Breakout – #ENA has now closed a daily candle above the accumulation zone – a strong bullish signal!
📊 Trade Plan:
✅ Long Entry: At CMP or on a retest of the breakout zone
🎯 Targets: 0.80 - 1
🛡️ Stop Loss: Just below the accumulation zone
⚠️ Risk Management is key – stay smart and disciplined!
💬 What’s your take on #ENA’s next move? Share your thoughts below!
🧠 Follow for more breakout setups, trend analysis & educational content.
#ENA #CryptoBreakout #Accumulation #Altcoins #TradingView #CryptoAnalysis #TechnicalAnalysis #TrendReversal
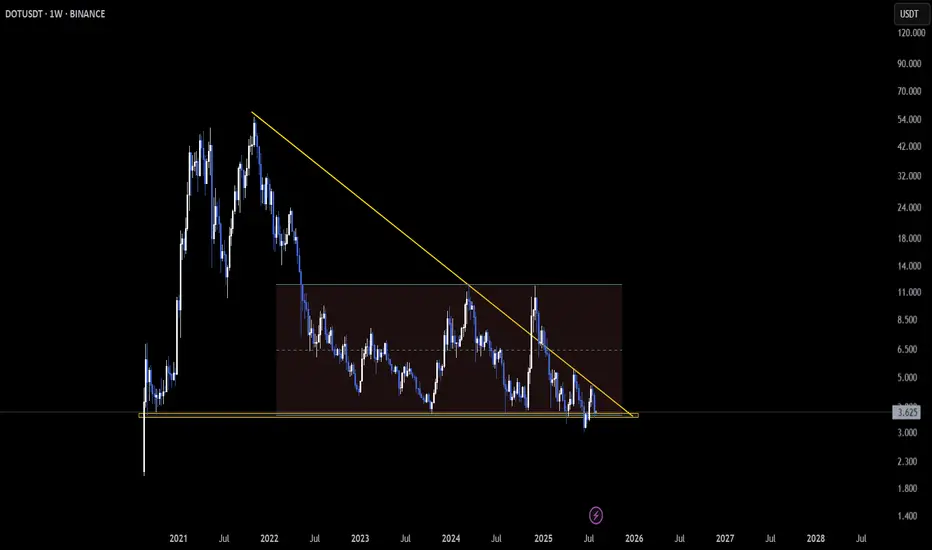
DOT Approaches Key Confluence Zone on Weekly and Daily Charts📅 CRYPTOCAP:DOT is at a crucial juncture, with major structure overlap across timeframes.
On the Weekly, price is testing support from a descending triangle 🛡️ — a level that has held multiple times in the past.
📆 Meanwhile, the Daily chart shows a falling wedge pattern forming 📐, a classic setup known for bullish reversals.
The confluence here adds weight — this is a zone where price often reacts.
👀 Bounce incoming or breakdown loading? This one deserves close attention.
What’s your take on the next move?
Not financial advice. BINANCE:DOTUSDT
BTC DAILY - CUP & HANDLE BREAKOUT TARGETING $169KBitcoin just confirmed a macro Cup & Handle breakout with a strong push above the $112K neckline. The price is now consolidating above key moving averages – setting up for a potential explosive continuation. 🔥
🟢 Technical Highlights:
📈 Cup & Handle pattern – classic bullish continuation
💥 Breakout target: +32% move → $169,000
🟩 1D MA 50 / MA 200 acting as dynamic support
🔄 MACD bullish cross confirming momentum
🟦 Breakout above major resistance = new market structure zone
🧲 Psychological support near $99K and $112K
***********************************
🎯 Buy Signal Details:
Entry Zone (Pullback Valid): $112,000–$114,000
Take Profit: $169,000 🎯
Stop Loss: $99,000 🛡️
Buy Confidence: 95% ✅
📌 Not financial advice. This is pure chart-based technical analysis.

This is the same fractal for XLM from April 2017.The Fractal from April 2017 is repeating with the November Pump and the recent pump as well.
Next comes a dip and then another pump up to $1

ETHUSD – Holding the LineETH is flirting with breakout mode, reclaiming its 200 SMA at $3,477 and pushing to $3,569. RSI is recovering from a dip and regaining upside pressure. Momentum holds above $3,525.

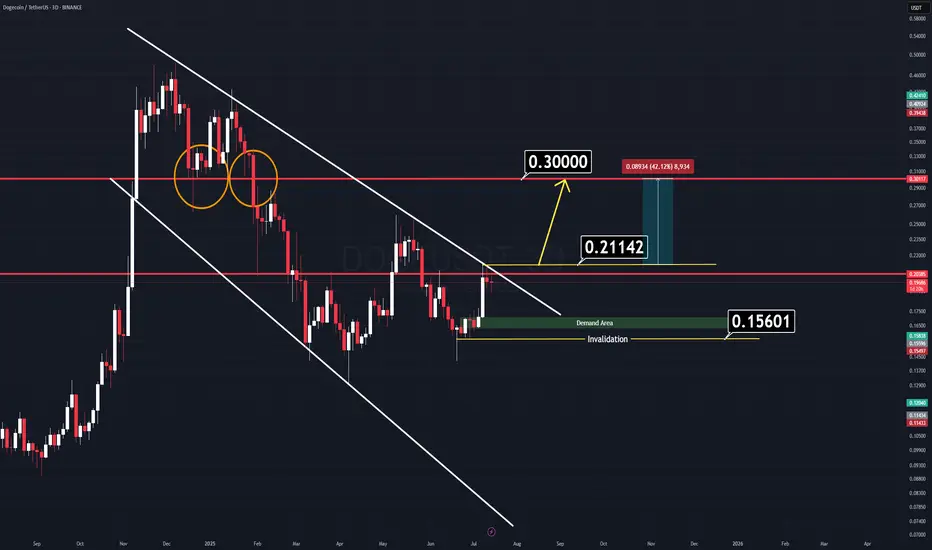
DOGE Analysis (3D)There’s a very simple and clear chart setup on Dogecoin (DOGE) right now.
We have two major horizontal key levels and a channel that is about to break down. If the price manages to close above the yellow-marked line ($0.21142), we can expect a strong rally to follow.
There’s no need for complicated indicators cluttering the screen — all relevant levels are clearly marked on the chart.
Two Logical Entry Approaches:
1️⃣ Breakout Entry: Enter on a confirmed breakout. (Waiting for a daily candle close on a memecoin might slightly reduce your profit range, but it’s the safer approach.)
2️⃣ Demand Zone Entry: Wait for the price to retrace to the green demand zone — though this scenario seems less likely for now.
A combined approach can work best: enter on breakout, use the horizontal levels as support, and set a tight stop-loss to manage risk.
Good Luck.
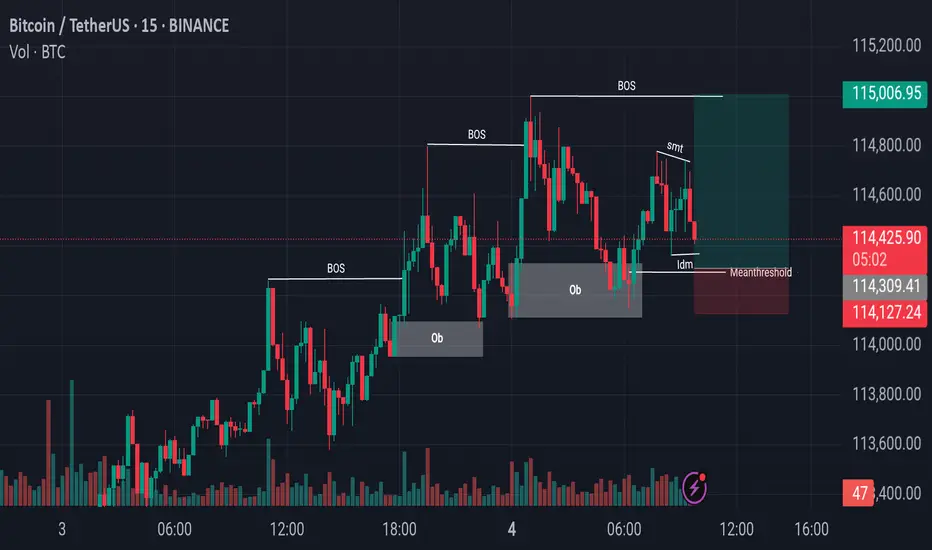
Bitcoin Price Flow From Liquidity Grabs to Structural BreakoutsBitcoin Price Action Analysis:
In recent sessions, Bitcoin has been consistently making Breaks of Structure (BoS) to the upside, indicating a strong bullish trend. Most recently, after forming another BoS, the market retraced downward and precisely tapped into a previously established Bullish Order Block (OB). This reaction led to a temporary upward movement; however, during this process, the market also created a zone of internal liquidity.
Currently, Bitcoin is showing signs of a downward move again, potentially aiming to capture Internal Drawdown Market (IDM) liquidity. Just below this level lies another key Order Block, which could serve as a strong support zone. If the price reacts positively from this region, we might see the market initiate another upward leg, potentially forming the next Break of Structure to continue the bullish narrative.
Note: Always perform your own research (DYOR) before making any trading decisions.