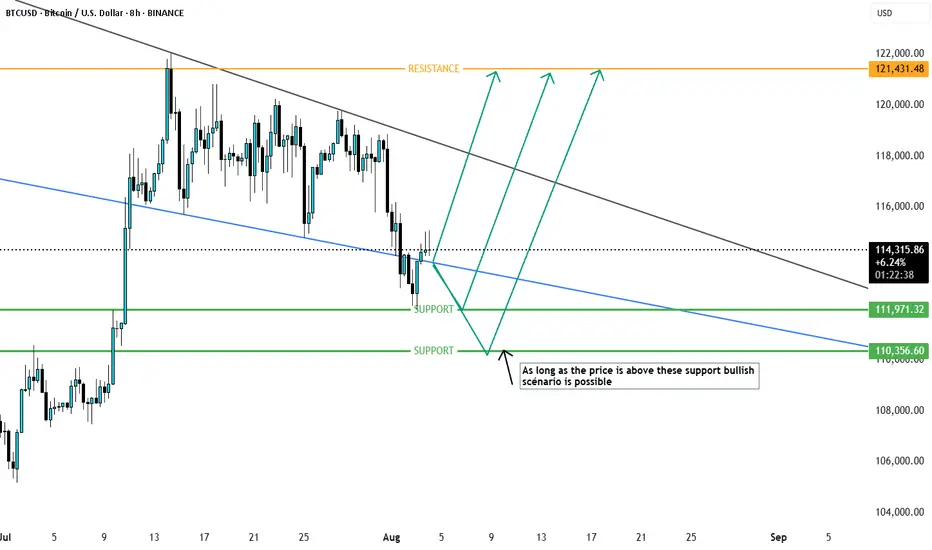
BTCUSD Possible senarioas long as the price is above this suport BTCUSD is bullish and if price drops below these support then short term bearish may be possible. let us see. currently price is rejecting from fib 0.5 of recent swing
Crypto market
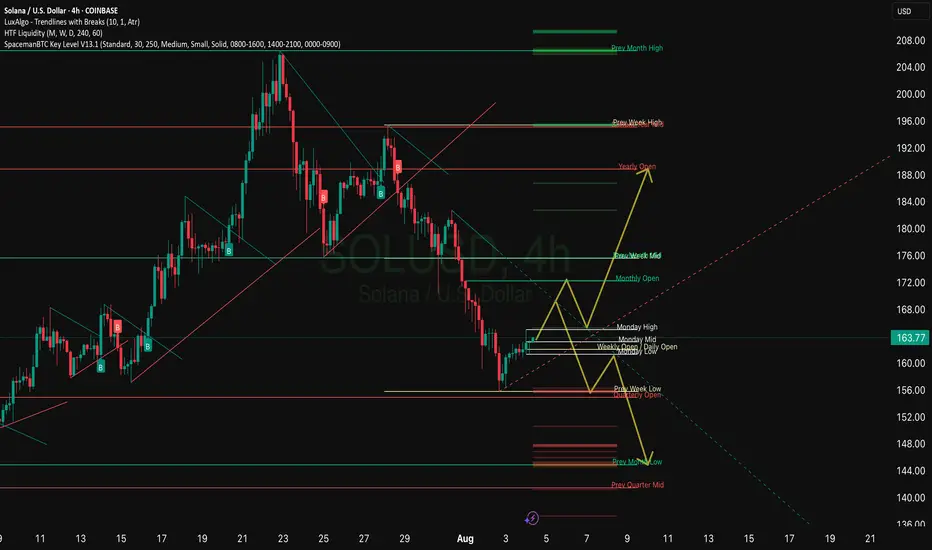
SOL Both scenarios are valid! SOL is still bullishSOL Both scenarios are valid! SOL is still bullish
SOL is in a critical zone. The price is still inside a large bullish pattern and as long as it stays inside the pattern, the trend remains bullish and SOL should follow the bullish scenario.
The bullish targets are at 205, 214 and 224
It may happen that the FOMC will bring surprises, so if SOL manages to break below the pattern, it will activate the bearish scenario after that and the chances of falling will increase further as shown in the red scenario.
The bearish targets are at 160 and 139
You may find more details in the chart!
Thank you and Good Luck!
PS: Please support with a like or comment if you find this analysis useful for your trading day

BRETTUSDT: Bullish Breakout Aims for $0.08 TargetFirstly, our Algo-based indicators are used to create this analysis:
This daily chart for BRETTUSDT suggests a developing bullish scenario following a key technical breakout.
Analysis:
Channel Support: The price is trading within a broad ascending parallel channel. It has recently respected the lower boundary of this channel, finding solid support and bouncing off it, which indicates a potential continuation of the larger uptrend.
Trendline Breakout: A significant descending trendline that was previously acting as resistance has been broken. The price is currently hovering just above this line, which appears to be a classic breakout-and-retest pattern. A successful hold above this line would serve as strong confirmation for further upside.
Indicator Signal: The custom indicator at the bottom of the chart shows the price moving out of the "oversold" territory. The projected path of the indicator is pointing upwards, suggesting building bullish momentum that aligns with the price action.
Price Projection: The drawn red line illustrates a potential path for the price, anticipating a move upwards towards the upper resistance of the ascending channel.
Strategy:
Entry: The current price level (around $0.052) could be considered an entry zone, as it represents a successful retest of the broken trendline.
Target: The primary target for this bullish move is clearly marked between $0.08 and $0.10. This level aligns with the upper boundary of the long-term ascending channel.
Conclusion:
With multiple technical factors pointing in the same direction—a bounce from channel support, a breakout and retest of a key trendline, and a supporting indicator signal—the outlook for BRETTUSDT appears bullish. The next major objective for the bulls is the 0.08−0.10 resistance area.
Disclaimer: This analysis is for educational purposes only and should not be considered financial advice. Always conduct your own research and manage risk appropriately.

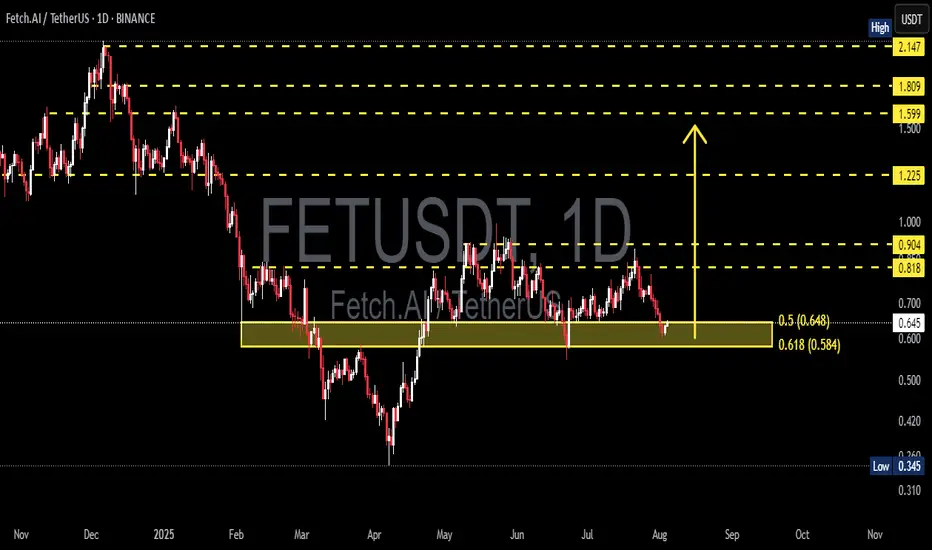
FET/USDT Testing Fibonacci – Bounce Incoming or Breakdown Ahead?📊 Technical Analysis Overview:
FET/USDT is currently testing a strong demand zone aligned with the Fibonacci Retracement 0.5 – 0.618 levels, specifically between $0.648 and $0.584. This “golden pocket” area is historically significant and often acts as a pivot zone for price reversals.
🔍 Chart Pattern:
The price formed a series of higher highs and higher lows from March to June, indicating a bullish structure.
Since July, momentum has weakened, and the price has corrected back into the key support zone that previously acted as a base for a rally.
---
📈 Bullish Scenario:
If price holds above $0.584 and forms a reversal candlestick (e.g., bullish engulfing or hammer), a strong rebound is likely.
Key upside targets:
$0.818 (minor resistance)
$0.904 (psychological level)
Potential breakout toward $1.225 if bullish volume returns.
📉 Bearish Scenario:
A decisive breakdown below $0.584 with high volume could trigger further downside toward:
$0.42 – $0.345 (next major support zone)
This move could confirm a bearish continuation pattern such as a descending triangle if resistance continues to hold.
---
🎯 Strategic Outlook:
The current zone is a make-or-break level, and the market is at a decision point. Traders should wait for a clear confirmation through price action and volume before committing to directional trades.
#FETUSDT #CryptoAnalysis #FibonacciSupport #AltcoinSetup #FetchAI #TechnicalOutlook #BullishOrBearish #SupportZone #GoldenPocket
Solana definition of movementSOL is in a squeeze phase: the price is holding above $163, but meets resistance around $183-186. Indicators show neutral, slightly weak momentum. A break above $186 with increasing volumes will open up potential at $190+; a break below $178 will lead to a deeper correction to $171-170. Until then, it is worth watching the 20-d EMA hold and reactions to it.
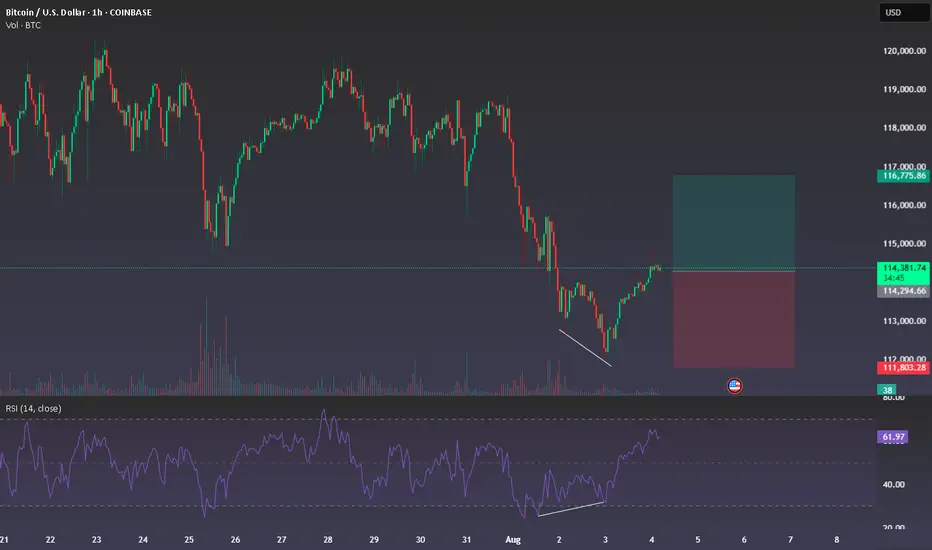
BTC Long – Bullish Divergence 1H Looking for long from 114300 zone
1H chart showing bullish divergence
also price broke short downtrend with nice momentum
Timeframe: 1H
Entry: 114300
Target (TP): 116850
Stop (SL): 111700
Only sharing my view, not any financial advise, thx
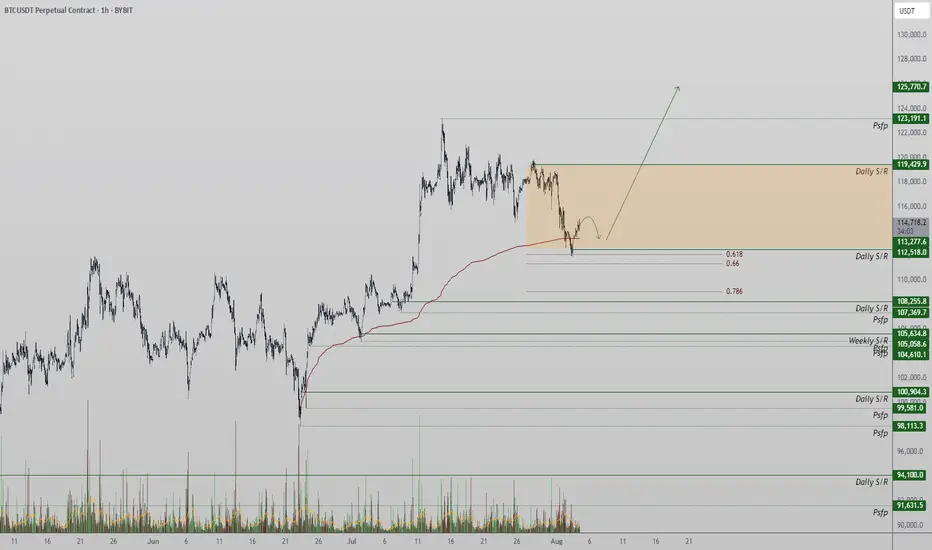
Bitcoin Tests Major Support at $112,500Bitcoin is currently in a local downtrend, with price now testing a major support zone around $112,500. This level, backed by multiple technical confluences, may serve as the base for a potential reversal if defended on lower timeframes.
Price action has been drifting lower over the past sessions, finding its way into a key support zone defined by the 0.618 Fibonacci retracement, the blue upward trendline, and prior structure. The $112,500 region now acts as the immediate level to hold from an intraday perspective. If bulls are able to defend this zone and volume confirms participation, the probability of a rotation higher toward $123,000 increases significantly.
Key Technical Points:
- Support at $112,500: Aligned with 0.618 Fibonacci, trendline support, and structural pivot
- Intraday Confirmation Required: Holding this level on lower timeframes improves the
probability of reversal
= $123,000 Target in Sight: Technical target for rotation if a bottoming structure forms and holds
From a short-term perspective, Bitcoin has clearly shifted into a local downtrend, creating a sequence of lower highs and lower lows. However, the current area around $112,500 presents a strong confluence of support that could interrupt this trend. This zone includes the 0.618 Fibonacci retracement from the most recent swing move, a respected upward trendline (blue), and a previous structural pivot. Together, these elements increase the probability of a bounce—provided price can stabilize.
At this stage, price may still trade sideways and consolidate within this region to form a bottoming structure before any meaningful move higher. For traders, this means confirmation is key. Watching for multiple intraday candle closes above the support zone, paired with an increase in bullish volume, would suggest that demand is building. Only then would the setup favor an entry targeting the local highs.
The upside technical target from this area remains at $123,000, representing the recent swing high and a clear resistance level. A reclaim and rotation to this level would validate the support zone and reintroduce the bullish bias in the short term. Until that occurs, however, price could continue to consolidate, especially if volume remains low or indecisive.
The overall structure still leans constructive, as long as $112,500 holds. A breakdown below this level would weaken the short-term setup and potentially open the door to deeper downside probing. But for now, the region remains a high-probability bounce zone on lower timeframes.
What to Expect in the Coming Price Action
Bitcoin is testing critical intraday support at $112,500. If this level holds with volume confirmation and intraday structure aligns, a rotation toward $123,000 is likely. However, price may continue consolidating at this level before a clear direction forms.
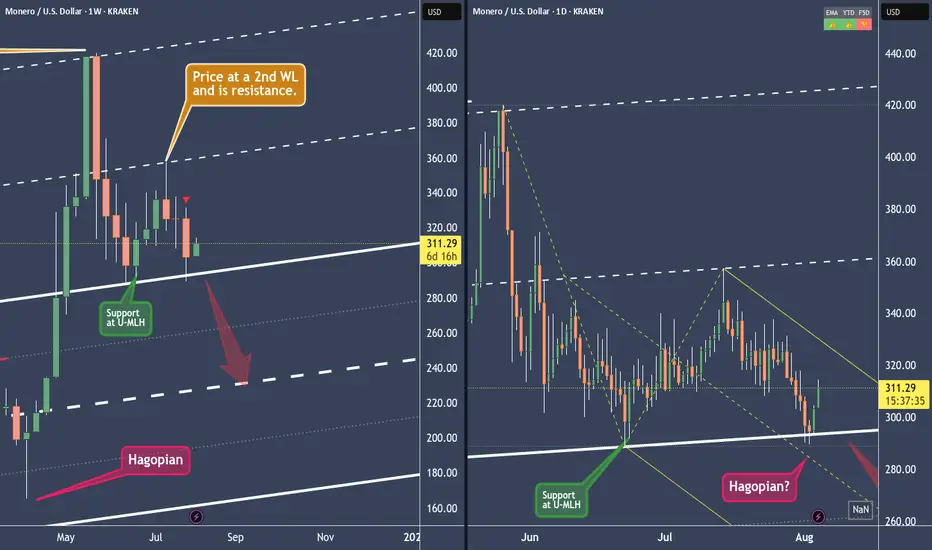
XMRUSD - Monero is strong. But strong enough?Can Monero break the U-MLH of the yellow Fork to stop the down-drift?
In the last post we see that Monero has the potential to reach the white Centerline at around $240. At least this is the view on the weekly Chart.
On the other hand we see support at the U-MLH in the daily Chart.
Until the U-MLH of the yellow Fork isn't breached by a open and close outside, the weekly short projection is in play.
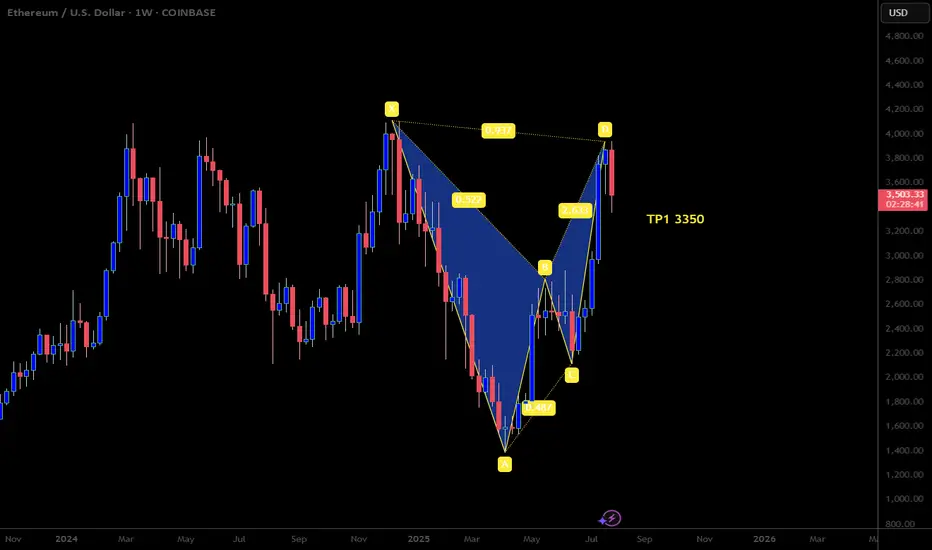
Bearish Bat Pattern on ETHUSDLooking to continue selling here with this beautiful harmonic bat pattern that just formed. We also got a bearish candle close on the weekly timeframe which gives us solid sells confirmation. Happy Trading
BTC - 1H Elliott Wave AnalysisWelcome back to another Elliott Wave Analysis for Bitcoin! :)
In this analysis we want to focus on the short term. We have been in a correction displayed as pink ABC and it seems that this correction is coming or has come to an end in the pink Wave C.
It is hard to say if the pink Wave C has finished yet. The last low at 111'850 USD is the 1 to 1 ratio of the pink Wave A to the pink Wave C which is a common target for Wave C.
Looking at the sub-count in white we think another low in white Wave 5 would look cleaner but it is not given to happen.
For now we added the white Wave 4 resistance of which we touched the 0.5 FIB retracement at 115'830 USD which is a rather deep but valid Wave 4. We also added the 0.618 FIB at 116'213 USD which would be the invalidation for the white Wave 4. If we hit it the probabilities shift to the case that the low at 111'850 USD is already the end of pink Wave C.
If we get white Wave 5 the first target would be at the 1 to 1 FIB at 111'319 USD which is right below the last ATH of which we bounced recently but that seems a bit shallow.
The next target would be at around 109'700 USD where we got some confluence between the 1.38 FIB target for white Wave 5 measured with the white Wave 1 as well as the 1.618 FIB target if we measure of the white Wave 4. It is also close to the 0.5 FIB of a bigger support area.
Be aware that the bigger support area below goes down to 103'000 USD which is the 0.786 FIB of the support area.
Due it looking likely that pink Wave C is finished we also added the support area for the potential Wave 2 in the bullish scenario.
It is between the 0.5 FIB at 113'640 USD and the 0.786 FIB at 112'616 USD. From this area we would like to see a bounce if the low is already in.
Thanks for reading.
We would appreciate a follow and boost if you like the analysis! :)
NO FINANCIAL ADVICE.

Bitcoin BullishAfter exiting a correction, the first impulse (Wave 1) appears. I expect a retracement of at least 50% of the Fibonacci.

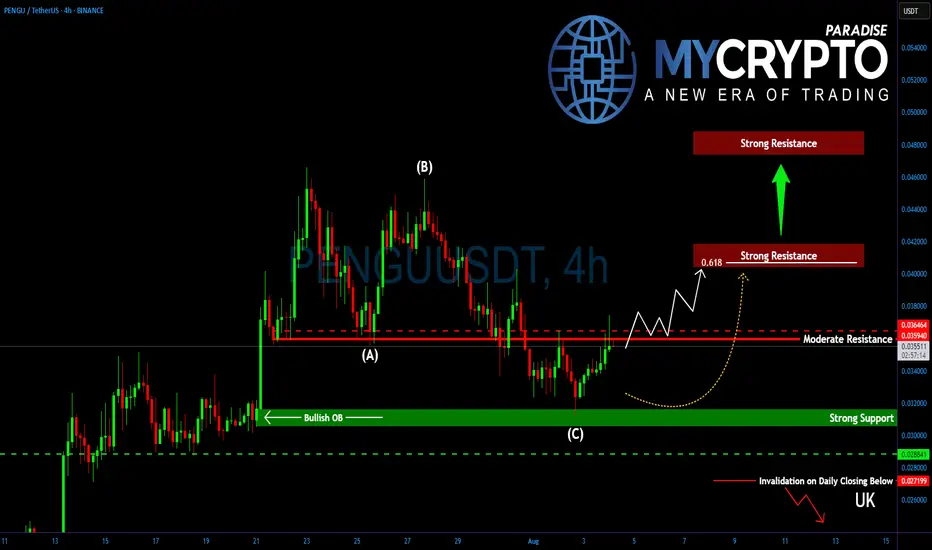
Is PENGU About to Explode or Fake Out Everyone Again?Yello, Paradisers! Have you been watching #PENGUUSDT after its recent dip? Because if you haven’t, you might be missing out on a potentially explosive setup forming right now…
💎After placing a major high around $0.0460, PENGU entered a textbook ABC corrective wave. But that correction looks to be over now, and what’s emerging could be the beginning of a powerful bottoming structure.
💎#PENGU is currently facing a critical short-term resistance at $0.0360–$0.0364, a level that bulls must flip to ignite a stronger recovery. If they succeed, all eyes shift toward the 61.8% Fibonacci retracement at $0.0405, a major confluence level that aligns with a key horizontal resistance between $0.0405 and $0.0415. Expect heavy action here. Bulls will likely face real pressure at this zone.
💎However, and this is where it gets interesting, if PENGU breaks above $0.0415 with strength, then momentum could pick up fast, paving the way for a fresh rally towards new yearly highs between $0.0480–$0.0494.
💎On the flip side, support remains solid between $0.0312 and $0.0302. This zone isn’t just an ordinary support, it also holds a bullish order block (OB), offering extra protection and confluence. This is where the market is quietly showing signs of strength while the majority are distracted elsewhere.
Paradisers, strive for consistency, not quick profits. Treat the market as a businessman, not as a gambler.
MyCryptoParadise
iFeel the success🌴
Bitcoin Range for August?Historically August has been a tough month for crypto in the past with mostly flat to negative returns. For that reason, although not a perfect science, I would not be surprised if we see a rangebound environment continuation for BTC.
So what would that look like? Structurally there are three thirds to the range, currently price is looking to break through into the upper third after bouncing off the bottom third bullish orderblock.
Trade setups will naturally present themselves as rotational plays both bullish and bearish at the extremes of each of the thirds but much larger trades from the range top and bottom.
Altcoins are lagging behind BTC structurally so where BTC has been choppy for a few weeks, most large cap alts have hit their highs and are now looking to settle into a range before the next leg up.

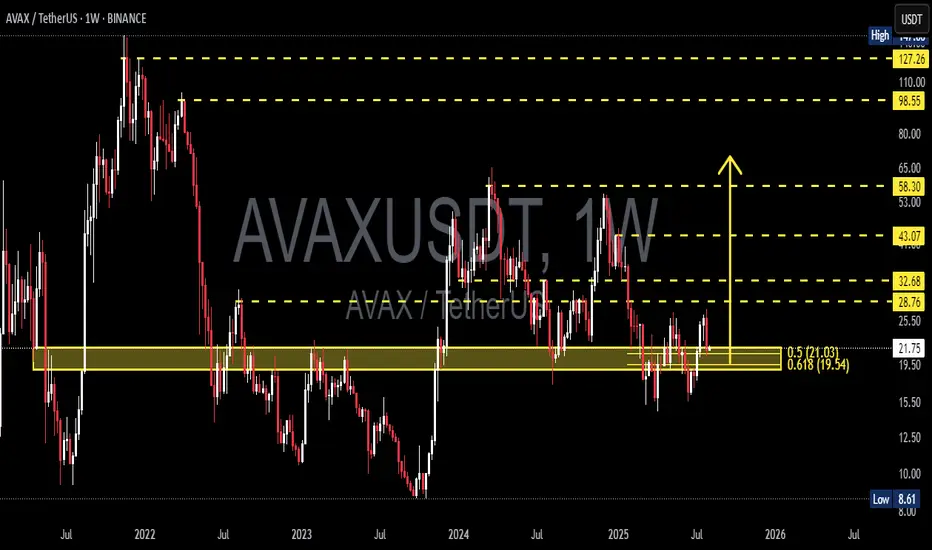
AVAX at the Edge: Golden Pocket Support or Breakdown Incoming?🧠 Overview:
AVAX is currently trading at a decisive support zone, aligned perfectly with the Fibonacci golden pocket (0.5–0.618) at $21.03–$19.54. This level has historically acted as a strong pivot zone, serving both as resistance during bear markets and support in bullish recoveries.
The market has compressed into this key demand zone after a prolonged sideways structure. Now, all eyes are on how price will react — this zone will likely determine AVAX's mid-to-long-term trend.
---
🔍 Key Technical Highlights:
🔸 Fibonacci Confluence Zone (Golden Pocket):
0.5 Fib Level: $21.03
0.618 Fib Level: $19.54
This area coincides with a weekly demand block — a high-probability reversal zone where buyers have historically stepped in.
🔸 Major Resistance Levels to Watch:
$28.76 – First significant supply zone.
$32.68 – Previous lower high, potential breakout confirmation zone.
$43.07 – Weekly structure resistance.
$58.30 – Mid-term bullish target.
🔸 Support Levels Below:
$15.00 – Local base during early 2023.
$8.61 – Multi-year low (critical support if demand collapses).
🔸 Structure Insight:
Price is currently forming a macro higher low, suggesting a potential accumulation phase. However, failure to hold this zone could trigger a bearish continuation.
---
🚀 Bullish Scenario:
If price sustains above $19.54–21.03 and breaks above $25.50, the following upside targets could be reached:
1. $28.76 – Local resistance
2. $32.68 – Break of bearish structure
3. $43.07 – Momentum extension
4. $58.30 – Bullish macro target
Catalyst to watch: Weekly bullish engulfing candle + volume spike + break of structure → these would confirm buyers are in control.
---
🔻 Bearish Scenario:
If the price breaks below $19.54 with strong bearish volume, then:
1. $15.00 – First zone of interest for buyers
2. $8.61 – Critical long-term support zone
This would confirm a distribution pattern and signal that the market may revisit lower accumulation zones before any major uptrend resumes.
---
🧩 Market Psychology Insight:
This current range is where smart money positions themselves — either for continuation or reversal. Retail traders often get shaken out in this kind of compression. Stay patient and wait for confirmation rather than anticipation.
---
🎯 Conclusion:
AVAX is now at a make-or-break point. With the price sitting in a high-confluence demand zone, traders should prepare for volatility and monitor weekly closes. A strong move in either direction will likely determine the next multi-week trend.
> “The bigger the base, the higher in space.” – If this is true accumulation, the upside could surprise many.
#AVAX #AVAXUSDT #CryptoTechnicalAnalysis #AltcoinWatch #FibonacciLevels #SupportResistance #BullishOrBearish #SmartMoneyZone #WeeklyChart #CryptoTrading #BreakoutOrBreakdown
BTC is just beginning its correction🌐 As always, people like to find meaning in everything to make life seem simpler and more meaningful. So, once again, Trump has been blamed for the market crash.
Probably, if it weren't for geopolitics, Bitcoin would have grown indefinitely, and no one would have taken profits, but simply admired the numbers in their accounts 😁
But this is the real world, and BTC has long been asking for a correction along with the entire market, which I have been talking about for a long time in my ideas.
That is why this is not just a dip, but the likely beginning of a full-scale correction:
➡️ Last week's decline was expected because there is a GAP at $117,000 - $111,245 at these levels. Now that it is almost closed, a new GAP has formed during the decline at $118,403 - $115,245.
➡️ Volume - The volume of purchases at this price is simply negligible; no one wants to buy the dip even at $112,000. In addition, a divergence has been forming since last week in the volume of purchases, which has been declining for a long time.
➡️ Money Flow - very little liquidity entered on the rebound. This signals a lack of interest in buying the dip. The indicator is firmly in negative territory.
➡️ The price has also returned to the boundaries of the descending flag. Technically, this means a probable rebound to $118,000, the upper boundary of the flag, where the GAP is practically ending.
📌 Conclusion:
The main question now is: what next? Either we go higher and close the GAP from above, or we go down to retest the bottom from Sunday and close the GAP.
So far, everything points to the second scenario being more likely.
✍️ What do you think will happen next for BTC?

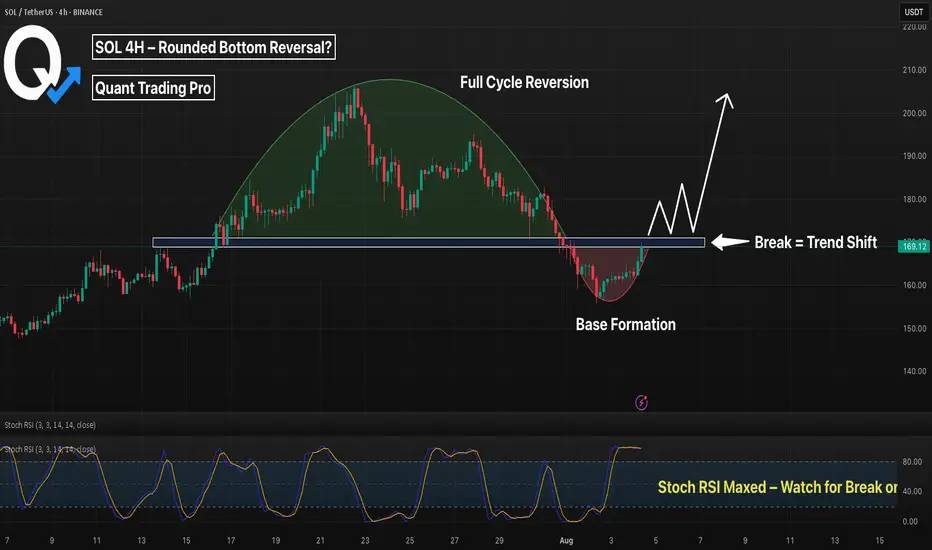
SOL 4H – Rounded Bottom Forming, But Will It Break the Neckline?Solana may be completing a rounded bottom formation on the 4H chart — a classic reversal pattern that often signals a shift from distribution to accumulation. After a deep pullback from July highs, SOL has carved out a smooth base with clear curvature, now pressing into the neckline resistance around $169–$171.
The structure resembles a full cycle: a rounded top leading into a rounded bottom — a potential "cup" formation. With Stochastic RSI pushing into overbought territory, we’re approaching a key decision point.
🔍 Key Factors:
– Rounded bottom structure shows controlled re-accumulation
– Neckline acting as current resistance (watch for breakout)
– Break + retest could trigger the next leg toward $185–$190
– Failure to break may lead to chop or retrace toward $158–$160
This pattern often precedes explosive continuation if volume confirms the breakout.
Will SOL confirm the reversal — or is this just another trap?
👇 Comment your thoughts below.
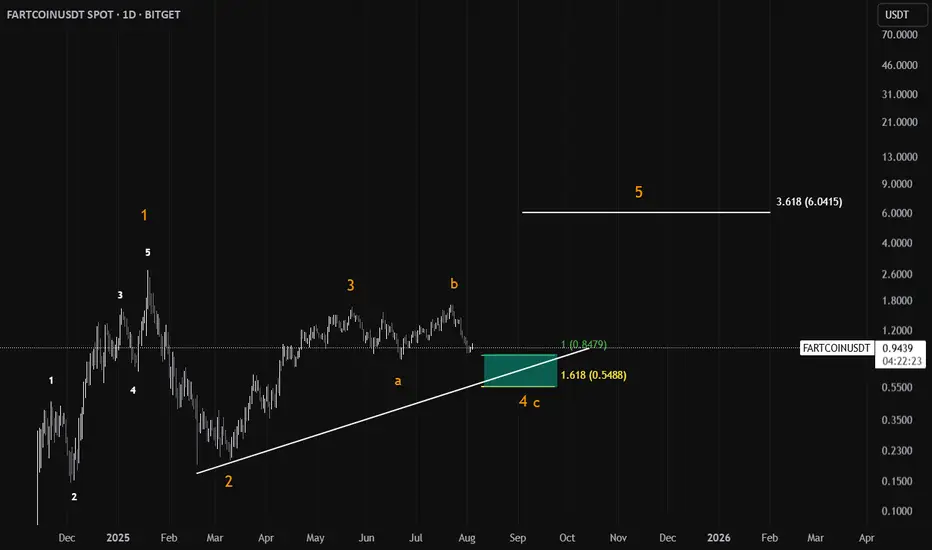
Fartcoin price analysis. Wave -(5)- coming soon ?)📢 Almost 3 months have passed since our last #Fartcoin post
During this time, the #FartcoinUSDT price has corrected itself well.
📈 What do you think about making another wave up - (5) - the final one?
Well, at least looking at our interpretation of the wave analysis on this chart, it turns out that there is a chance for this !)
🚀 Growth to $2 and $2.37
ℹ️ The main and unshakable condition is that the #Fartcoin price cannot fall below $0.87 for this analysis and forecast to be relevant!
________________
📚 Follow us ❤️ for daily crypto insights & updates!
🚀 Don’t miss out on important market moves

TRXUSDT Short Trade - Price CorrectionsBINANCE:TRXUSDT Short Day Trade - Low Risk, with my back testing of this strategy, it hits multiple possible take profits, manage your position accordingly.
Note: Manage your risk yourself, its risky trade, see how much your can risk yourself on this trade.
Use proper risk management
Looks like good trade.
Lets monitor.
Use proper risk management.
Disclaimer: only idea, not advice

"Bitcoin’s Big Heist – Are You In or Out?"🚨 BTC/USDT HEIST MISSION – SWIPE THE BULL RUN BEFORE THE BEARS WAKE UP 💰💣
🌟Hi! Hola! Ola! Bonjour! Hallo! Marhaba!🌟
Money Makers & Robbers, assemble! 🤑💰✈️💸
Here’s your decoded BTC/USDT “Bitcoin vs Tether” Crypto Market Heist Plan, fully loaded with Thief Trading Style 🔥 TA + FA combo. We’re prepping for a bullish breakout loot – eyes on the vault, ignore the noise.
🎯 PLAN OF ATTACK:
🎯 ENTRY (BUY ZONE):
💥 “The vault’s open—time to sweep!”
DCA/Layer your buy limit orders near the 15–30 min swing lows/highs for sniper pullback entries.
Use multi-entry method to stack positions (layering / DCA) as per your ammo (capital 💵).
🛑 STOP LOSS:
Set SL at the nearest swing low wick (4H TF) — around 115000.00, adjust based on your risk/load.
SL = insurance. Not optional.
🏁 TARGET:
Lock sights on 125000.00
🎉 Or… vanish with profits before the bear cops arrive.
🔎 MARKET BACKDROP & ANALYSIS:
📈 BTC/USDT currently signals bullish vibes on the swing/day horizon — fueled by:
Macro Fuel & Fundamentals
Sentiment Radar
COT Reports
On-Chain Pulse
Intermarket Clues
🚀 Connect the dots. The smart money's already prepping a breakout move.
🧲 Scalpers Note:
Stick to the long side only. No shorting the beast — unless you’re made of diamonds.
Secure your bag with trailing SLs.
⚠️ NEWS TRIGGER ZONE – TRADE WITH TACT:
📢 Upcoming high-volatility news events can spike charts.
Avoid new entries during releases and guard open trades with trailing SLs.
Protect the loot. Always.
💖 SUPPORT THE HEIST GANG: BOOST IT!
Smash that ❤️ to boost our thief squad’s momentum!
Every click powers this underground mission – making money with style, one pip at a time. 🎯💣💵
🚀 See you in the next heist drop.
Until then – Stay stealthy. Stay profitable. Stay legendary. 🐱👤💸🏆

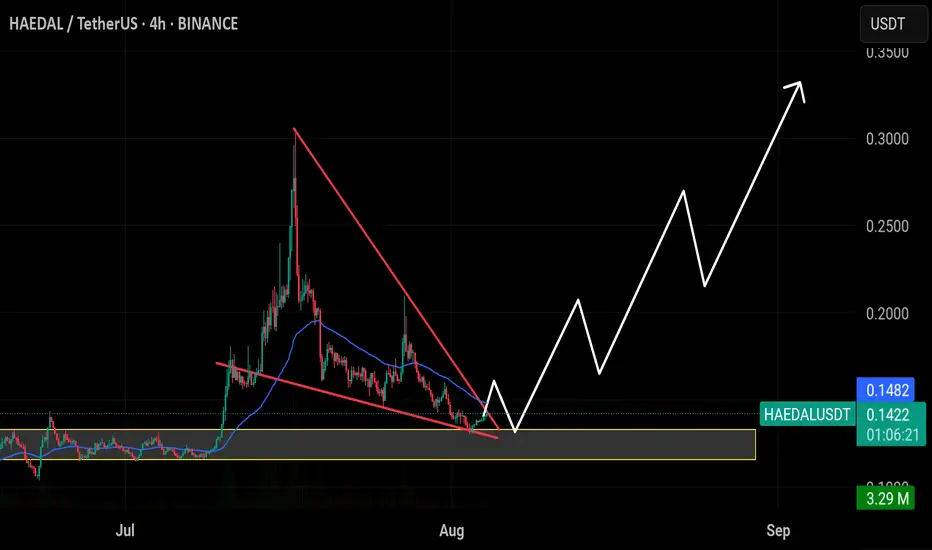
$HAEDAL is moving in a falling wedge. A breakout soon could give$HAEDAL is moving in a falling wedge. A breakout soon could give a 30–60% rise in the short term.
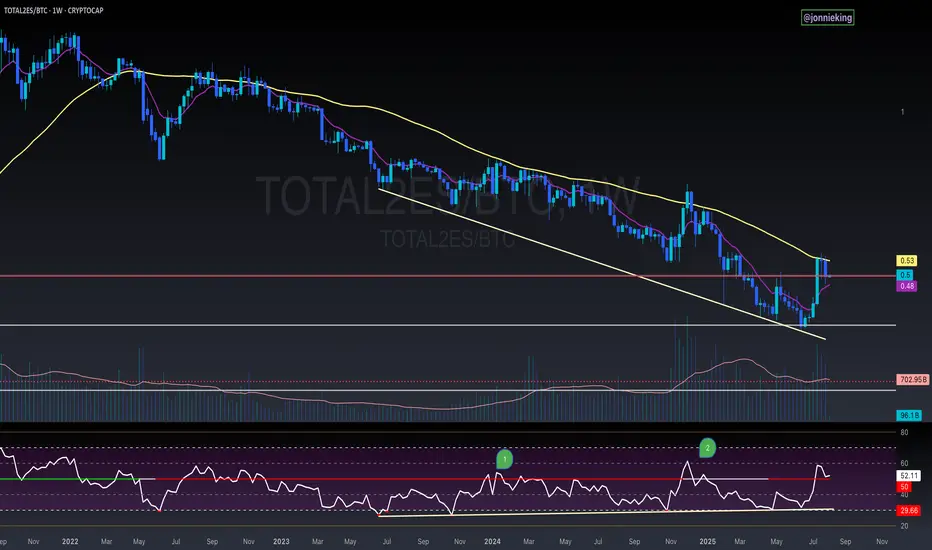
$TOTAL2ES/BTC Weekly Close AlertA bit concerning seeing CRYPTOCAP:TOTAL2 get rejected at the 50WMA and close below it for the 3rd consecutive week against CRYPTOCAP:BTC
Also flirting below the neckline breakout.
PA is still above the EMA9, which needs to hold to keep momentum.
Saving grace is the bullish divergence on the RSI.