BTC DOMINANCE Analysis (4H)The previous analysis, which was for a higher timeframe, did not play out. The price bounced upward from higher support levels, which suggests that after the current sideways movement is over, we are likely to see another move to the downside in the coming weeks.
But what's happening on the lower timeframes? Let's take a closer look.
Based on the recent data, it appears that a triangle pattern is forming on the chart from the point where we placed the green arrow.
Wave C could complete either in the supply box or within the FVG zone.
With a drop in this index for wave D, altcoins may have a chance to recover.
However, if a daily candle closes above the invalidation level, this entire outlook will be invalidated.
For risk management, please don't forget stop loss and capital management
Comment if you have any questions
Thank You
Crypto market

APT 4H – Holding the Higher Low, But Will Bulls Follow Through?APT is holding at a critical demand zone, testing both trendline support and prior consolidation structure.
Price action is forming a potential higher low, with a bullish reaction candle and a sharp Stoch RSI reversal from oversold.
🧠 What to Watch:
– Breakout from descending structure
– Higher high confirmation above $4.60
– Volume follow-through on breakout
This setup offers clean risk: a breakdown invalidates quickly, but if buyers step in here, it could fuel a sharp leg back to $5+.

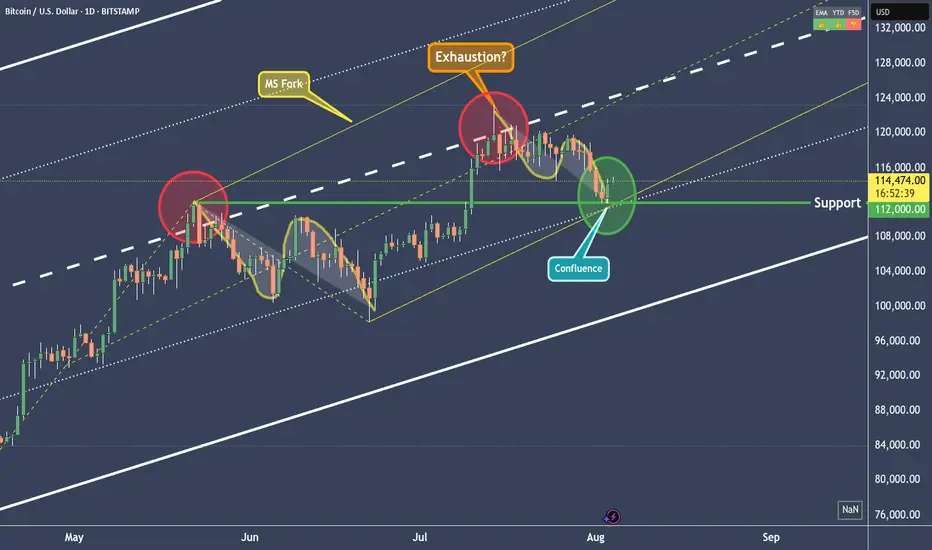
BTCUSD - Right to the point!In the last post (see the Linked Chart), I showed why BTCUSD would fall, and I also pointed out where the first price level for a possible pause might be.
On Friday, that level was reached, and the market seems to be turning *on the dot*. Will we now see higher prices again, or even a new all-time high? Let’s take a closer look:
The “confluence” point is marked by the white fork and the yellow modified Schiff fork. This point lies exactly on the 1/4 line. And this line often indicates temporary levels where at least a pause in the movement can be expected.
When we look at what Bitcoin did at this price level in mid-June, it seems likely that it will rise again. The overall pattern, from the centerline to the 1/4 line, looks extremely similar (see the A-B-C Wave Pattern)!
And yet, I’m not entirely convinced by the picture. Because this was the second time we reached the centerline.
For the brave, this wouldn’t be a bad entry point—or an opportunity to increase the position after this pullback. A possible stop for traders could be placed just below the current low, with targets at the centerline of course.
But why not just lean back, enjoy the profits, and switch into observation mode for now…
I will also make a video that explains the details and connections more clearly.
Happy Monday and stay patient to fight the FOMO! §8-)
SAHARA ANALYSIS🔮 #SAHARA Analysis 💰💰
📊 #SAHARA is making perfect and huge rounding bottom pattern in daily time frame, indicating a potential bullish move. If #SAHARA retests little bit and breakout the pattern with high volume then we will get a bullish move📈
🔖 Current Price: $0.1043
⏳ Target Price: $0.1062 and above
⁉️ What to do?
- We have marked crucial levels in the chart . We can trade according to the chart and make some profits. 🚀💸
#SAHARA #Cryptocurrency #Pump #DYOR

INIT/USDT - Double bottom INIT has successfully double-bottomed around the $0.35 zone, confirming it as a strong demand area. The first leg off this support showed a powerful push from buyers, signaling renewed interest and a potential trend shift. Now, price action is heating up again as buyers step in aggressively with rising volume, reinforcing the bullish momentum.

Is Bitcoin Pulling Back to the 100,000 Area?If we consider the $124,000 level as Bitcoin's high, Bitcoin should correct to the 0.5 Fibonacci level. Write your comment.

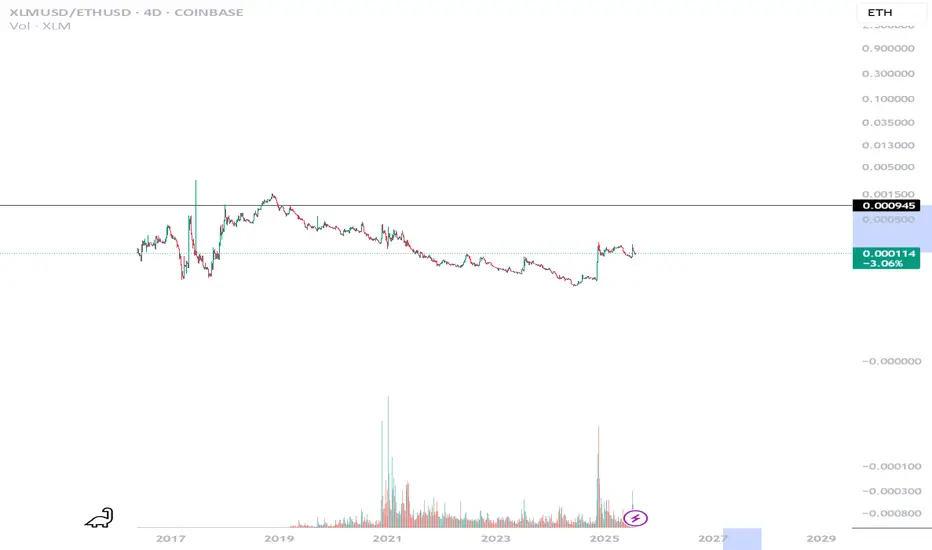
Expect a 730% rally XLM VS ETHThis is a XLM VS ETH Chart, I'm selling for XLM for ETH after XLM runs first expecting 726%
ENS 8H TF - Expect Further Downtrend
▶️ The downtrend is currently held by green support just above 24.00, but there are no signs that the decline is over.
▶️ The move from blue resistance to green support showed strong momentum, suggesting it may be blue wave A of a downside ABC pattern.
▶️ This structure implies that a corrective blue wave B may follow, eventually leading to a blue wave C to the downside.
▶️ The yellow ascending trendline, originating at the April low, is being monitored as a potential target for blue wave C.
▶️ However, it’s too early to confirm this path... further price action is needed to validate the ABC scenario.

NEAR 4H – Squeezed Into Support, But Will the Bounce Stick? NEAR is being compressed between a major descending trendline and a historically strong demand zone on the 4H.
The setup is classic:
🔻 Lower highs = sustained bearish pressure
🔹 Flat support = buyer interest around $1.50–$2.00
🔄 Stoch RSI is flipping from oversold, hinting at possible relief
A clean break below this support would invalidate the setup — but if buyers defend again, we may see a sharp reversal.
⚠️ Watch for:
– Bullish divergence or high-volume bounce
– Break and retest of the trendline for confirmation
– Stop hunts below support before reversal (wick traps)

HEI Bullish DivergenceBINANCE:HEIUSDT
Trade Setup:
Target 1: 0.3703 (0.786 Fibonnaci Golden Zone).
Target 2: 0.3856 (0.618 Fibonnaci Golden Zone).
Target 3: 0.3964 (0.5 Fibonnaci Golden Zone).
Target 4: 0.4420 (0 Fibonnaci).
Stop Loss: 0.3259 (1.272 Fibonnaci).
RSI Analysis: The RSI is showing a bullish divergence, suggesting potential bullish momentum. The current RSI is around 17.39, approaching oversold territory, so caution is advised.

Conflux CFX price analysis Recently, #CFX price shot up very strongly, due to the publication of the news that:
#ConfluxNetwork, China's Tier 1 blockchain, announced the launch of #Conflux 3.0 in August and announced plans to help issue a stablecoin pegged to the offshore yuan as China explores the possibility of issuing yuan stablecoins.
The news already reads as “very vague, promising...” but let's remember that we are talking about China, where crypto has been gradually banned since 2013 and finally banned in 2021.
💰 Looking at the OKX:CFXUSDT chart, we see that the price cannot be fixed above $0.19, which means that you should be careful with longs.
📈 If the words from the news are confirmed by actions, then the #CFX price will definitely consolidate above $0.19 and then it will be safe to open a long position.
🐻 And if the desired cannot be realized, then a correction to the $0.085-0.105 zone may become a new reality.
_____________________
Did you like our analysis? Leave a comment, like, and follow to get more


Possible run to 130 in the cardsEasily invalidated.
We are using the patterns from the price action post threshold break (redline in bottom pane)
These breaks are unseen on this time frame
The volume instabilities are between the 15 minute and the 1 hour. I would look for breaks under 15 minutes, too much noise at that level. Go ahead and test it yourself. See my script posted on trading view for details.

BTCUSDT | Key Trend Channel Breakdown & Major Support AheadBitcoin has broken below a key trend channel on the 4H chart, currently trading around $113,891. Price is reacting after a sharp drop, approaching a major demand zone located between $107.5K and $109K, which previously acted as a strong support.
📉 Downside Potential:
Main Demand Zone: $107.5K – $109K
A possible bullish reaction is expected here if buyers step in aggressively.
📈 Upside Targets if Price Rebounds:
First Target: Upper boundary of local channel – ~$117.5K
Second Target: Full bullish recovery – ~$135K
⚠️ Note: This move comes after an extended consolidation and a sudden breakdown. Pay close attention to the lower boundary zone, as failure to hold could trigger a deeper correction.
📊 Chart Type: BTCUSDT – 4H (Binance)
🔧 Tools Used: Trend Channels, Support/Resistance Zones
📅 Date: August 3, 2025

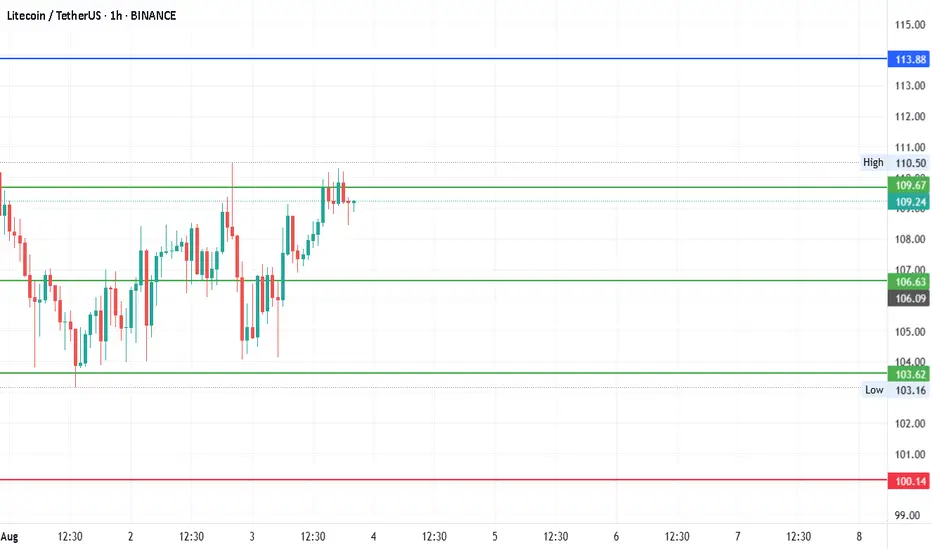
#LTCUSDTDate: 03-08-2025
#LTCUSDT - Current Price: 109
#LTCUSDT Pivot Point: 107 Support: 104 Resistance: 110
#LTCUSDT Upside Targets:
Target 1: 113
Target 2: 117
Target 3: 120
Target 4: 124
#LTCUSDT Downside Targets:
Target 1: 100
Target 2: 97
Target 3: 93
Target 4: 89
#Crypto #Bitcoin #BTC #CryptoTA #TradingView #PivotPoints #SupportResistance
#TradingView #Nifty #BankNifty #DJI #NDQ #SENSEX #DAX #USOIL #GOLD #SILVER
#BHEL #HUDCO #LT #LTF #ABB #DIXON #SIEMENS #BALKRISIND #MRF #DIVISLAB
#MARUTI #HAL #SHREECEM #JSWSTEEL #MPHASIS #NATIONALUM #BALRAMCHIN #TRIVENI
#USDINR #EURUSD #USDJPY #NIFTY_MID_SELECT
#SOLANA #ETHEREUM #BTCUSD #MATICUSDT #XRPUSDT #LTCUSDT
BTC -MACD Triggered the Breakout Early, MACD MasteryYou didn’t need 20 indicators. Just one system that actually worked.
The MACD Liquidity Tracker Strategy flipped long on BTC just before the latest 4H breakout — catching an 11.39% move with perfect histogram and EMA alignment.
🔍 Here’s what happened:
– Histogram flipped positive on July 23
– EMA filter cleared — clean long trigger
– Histogram rose into a momentum peak
– Strategy closed just before consolidation
This is exactly what the Liquidity Tracker was built for:
✅ Spot clean trend shifts
✅ Confirm strength via momentum
✅ Filter out noise using EMAs
⚙️ Settings Used:
– MACD: 25 Fast / 60 Slow / 220 Signal
– EMA Filter: 50 / 9 / 3
– Entry Mode: Histogram + Crossover Combo

BTCUSD BUY 109270On the daily chart, BTCUSD is experiencing a pullback from its highs, with short-term bears taking advantage. Currently, attention can be paid to the support level near 109270, which is a potential buy level for a bullish bat pattern and is within the previous demand zone.

FART coin Short x10Short 10x
Entry $0.9297 on the 20EMA
Target $0.893 on the Trend line
Stop $0.937 above candle on the 20EMA
Add B/E when it hits $0.917
Risk 5/10

#SOLUSDT: Price to turn extreme bullish! Get ReadyHey there everyone! 👋
I’ve got some updates on the BINANCE:SOLUSDT price. It’s been testing a crucial level, and it’s showing some really strong bullish signs and patterns. But here’s the thing, we’re starting to think there might be a possible reversal coming up in the next few days. If we’re right, the price could hit all three targets we’ve been tracking.
Remember, though, that this is just our analysis, and it’s always a good idea to use accurate risk management when you’re trading.
Thanks for your support! 😊
If you want to help us out, here are a few things you can do:
- Like our ideas
- Comment on our ideas
- Share our ideas
Team Setupsfx_

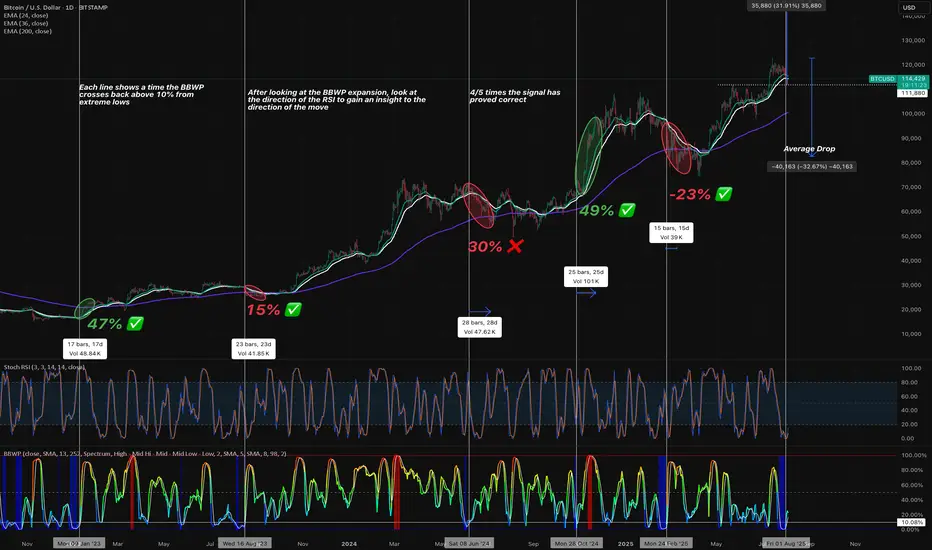
BTC Expansion BTC expansion after a low reading on BBWP. The stochastic RSI gives us an idea of the direction of the move.

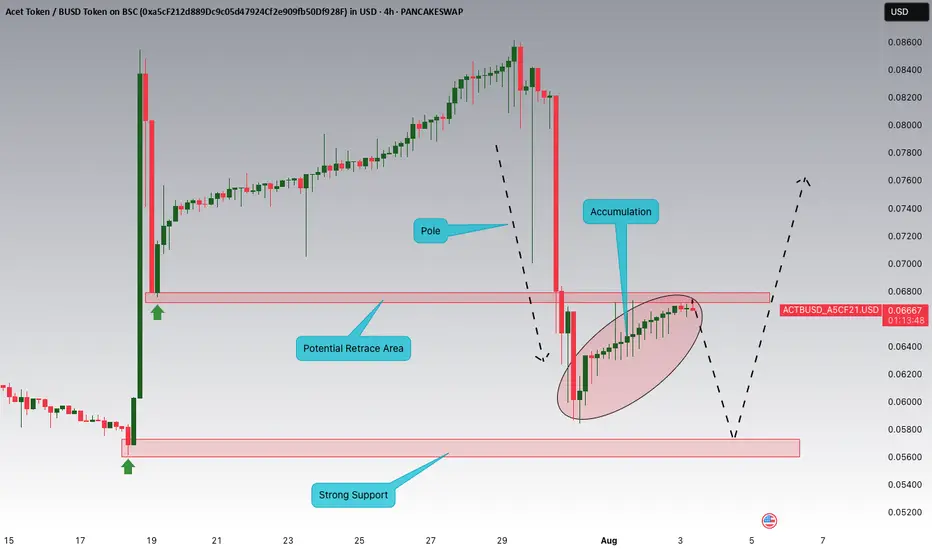
ACTBUSD Breakout and Potential RetraceHey Traders, above is a technical overview on ACTBUSD and the most important zones to watch.
BTC/USDTPossible AMD setup forming. Entry only after clear confirmation.
If validated, the target is a move toward new ATHs.
However, if downside pressure continues, we could see a correction below the $110K level.
Stay reactive — not predictive.
