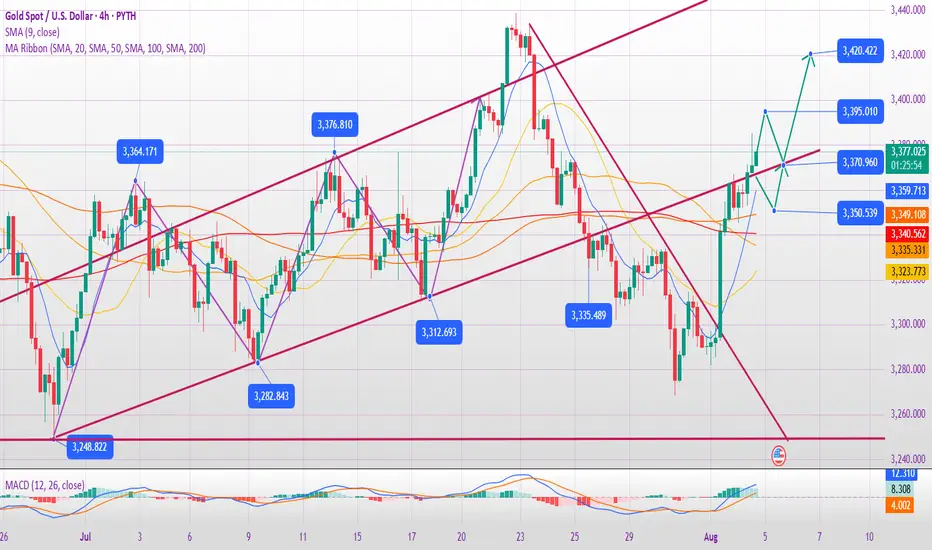
Will gold break through on August 5th?
1. Key News Drivers
✅ Expectations of a Fed Rate Cut Strengthen (Core Logic)
Weak non-farm payroll data (the probability of a September rate cut soars to 90%) leads the market to anticipate two rate cuts this year, with the first likely in September.
The US dollar weakens: expectations of interest rate cuts suppress the US dollar, and the attractiveness of gold as an interest-free asset increases.
✅ Rising risk aversion
Trump's tariff policy has sparked trade concerns, compounded by global economic uncertainty (such as a slowdown in Europe and geopolitical risks).
Fragile market sentiment: If subsequent economic data (such as CPI and retail sales) falls short of expectations, gold could rally further.
⚠️ Risk Warning: If Fed officials signal hawkishness (such as downplaying rate cuts) or if economic data rebounds, gold could experience a short-term correction.
2. Key Technical Signals
📈 Bullish Trend Confirmation Conditions:
A break above $3,375 (previous resistance level) opens up upside potential, with targets between $3,390 and $3,400, or even $3,450. Hold the support of 3335 (bull defense line). If the pullback does not break this level, the trend will remain strong.
📉 Pullback Risk Warning:
If 3335 is broken, a pullback to 3300 (a key psychological barrier) is possible, turning into a volatile market.
4-hour chart is overbought: Be wary of short-term profit-taking after consecutive days of gains.
🔍 Key Levels:
Resistance: 3375 → 3390-3400 → 3450
Support: 3360-3350 → 3335 → 3300
3. Today's Trading Strategy
🎯 Main Strategy: Buy on pullbacks (low-cost buying), supplemented by shorting at key resistance levels.
👉 Long Opportunities:
Conservatives: Enter after a pullback to 3360-3350 and stabilization. Stop loss at 3340, target at 3380-3390.
Aggressive: If it breaks through 3375, go long with a light position, set a stop-loss at 3360, and target 3400.
👉 Short Opportunities:
Short if it first hits the 3390-3400 range and finds resistance, set a stop-loss at 3410, and target 3375-3360.
⚠️ Notes:
Avoid chasing the ups and downs, and wait for key levels to be confirmed.
If it falls below 3335, pause long positions and wait for support at 3300 before repositioning.
4. Medium- to Long-Term Outlook
Bull Market Start Signal: A weekly break above 3400 could confirm the start of the Fed's rate cut cycle.
Potential target: 3500-3600 (historical high area).
Risks: If US economic data improves or the Fed turns hawkish, gold could experience a deep correction to 3200-3150.
Summary
Short-term outlook: 3375 is the dividing line between bulls and bears. If it breaks through, go long; if it hits resistance, trade in a range.
Medium- to long-term: Focus on Fed policy and economic data. Trend-setting long positions should wait for clearer signals.
📌 Action suggestion: Give priority to callback of long orders during the day, strictly set stop-loss, and be wary of high-level shocks and washouts!
Crypto market
Bitcoin fixed above the $112k ┆ HolderStatOKX:BTCUSDT is recovering after touching the $111,940 zone, now confirmed as strong support. The price is reversing from the lower wedge boundary, suggesting renewed momentum. A clean push could retarget $122,250 in coming sessions.

avaxusdtThe Avaxusdt is in the two areas, one of the supports is 618, the corrective wave before, and one is dynamic support. If supported, it can rise to 0618.

SWELLUSDT: Bullish Reversal in Play, Targeting Higher LevelsFirstly, our Algo-based indicators are used to create this analysis. Follow me so you don't miss, Boost and leave your comments if you profited with our posts, so we may continue:
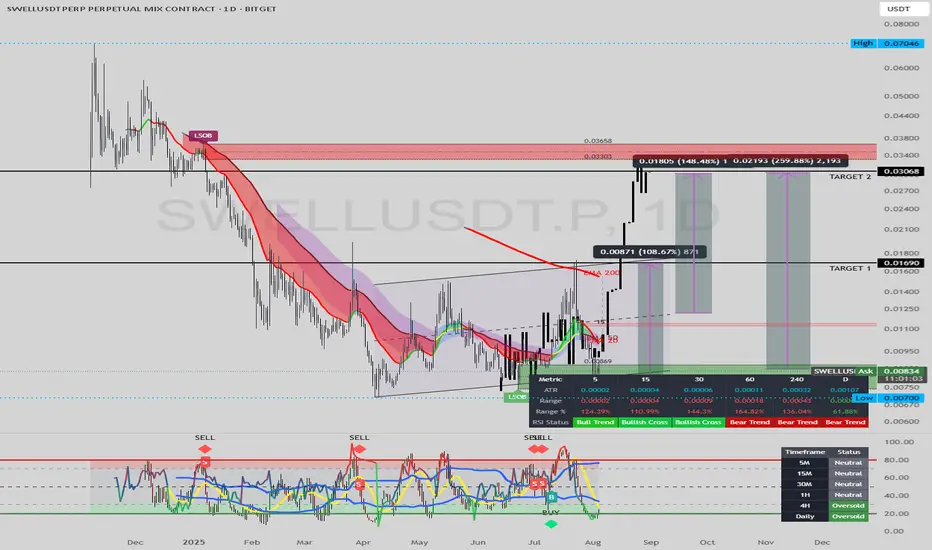
This daily chart for SWELLUSDT suggests that a bottoming formation has completed, and a new bullish trend is emerging, with significant upside potential.
Analysis:
Market Structure Shift: A key "Bearish Choch" (Change of Character) is indicated on the chart, signaling that the previous downtrend has likely reversed. Since hitting the low at $0.00700, the price has been establishing a series of higher lows, which is a foundational element of a new uptrend.
Accumulation and Support: The price has been consolidating in an ascending channel, finding consistent support along the lower trendline and the EMA 20. This indicates a period of accumulation by buyers.
Indicator Confluence:
The middle indicator (a variant of RSI) is also trending upwards within its own channel, recently bouncing off its support line. This mirrors and confirms the price action.
The bottom Innotrade MC Signal indicator has flashed a "B" (Buy) signal from the oversold territory and is projected to move higher, suggesting building bullish momentum.
Price Projection and Targets: The drawn black line illustrates a potential path for the price. It anticipates a rally from the current support level. The key objectives are:
TARGET 1 : $0.01690. This level represents a significant structural resistance and a break of the previous high.
TARGET 2: $0.03068. This target aligns with a major "FVG" (Fair Value Gap) or price inefficiency, which often acts as a magnet for price.
Strategy:
Position: Long (Buy)
Entry: The current support zone around $0.0080 - $0.0085 is presented as a strategic entry area.
Targets: The primary targets for this bullish move are
0.01690
0.03068.
Conclusion:
With a confirmed market structure shift, strong support from multiple indicators, and clear upside targets, SWELLUSDT presents a compelling bullish setup. The current price level offers an opportunity to enter a potential new uptrend with significant room for growth.
Disclaimer: This analysis is for educational purposes only and should not be considered financial advice. Always conduct your own research and manage risk appropriately.
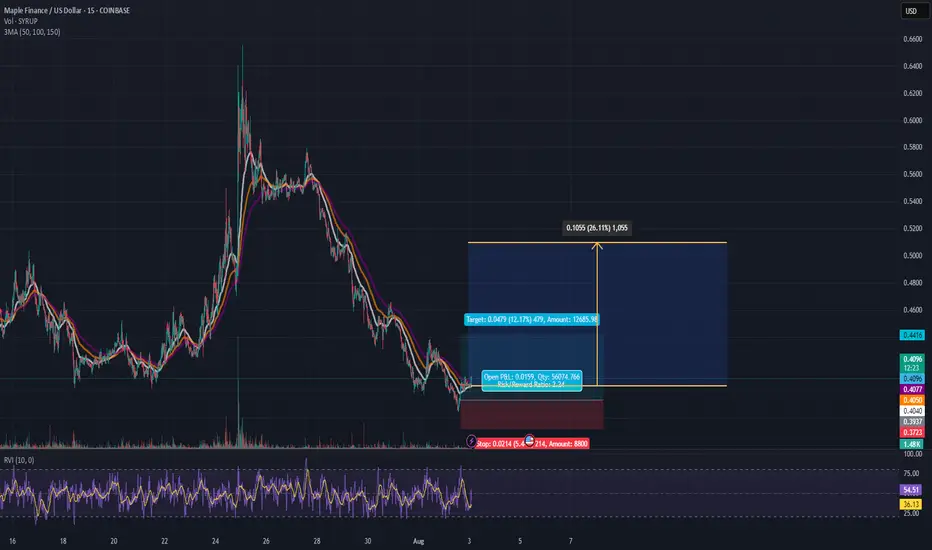
SYRUP Priming for a 12% Pop - Longterm ~20% PotentialHey Guys, My last posts were hidden (Again) ty TV, so I'm back at it and keeping it clean and to the point:
Maple Finance
SYRUPUSD
is forming a base at the $0.40 zone after a steep downtrend. Looks like the bleeding's slowing down and we're seeing signs of accumulation.
🍯 Entry: $0.402 - $0.4045
🛑 Stop: $0.3825 (5.4% risk)
🎯 Target 1: $0.4479 (+12.1%)
🚀 Target 2: $0.5100 (+20.6%)
📐 R/R Ratio: ~2.2
This is a structure-based long setup:
Flattening EMAs
Volume compression
Lower wick absorption (buyer presence showing up quietly)
💡 Target 2 ($0.5100) is not a short-term scalp – that's the stretch target IF this turns into full accumulation. Full exit at T1 is a solid take.
More setups on the way.
Xrp/Btc✨ Ripple vs Bitcoin — awakening from a long slumber?
📍 August 2025, Monthly Chart
A decade of swinging
between historic peaks and the heavy shadow of silence...
Now, XRP rests at 0.000026 BTC,
as if slowly awakening after years of dormancy.
🔸 RSI has moved off historic lows, gaining strength.
🔸 The long-term moving average (red) is drawing closer to price.
🔸 Key resistances ahead:
▫️ 0.000097 → 38.2% Fib
▫️ 0.000125 → 50% Fib
▫️ 0.000153 → golden 0.618 Fib.
🔮 Scenarios:
1️⃣ Break above 0.000097 → a mid-term wave toward 0.000153.
2️⃣ Failure to break → a pullback toward the 0.000062 ~ 0.000058 support zone.
📌 Is Ripple finally awakening?
Or is this just another breath before the next slumber?
Time will tell... ⏳

#GALA/USDT Sustain the Current Bullish Momentum or Will it Fal#GALA
The price is moving within an ascending channel on the 1-hour frame, adhering well to it, and is poised to break it strongly upwards and retest it.
We have support from the lower boundary of the ascending channel, at 0.01420.
We have a downtrend on the RSI indicator that is about to break and retest, supporting the upside.
There is a key support area (in green) at 0.01392, which represents a strong basis for the upside.
Don't forget one simple thing: ease and capital.
When you reach the first target, save some money and then change your stop-loss order to an entry order.
For inquiries, please leave a comment.
We have a trend of stability above the Moving Average 100.
Entry price: 0.01550
First target: 0.01600
Second target: 0.01658
Third target: 0.01727
Don't forget one simple thing: ease and capital.
When you reach the first target, save some money and then change your stop-loss order to an entry order.
For inquiries, please leave a comment.
Thank you.

4RRI Think the likelihood that we may have finished moving down on bitcoin is over, however, even if that is not the case, This may be a nice trade!

HEI Bullish DivergenceBINANCE:HEIUSDT
Trade Setup:
Target 1: 0.3703 (0.786 Fibonnaci Golden Zone).
Target 2: 0.3856 (0.618 Fibonnaci Golden Zone).
Target 3: 0.3964 (0.5 Fibonnaci Golden Zone).
Target 4: 0.4420 (0 Fibonnaci).
Stop Loss: 0.3259 (1.272 Fibonnaci).
RSI Analysis: The RSI is showing a bullish divergence, suggesting potential bullish momentum. The current RSI is around 17.39, approaching oversold territory, so caution is advised.

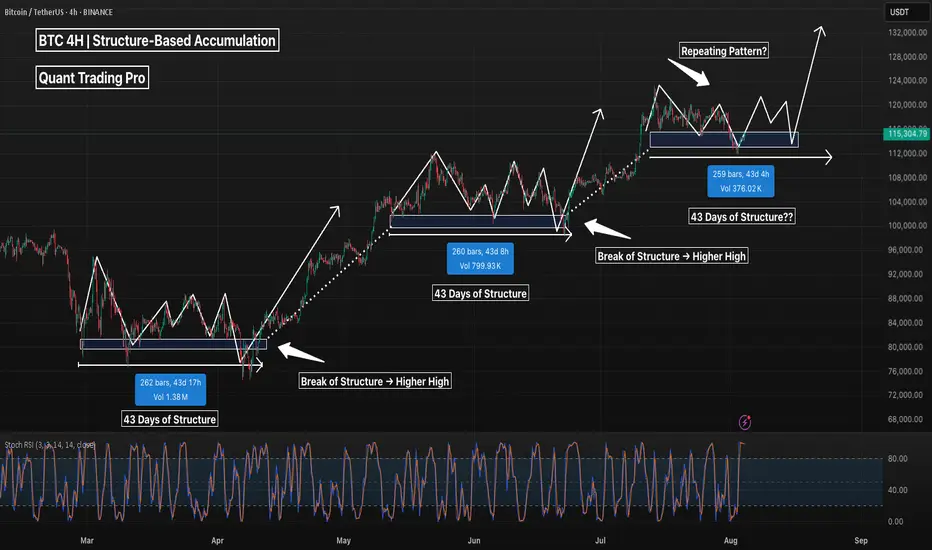
BTC 4H – Repeating Accumulation Pattern, But Will It Hold Again?Bitcoin has shown a clear structural tendency to consolidate for ~43 days at key demand zones before breaking to new highs. This 4H chart highlights three nearly identical accumulation phases, each lasting around 260 bars with a clear base, fakeout, and bullish continuation.
We’re now sitting in the fourth demand zone, with price revisiting the same volume pocket and reclaiming key structure. If history repeats, we may be looking at another breakout leg above $124K+.
Key observations:
– Each consolidation zone lasted ~43 days
– Volume decreases into the base → demand absorption
– Reclaim of structure precedes each leg up
– Current consolidation mirrors previous 3 (in time, shape, and volume)
⚠️ A clean break below ~$112K would invalidate the pattern and suggest deeper retracement.
Are we seeing another accumulation leg… or distribution in disguise?
Drop your thoughts below.
#Bitcoin #BTCUSDT #Crypto #TradingView #PriceAction #MarketStructure #BTC4H #CryptoAnalysis #Accumulation #Wyckoff #SwingTrading #PatternRecognition #TechnicalAnalysis
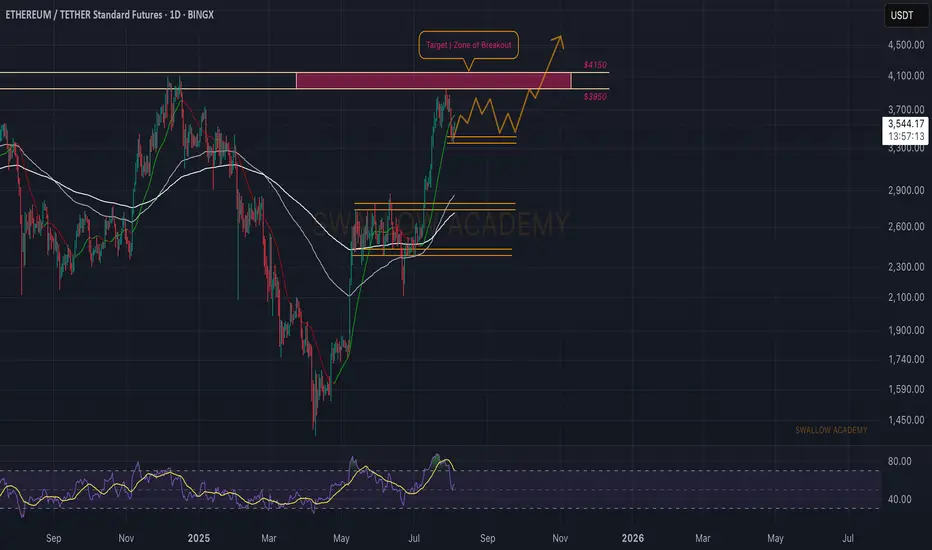
Ethereum (ETH): Zone of Rejection Turning Into Zone of BreakoutSince last time, we were looking for a zone of rejection, which happened as well, where price had a smaller pullback, and now upon the start of a new week, we might be seeing the start of recovery as well.
Which means, as long as we are above the $3,350 zone (which is the local low area), we are bullish; if we break that zone, this would be the ideal area for a short!
Swallow Academy
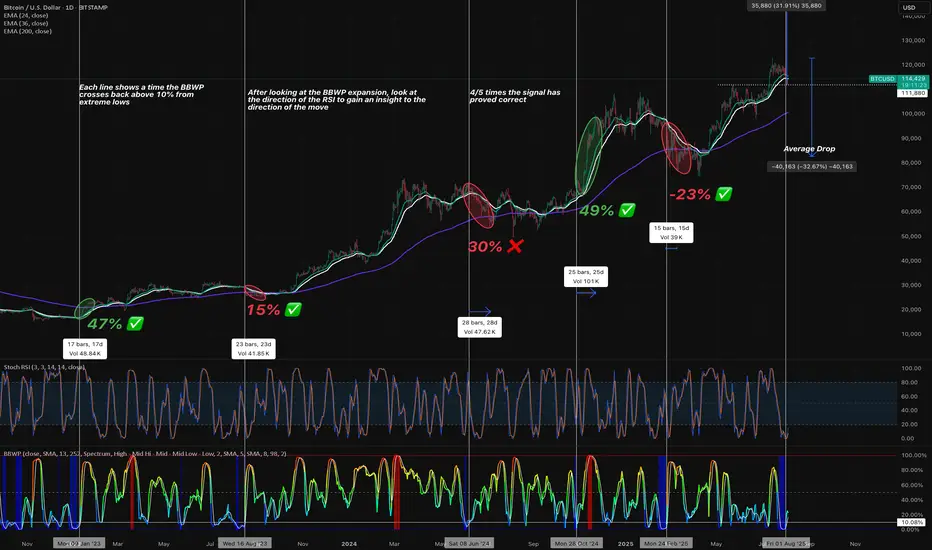
BTC Expansion BTC expansion after a low reading on BBWP. The stochastic RSI gives us an idea of the direction of the move.
Bullish ETH!!!My inverse head and shoulder pattern played out close to perfect, as seen in pic.
Recent bullish move also, made perfect move to downside, with rsi at rock bottom and hitting target perfectly, I say the next bullish move woll break out and hit the new target as seen in pic.
Come on eth!!!

Market - BTC - ETH Analysis
💎 Market - BTC - ETH Analysis💎
🟠 Current Market Status: ⚠️ / Low Risk-Reward ❗️ / Avoid Overtrading 🚫
🔷 BTC/USDT (Multi-Timeframe Analysis)
• Weekly (HWC): Last week’s red candle tapped into a buyer zone. A balance or sideways movement is likely this week.
• Daily (MWC): Minor retracement in a downtrend. No clear bullish reversal yet.
• 4H (LWC): Still in a downtrend. For a bullish reversal, we need a Higher Low (HL) followed by a break of the previous High.
• 1H: Breakout above level 116 would signal a short-term trend reversal. Breaking the upper channel confirms bullish continuation in the lower timeframe.
✅ Strategy Outlook:
• HWC: Bullish
• MWC: Bullish
• LWC: Bearish
→ We're not shorting based on LWC unless it turns bullish or MWC flips bearish.
🕒 Conclusion: Stay on the sidelines until the structure shifts clearly.
🔶 BTC Dominance (BTC.D)
• Currently rejected in the 4H chart, but not yet a confirmed bearish structure.
🧭 Two setups to watch before rotating into altcoins:
1. Clear lower highs and lower lows in 1H and 4H
2. Box formation and breakdown in lower timeframes
🚨 Key Level: A break below 60.40 may trigger sharp altcoin rallies.
🌐 TOTAL / TOTAL2 / TOTAL3
• All three charts share a similar structure.
• 1H TOTAL: Break of 4.72 confirms a V-pattern and may trigger upside momentum.
• TOTAL2: Watch 1.42 as a critical level.
→ Until then: No action – Wait for breakout confirmation.
💵 USDT Dominance (USDT.D)
• Ideally should not retrace beyond 4.64 – if it forms a top here, that’s a bullish sign for the market.
• Level 4.44 is less relevant for now.
• Failure to reclaim 4.53 increases the importance of 4.64.
• If it starts dropping, enter before a breakdown of 4.13 to stay ahead of bearish pressure.
🟠 ETH/BTC
• Consolidating in a 4H box.
• Break of 0.03278 is a trigger for long ETH exposure — ideally hold post-breakout.
• Wait for SMA7 on the Daily to turn upward for stronger confirmation.
• Break of 0.03288 on ETH/BTC likely aligns with $3850–$4000 breakout on ETH/USDT.
→ Position should be taken before this breakout to catch the move early.
📌 Final Note:
We are in a low momentum, low R/R environment.
Only trade confirmed breakouts and structural shifts.
Avoid overtrading, keep risk exposure limited, and rely on higher-timeframe confluences for clearer direction.

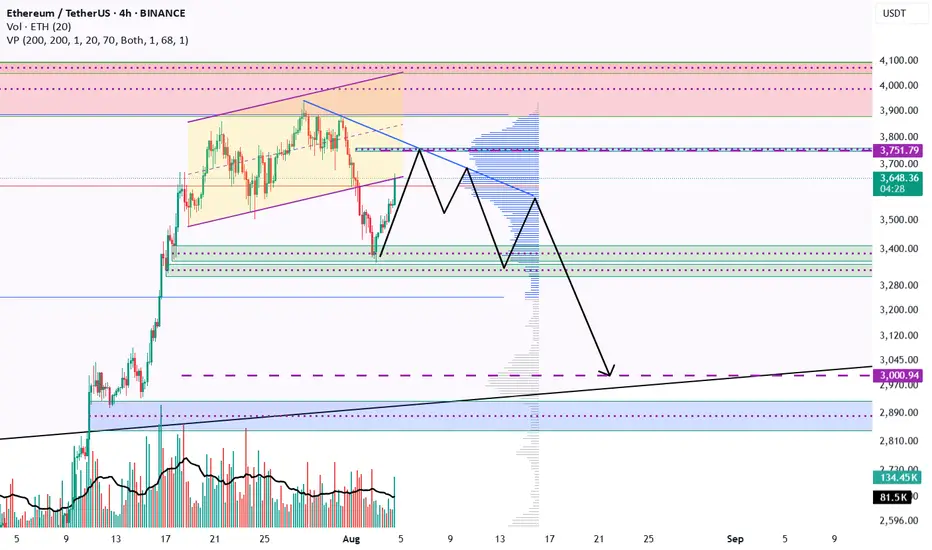
Ethereum Technical Update: $3,750 Target with $3,000 Correction Ethereum could rise to $3,750, and the correction may continue down to $3,000 by the end of August.
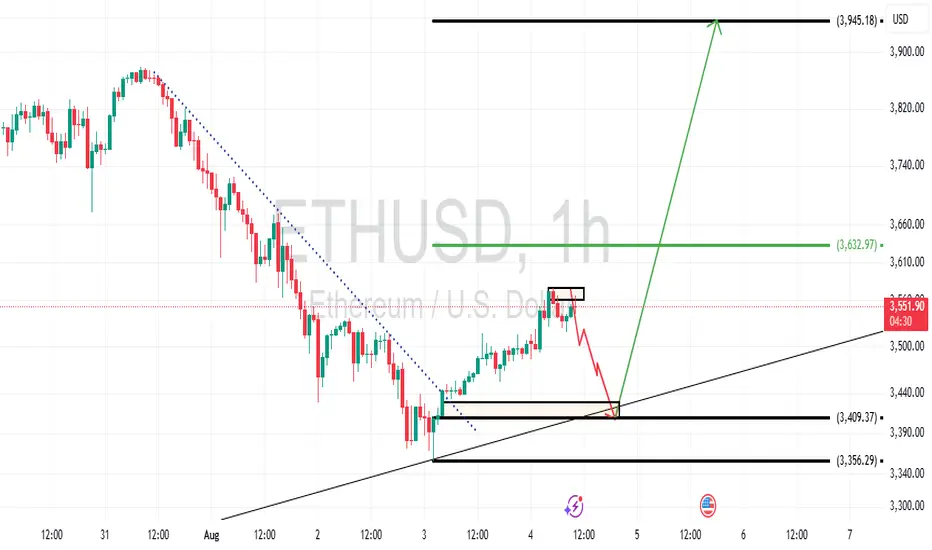
Eth/Usd Possible pathEthereum declared a possible bullish move that pends a retest. Depending on the momentum of the market, the market is likely to retest today or tomorrow in order to keep the week bullish.
TRXUSD – Above the CloudsTRX surged back above its 200 SMA, now at $0.33040, just below resistance. RSI at 63.5 remains strong. Price is riding an aggressive rally channel with strong follow-through potential.

Long-Term Spot Technical Analysis of INJ CoinWhen evaluating INJ coin for long-term spot investments, it is evident that the price continues its downward movement after being rejected from the daily resistance level at $16.33. If INJ fails to receive a strong buying reaction from the $13.16 support in the coming days, the downtrend is likely to persist.
Our preferred long-term spot entry zone lies between the $11.86 – $11.26 support range. If INJ retraces to the blue support zone marked on the chart, we intend to accumulate with a long-term target of $23.
As long as INJ continues to close daily candles above the $10 level, we will maintain our long-term spot positions. Should the price rebound from the $11.86 – $11.26 zone, our initial upside target will be $16.33.
Not Financial Advice (NFA).

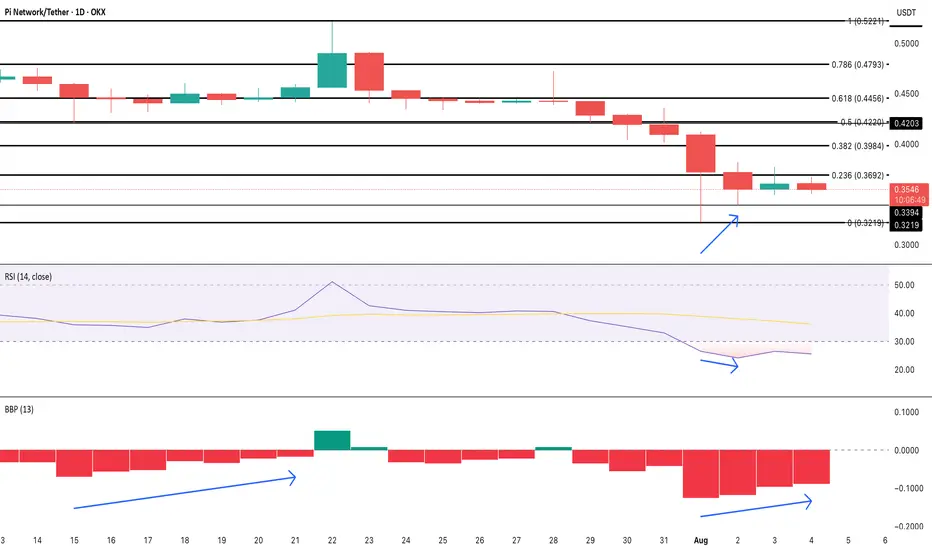
Pi Coin Bulls Whisper Comeback as Bears Ease OffOKX:PIUSDT has been in free fall, losing 25% over the past month and hitting fresh all-time lows. As of now, the OKX:PIUSDT price is holding around $0.35, hovering just above its recent bottom at $0.32. Despite the pressure, there’s a flicker of optimism on the charts.
The first encouraging sign comes from the Bull-Bear Power (BBP) indicator. This tool tracks the strength of bulls vs. bears by comparing price extremes with a moving average. Since August 1, BBP has been rising, flipping from a deeply negative zone to a softer print. That same behavior last occurred in mid-July, just before a bounce from $0.45 to $0.52. It’s not a confirmation, but it’s not nothing.
Backing this up is the RSI (Relative Strength Index), which has formed a hidden bullish divergence on the 4-hour chart. While the RSI dipped lower, price held a higher low; a classic setup that often appears right before continuation moves in an uptrend. RSI is still at 23, deep in oversold territory, but this divergence hints that sellers may be tiring.
There’s a sentiment twist too. OKX:PIUSDT ’s social dominance, its share of overall crypto discussion, has jumped three sessions in a row. This mirrors the chatter spike seen before the last short-term rally, suggesting that market attention is returning at a potentially pivotal moment.
Still, nothing breaks unless the price does. OKX:PIUSDT must close above $0.36 to even test resistance at $0.39. These levels are drawn from the Fibonacci retracement anchored from $0.52 to $0.32. Only above $0.39 can bulls breathe easier. Below $0.32? That invalidates the whole setup and leaves the door open for lower lows.
day 3 supported my MAs looking to hold till it hit tp or until the close of day 3. break even at 1:2 r:r

BTCUSD going to touch 116,800BITSTAMP:BTCUSD Long trade, with my back testing of this strategy, BTCUSD need to touch 116,800
This is good trade, don't overload your risk like greedy, be disciplined trader, this is good trade.
Use proper risk management
Looks like good trade.
Lets monitor.
Use proper risk management.
Disclaimer: only idea, not advice

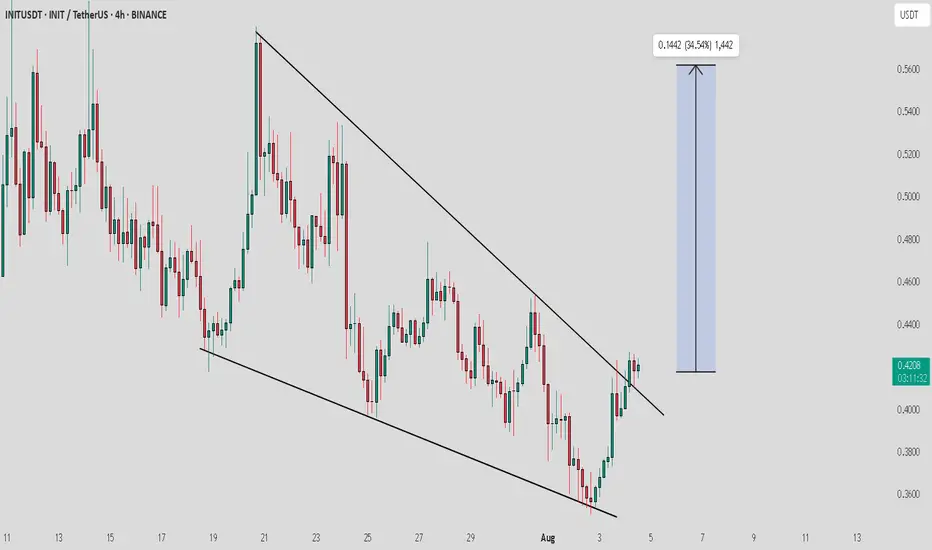
INIT / USDT : Momentum building..Keep a close watchINIT/USDT Breakout Alert
INIT/USDT is showing a strong breakout from a descending channel pattern, signaling a potential bullish move. This setup has great potential, and if the breakout continues, we could see significant upward momentum.
Target: Keep an eye on the next resistance levels, with a move potentially reaching towards $0.5.
SUI’s Next Big Move? Key Levels You Must WatchHey friends, it’s Skeptic 🩵
In this video, I’m diving into the current setup on SUI – whether to long or short, plus an update on market context and risk zones.
I broke down key levels, previous triggers, and what price action is hinting at next.
This one’s packed with insights, especially if you're in futures or looking for an entry on spot.
⚠️ Don’t forget about risk management – chasing pumps is a recipe for FOMO and mistakes.
💬 Let me know your thoughts on SUI in the comments, and let’s talk setups.
