Eth/Btc✨ Ethereum vs Bitcoin — perhaps a new season is near...
📍 First week of August 2025
From the depths of a long, quiet downtrend,
Ethereum has risen from the 0.018 ~ 0.022 BTC zone...
Where unseen hands quietly caught the fall.
Now standing at 0.031 BTC:
RSI has regained strength, entering bullish territory.
Moving averages are converging — hinting at a possible shift.
All eyes now on the major resistance at 0.042 BTC...
🔮 Possible scenarios:
1️⃣ A breakout above 0.042 BTC → a path toward 0.057 and beyond.
2️⃣ Failure to break resistance → a return to the same mysterious yellow box.
📌 For now, the market breathes with renewed energy...
But is this the renaissance of ETH against BTC?
Or just another dance before the next calm?
🕊️ Patience remains our greatest ally...
Crypto market

LINK Targets $21.60 with Bullish MomentumLINK Targets $21.60 with Bullish Momentum
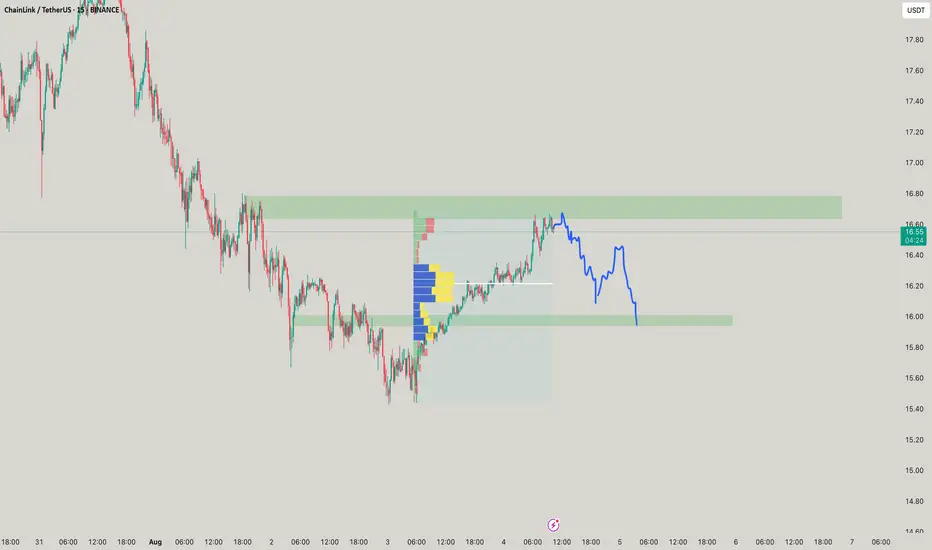
After Bitcoin’s explosive surge to $118800, the entire crypto market is on fire, and Chainlink (LINK) is one of the standouts.
LINK has broken out of a well-defined bullish pattern and continues its upward push since yesterday.
If you're already in the trade, consider holding your position, as LINK shows strong potential to reach $17.60, $19.60, and possibly even $21.60.
If you're not yet in, an ideal entry zone to monitor is around $14.00 to $14.50.
Momentum remains strong, and the breakout structure supports further upside.
You may find more details in the chart!
Thank you and Good Luck!
PS: Please support with a like or comment if you find this analysis useful for your trading day

Aug 4, 2025 -- ETHUSDT.PMarket can expand after this retracement. If it doesn't give any indication to move higher we can expect deeper retracement or reversal. If it expands now, it has a strong resistance around 4000 level. If that breaks, way up. If not, we at least get long till the major resistance. Currently, price is in a sensitive zone, if we get Daily/4H indication of running lower, we short. If it displaces upwards on Daily/4H we long. On any side here, we wait for the first expansion move.

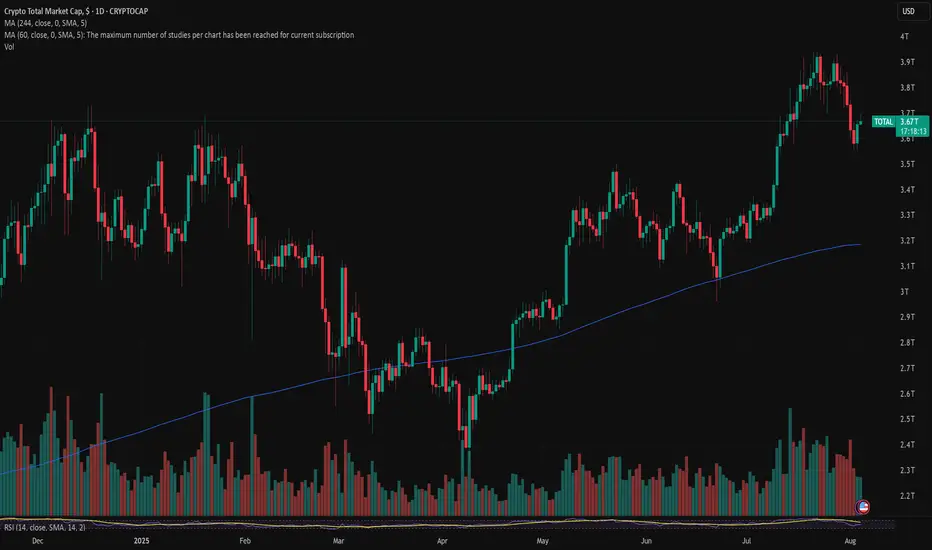
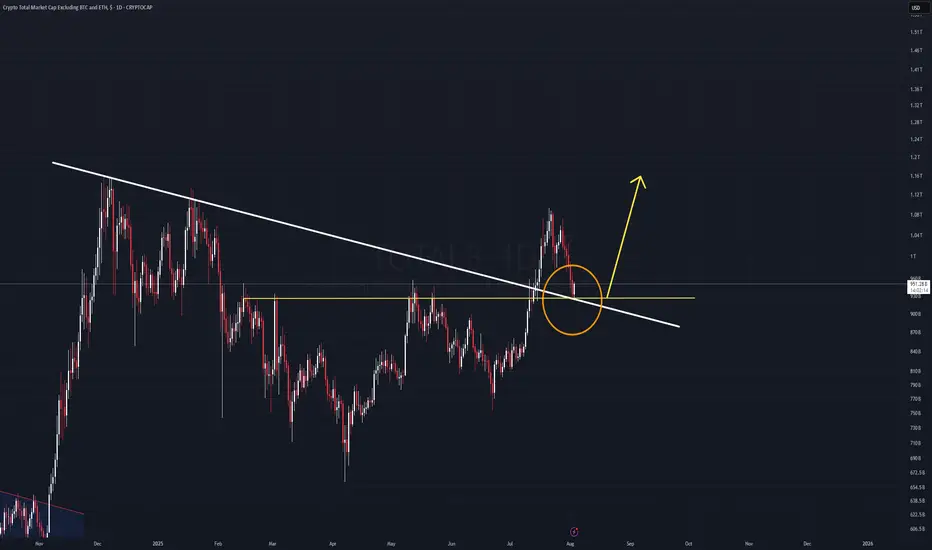
TOTAL 3 Analysis (1D)The TOTAL3 chart is currently retesting a key diagonal trendline that was broken previously. This is a classic bullish retest scenario.
If the current daily candle closes green, and is followed by a strong impulsive candle without invalidation, it could signal the start of a new leg upward, right from this zone.
The $900B market cap level remains the key support.
As long as TOTAL3 holds above this threshold, the bullish bias remains intact.
This structure could lead to momentum across the altcoin market.
CVX/USDT: Long-Term Breakout Signals Massive Upside PotentialFirstly, our Algo-based indicators are used to create this analysis: DON'T MISS US. FOLLOW US, COMMENT AND BOOST.
This weekly chart for CVX/USDT reveals a major bullish breakout from a long-term pattern, suggesting that the asset may be in the early stages of a significant new uptrend.
Analysis:
Descending Channel Breakout: For over two years, CVX has been trading within a clear descending channel. Recently, the price has decisively broken out of this channel to the upside, signaling a major shift from a bearish to a bullish market structure.
Pullback and Reentry: Following the initial powerful breakout, the price executed a healthy pullback. It found support right around the key 50% Fibonacci retracement level (approximately $4.262). The chart notes this area as a potential "REENTRY" point, especially with the formation of a "W-Pattern" (double bottom) on a smaller timeframe, which is a classic bullish reversal signal.
Confirmation Indicators:
The Innotrade MC Signal indicator at the bottom shows multiple "BUY" signals in the recent accumulation zone and the indicator line is now trending upwards, suggesting building momentum.
The RSI status confirms a "Bull Trend" on the daily and weekly timeframes, supporting a long-term bullish outlook.
Price Targets: Based on Fibonacci extension levels from the recent major swing, several targets are identified:
TP 1: $12.243 (aligns with the 127.20% extension and a previous key resistance level).
TP 2: $19.726 (aligns with the 161.80% extension).
Long-Term Projection: The aggressive black line projects a potential move towards the 2022 highs, indicating massive long-term potential if the bullish momentum continues.
Strategy:
Position: Long (Buy)
Entry: The current price level around $4.30 - $5.00 is highlighted as a strategic reentry zone following the successful pullback.
Targets: The primary targets are
12.243
∗
∗
a
n
d
∗
∗
12.243∗∗and∗∗
19.726.
Conclusion:
The breakout from a multi-year descending channel, combined with a successful retest of key support and confirming indicator signals, presents a compelling long-term bullish case for CVX. The current price level offers a strategic entry for a potential multi-hundred percent move towards the identified price targets.
Disclaimer: This analysis is for educational purposes only and should not be considered financial advice. Always conduct your own research and manage risk appropriately.

SOLANA'S GOLDEN CROSSSolana just printed a golden cross on the daily chart, with the 50-day moving average crossing above the 200-day. That’s usually a bullish sign, but here’s the kicker – price is sitting right at the crossover point, which is when these signals actually matter. That said, it is hard to tell if both MAs are support or resistance until the day closes.
Instead of running higher, SOL is hovering in no man’s land, stuck between two big levels: resistance around $187 and support near $140. After a nasty pullback from the $200s, price bounced at the moving average cluster, but hasn’t done much since. If bulls step in and push us back toward $170+, the golden cross could play out nicely. But if we drop below $155, it starts to look like just another fakeout. Either way, the next move should be telling.

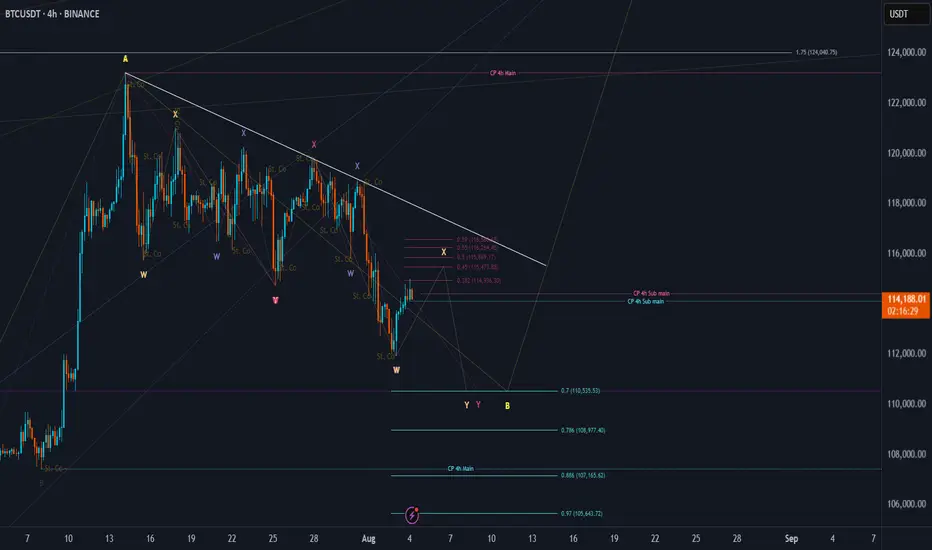
BTC Price Prediction and Elliott Wave AnalysisHello friends,
>> Thank you for joining me in my analysis. I think we need to extend the pink wave Y as wxy in purple counting => W, and then XY as orange counting. This all happened after getting the green D with not preferred closing as I mentioned yesterday.
Keep liking and supporting me to continue. See you soon!
Thanks, bros
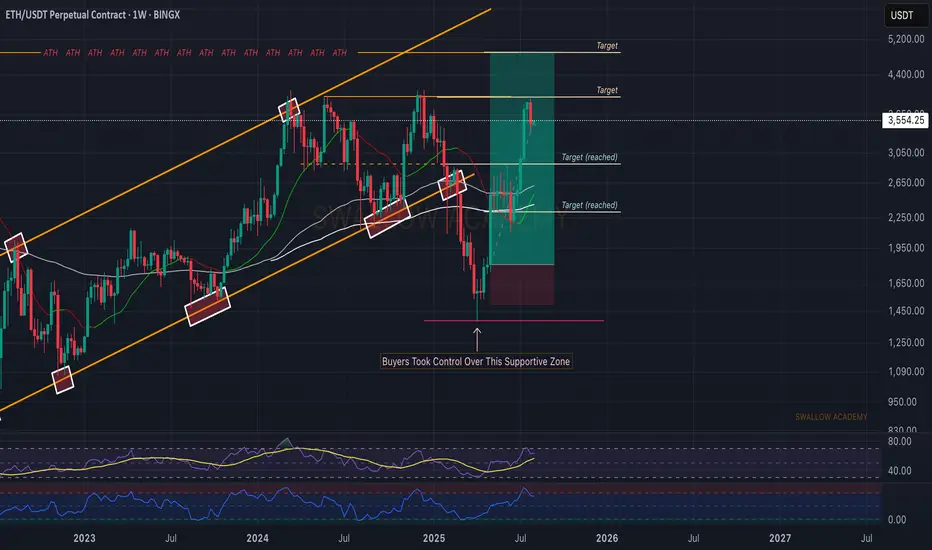
Ethereum (ETH): Looking For Break of $4000 | We Are BullishETH is still bullish in our opinion;recently we had a really good upside movement that got stopped right before reaching the $4000 zone.
Now we had a smaller pullback, which is normal as we had a really strong upside movement so we see it as a natural pullback, which will give us another bounce opportunity (accumulation zone).
Since our entry we have had a good movement, and we are keeping the position open until we reach the ATH zone!
Swallow Academy
BTCUSD long setup: Targeting the next bull move.Hello IGT FOLLOWERS
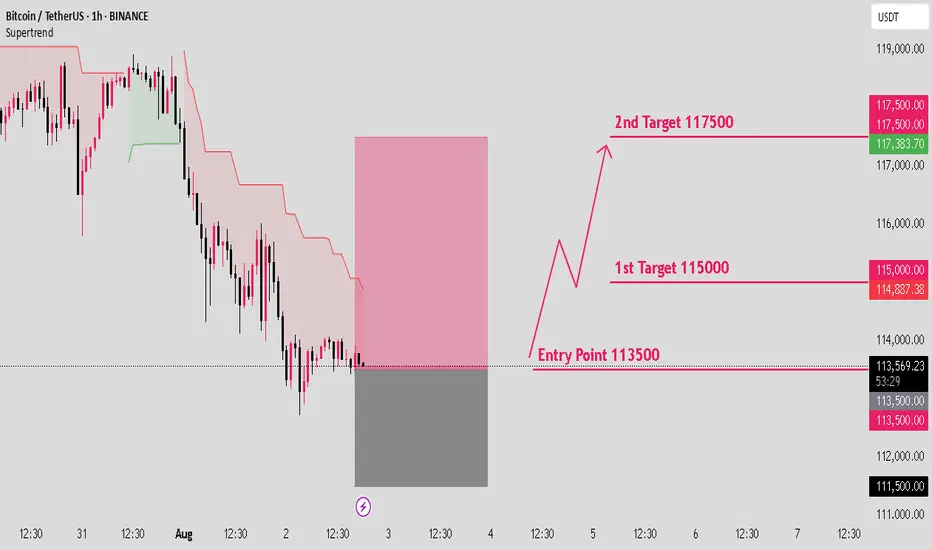
Here is my BTCUSD overview, Bitcoin is showing bullish momentum after holding strong support near $112,000. A breakout above the $115000 resistance suggests buyers are regaining control. RSI is turning upward, and volume is increasing on green candles signaling demand. As long as price holds above $113,000, bulls may push toward the $117,500 target.
Key points :
Entry point : 113500
1st Target : 115000
2nd Target : 117500
Follow me for more latest updates and signals
VIRTUAL/USDT – Rebound Incoming or Deeper Collapse?🔍 Overview: Bearish Pressure, But Structure Holds
VIRTUAL/USDT is currently consolidating within a well-defined Descending Channel pattern that has been forming since early May 2025. While the trend is bearish, price action remains within a controlled structure — a potential sign of hidden accumulation or smart-money positioning.
What makes this setup compelling is that price has just touched the lower boundary of the channel while also interacting with a historical demand zone around 1.20–1.25 USDT, which previously triggered a strong rally back in May.
---
🧠 Key Technical Pattern: Descending Channel + Historical Demand Zone
Descending Channel → Suggests consistent selling pressure but within a structured range — no real breakdown yet.
Demand Zone (1.20 – 1.25 USDT) → A historically strong support level that has launched sharp upward moves in the past.
Decreasing Volume → Could indicate weakening bearish momentum as price approaches key support.
---
📈 Bullish Scenario (Bounce from Support):
If the price manages to hold and forms a reversal signal (such as a bullish engulfing or hammer candle), we could see a relief rally toward key resistance levels.
🎯 Potential Bullish Targets:
1. 1.6787 USDT – Mid-channel resistance
2. 1.9000 USDT – Psychological and structural resistance
3. 2.0848 – 2.4571 USDT – Horizontal resistance zone and top of the channel
4. 3.7620 – 4.6267 USDT – Extended targets if breakout occurs with volume
📌 Bullish Confirmation Needed: A strong breakout above the channel midpoint + increasing volume to confirm a potential trend reversal.
---
📉 Bearish Scenario (Breakdown from Channel):
If the price fails to hold above the 1.20–1.25 support and breaks below the channel support, we may see increased selling pressure and a continuation of the downtrend.
🎯 Downside Targets:
1.00 USDT – Psychological support
0.90 – 0.70 USDT – Previous accumulation range
0.4110 USDT – All-time low and ultimate downside target
🚨 A strong breakdown with high volume could trigger panic selling and a prolonged bearish leg.
---
🎯 Conclusion:
> VIRTUAL/USDT is at a pivotal decision point — hold and bounce, or break and slide.
The structure is still intact, and the price is testing two critical technical zones simultaneously: the descending channel support and a major demand area.
This is not the time to chase price, but to observe and prepare for confirmation. A strong signal here could set the tone for the next major move.
#VirtualUSDT #CryptoTechnicalAnalysis #DescendingChannel #DemandZone #ReversalSignal #AltcoinAnalysis #CryptoTradingSetup #PriceActionTrading #SupportResistance

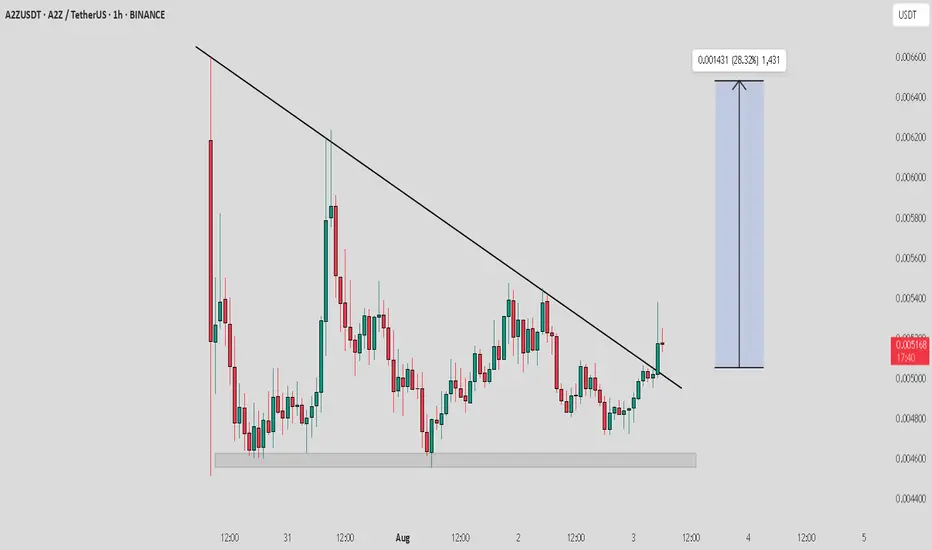
A2Z / USDT : Keep a close watch on retest proccessA2Z/USDT has broken out of a key trendline resistance and is now retesting the breakout zone.
This retest phase is critical — a successful hold here could trigger a sharp bullish move of 20-30% in the short term.
Volume confirmation and strong bullish candle on lower timeframes will add more confidence.
Keep it on your radar — next move could be quick.
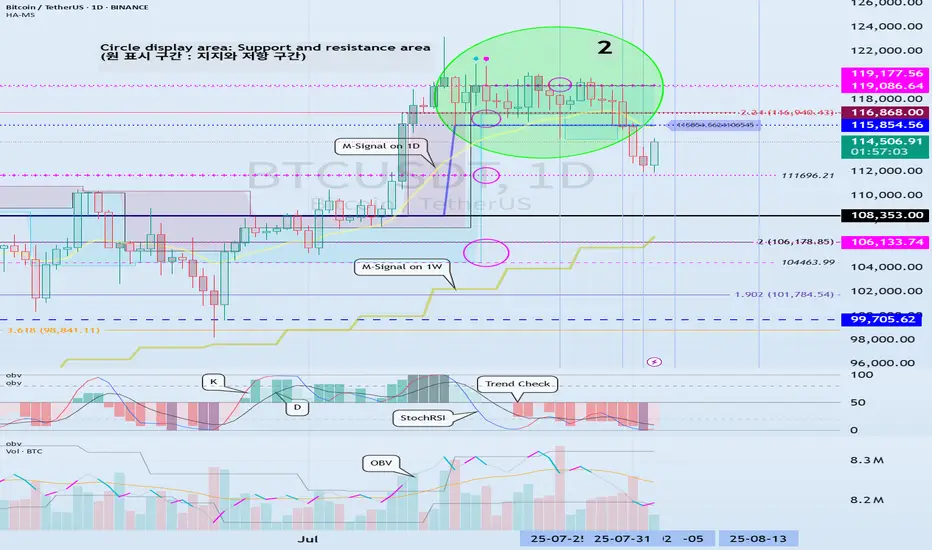
The key is whether it can rise above 115854.56
Hello, traders!
Follow us to get the latest information quickly.
Have a great day.
-------------------------------------
(BTCUSDT 1W chart)
The key is whether it can rise above the newly created DOM (60) indicator point of 119086.64.
If this fails and the price declines, we need to check for support near the previous all-time high (ATH) of 108,353.0.
Since the M-Signal indicator on the 1W chart is rising near 108,353.0, this area is expected to serve as important support and resistance.
-
(1D chart)
This period of volatility is expected to continue until August 6th.
Therefore, the key question is whether the price can rise above 115,854.56 and maintain its upward momentum.
If not, further declines are likely.
-
To rise above 115,856.56,
- The StochRSI indicator must rise within the oversold zone and remain above K > D.
- The On-Bottom Volume indicator must continue its upward trend with OBV > OBVEMA. - The TC (Trend Check) indicator should maintain an upward trend. (If possible, it's best to rise above the 0 point.)
If the above conditions are met and the price rises above 115854.56, it is expected to attempt to rise above 119177.56.
This period of volatility is a significant period of volatility.
Therefore, if the price falls below the HA-High ~ DOM(60) range and encounters resistance during this period, you should prepare for further declines.
-
The basic trading strategy is to buy in the DOM(-60) ~ HA-Low range and sell in the HA-High ~ DOM(60) range.
However, if the price rises in the HA-High ~ DOM(60) range, a stepwise upward trend is likely, while a decline in the DOM(-60) ~ HA-Low range is likely to result in a stepwise downward trend.
Therefore, a split trading strategy is recommended as the basic trading strategy.
When executing a trade, appropriate profit taking secures the liquidity of your investment, giving you the opportunity to seize new opportunities.
To achieve this, you should consider your intended investment horizon before initiating the trade and divide the trade accordingly.
-
The HA-Low indicator on the 1D chart is currently at 89294.25.
Therefore, I believe the market believes it's in a position to take profit.
-
Thank you for reading to the end.
I wish you successful trading.
--------------------------------------------------
- This is an explanation of the big picture.
(3-year bull market, 1-year bear market pattern)
I will explain in more detail when the bear market begins.
------------------------------------------------------
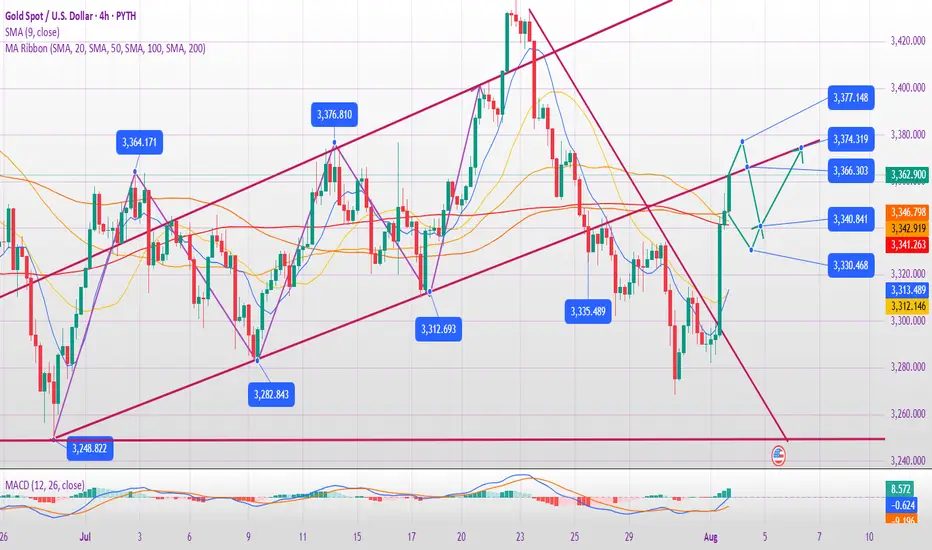
In-depth Analysis of the Gold Bull-Bear Game on August 4th:
I. Gold's Current Core Contradiction
Bull Support Factors
Weak non-farm payroll data reinforces expectations of a Fed rate cut, with the market betting on an over 80% probability of a September rate cut.
Risk Aversion: Although the tariff extension has not yet been finalized, the market remains concerned about escalating trade frictions, and gold is in high demand as a safe-haven asset.
Technical Breakout: Friday saw a strong breakout above the 3340-3350 resistance zone, with the daily chart showing a positive enveloping negative trend. Short-term bullish momentum prevails.
Potential Short-Term Opportunities
Monthly Top Signal: Consecutive high-level doji candlesticks with long upper shadows suggest medium-term selling pressure.
Fundamental Bearish Hidden Dangers:
The Fed's independence remains, and Powell may not cut interest rates prematurely due to pressure from Trump.
II. Key Technical Signals
1. Weekly Level: Range Unbroken
The 3268-3438 range persists, currently nearing its upper limit, so be wary of a pullback.
Bollinger Bands are converging, with the MA5/MA10 convergence signaling an approaching market reversal window.
2. Daily and short-term cycles: Overbought correction needs
After Friday's surge: 4-hour/1-hour RSI is overbought, the Bollinger Band opening is unsustainable, and a technical retracement is needed.
Key positions:
Resistance: 3376 (previous high) + 3385 (Fibonacci expansion level);
Support: 3340 (top and bottom conversion) + 3315 (bull defense line).
3. Triangle convergence pattern:
If it opens high and breaks through 3376 on Monday, August 4, it may test 3400; if it opens low and falls below 3340, it will look down to 3315-3280.
III. Operation strategy for next week on August 4
(1) Response to three opening scenarios
Scenario 1: Opening high (above 3370)
Strategy: Short in batches in the 3376-3385 area, stop loss at 3400, target 3340→3315.
Logic: Positive overdraft + technical overbought, betting on a pullback.
Scenario 2: Flat opening (around 3360)
Strategy: If the price rises from 3366 but does not break through, go short with a light position, stop loss at 3376, target 3340; if it falls below 3340, go short and look at 3315.
Alternative: If the support at 3340 is effective, go long, stop loss at 3330, target 3360.
Scenario 3: Low opening (below 3340)
Strategy: Go long in the 3338-3340 area, stop loss at 3325, target 3360; if it breaks through 3315, go short.
(2) Mid-term layout
Short opportunity: Go short in the 3385-3400 area, stop loss at 3420, target 3245 (monthly support).
Buy opportunity: If the price falls back to 3315-3280 at the beginning of the week and stabilizes, go long in the mid-term, stop loss at 3260, target 3400.
IV. Risks and Warnings
Beware of institutional manipulation: Friday's late-day surge may be a trap for buying; beware of a flash crash at Monday's opening.
Data disturbance: Pay close attention to the speeches of Fed officials. If inflation rebounds or hawkish remarks are made, it will be bearish for gold.
Undetermined trend: The market is still volatile and unilateral trends need to wait for confirmation of a breakthrough in the range.
Conclusion
Short-term: Prioritize shorting in the 3370-3385 area, and enter long positions in the 3340-3315 area when appropriate, maintaining strict stop-loss orders.
Mid-term: The monthly bearish pattern has not changed, and above 3385 is the ideal entry point for short positions.
Key Strategies: "Don't chase long positions during strong resistance; don't sell short during deep declines; follow the trend after a breakout; exercise caution in controlling the market."
PENDLE LONGFirstly, our Algo-based indicators are used to create this analysis:
This 4-hour chart for PENDLEUSDT highlights a potential short-term bullish outlook followed by a significant bearish opportunity at higher levels.
Analysis:
Current Situation: The price is currently trading around the 4.04 level after finding support in a key "Liquidity Sweep Order Block" zone, identified between approximately 3.6531 and 3.9397. This bounce comes after sweeping a recent low, suggesting a potential short-term reversal.
Bullish Scenario (Short-Term):
The immediate outlook appears bullish. With price holding within the green support block, a move upwards is anticipated. The Fibonacci retracement levels serve as potential targets:
Target 1: 50.0% Fib level at 4.2871
Target 2: 61.8% Fib level at 4.4520
Major Target: The previous high at 5.0175
The oscillator at the bottom of the chart supports this view, showing a move out of the oversold region, indicating building bullish momentum.
Bearish Scenario (Mid-Term):
The primary area of interest for a potential sell-off is the significant resistance zone labeled "Liquidity Sweep Order Block - SELL." This area begins around the previous high of 5.0175 and extends upwards towards the 6.50 region. The chart's projection suggests that if the price rallies into this zone, it is likely to face strong resistance, presenting a potential opportunity for a short position. The "Overbought" status on multiple timeframes (15M, 30M, 1H, 4H) could add confluence to an eventual reversal from this upper resistance.
Strategy:
BUY: Look for continued support within the current green order block (3.65 - 3.94). A confirmed bounce and hold above this zone could validate a long position, targeting the Fibonacci levels mentioned above.
SELL: Wait for the price to rally into the red resistance zone starting at 5.0175. A short entry could be considered if the price shows clear signs of rejection or bearish reversal patterns in this area.
Conclusion:
The chart presents a dual scenario: a potential buying opportunity on the current support followed by a significant selling opportunity at the upper resistance. Traders should watch price action carefully at these key levels before making any decisions.
Disclaimer: This is not financial advice. The analysis is for educational purposes only. Always conduct your own research and manage your risk accordingly.

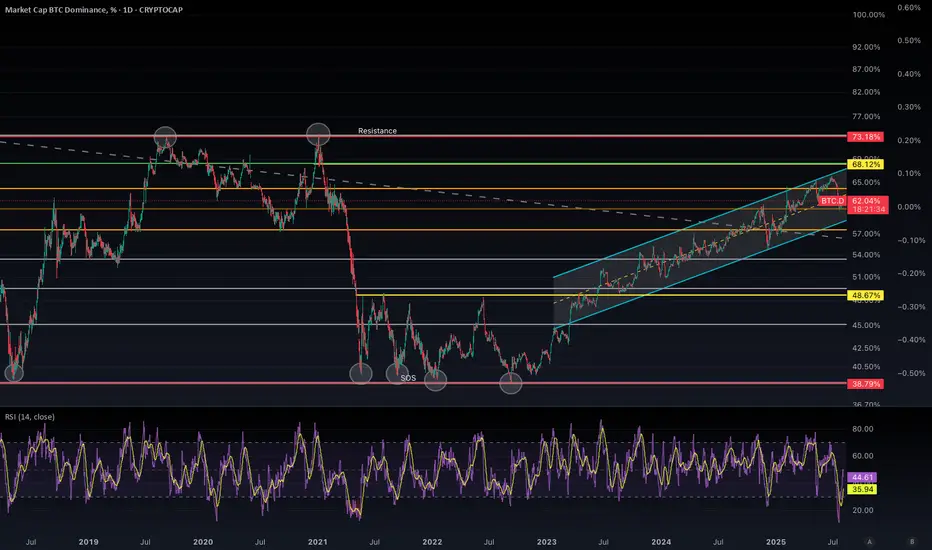
This Level Will Decide the Next Big Move in Crypto Markets🔍 General Chart Context
This chart tracks Bitcoin Dominance (% of total crypto market cap), currently sitting around 62.04%. BTC Dominance reflects Bitcoin’s market share vs altcoins — when it rises, BTC is outperforming alts; when it falls, altcoins are gaining.
🔄 RSI Analysis:
VERY IMPORTANT
BTC.D RSI against BTC RSI (daily candle)
BTC dominance dropped 46% from December 2020 - May 2021, while the price has dropped 55%. 6 months of bear market created an all time low for the RSI on the daily - rightfully so, RSI went all the way down to 10.
NOW (Last week)... the RSI has dropped down to the same level for the first time in 3 years! However, the difference is (outside the fact were already in a bull market) BTC dominance only dropped 10%. This is literlly music to my ears, massive sign of strength!
BTC RSI on the daily will use that 10-11 level as a support (historically speaking extremely low probability RSI will decline further) and continue rising until BTC price reaches $138K we could see a 68% dominance and a 80 RSI, after BTC price topping out, price will rotate into the ALT's starting the ALT season everyone has been waiting for late August and resulting in BTC to drop most likely to the 100K level. Which will be my next accumulation zone for the next big leg up over the new year.
🔁 Historical Levels & Key Zones
Resistance (73.18%): This is a long-term top marked with historical rejections (highlighted with circles).
Major Resistance Zones:
68%: Also a local high from prior cycle — current short-term resistance.
65%: Interim structural resistance, previously tested as a top and support.
🔮 Interpretation & Probabilities
🟩 Bullish Scenario (High Probability)
As long as BTC.D stays in the channel, the most likely path is a retest of 65%–68%.
RSI nearing oversold supports a relief bounce soon.
If BTC price continues up, altcoins may bleed further — pushing BTC.D higher.
Key levels to reclaim: 65% and 68%. If broken, next target is the cycle top (73%).
🟥 Bearish Scenario (Moderate-Low Probability for now)
If BTC.D breaks below the ascending channel and loses 60%, we could enter:
An altcoin-led market (altseason).
Watch for confirmation via RSI divergence, price structure break, and volume drop in BTC.D.
🧠 Macro View & Correlation to Crypto Market Cycles
The trend since late 2022 shows BTC regaining strength over altcoins — consistent with risk-off sentiment and macro uncertainty.
A move above 68% dominance typically signals BTC dominance in bull runs, often preceding parabolic BTC price increases. Something I am personally expecting moving into the new year.
Conversely, a breakdown from the channel would mark a risk-on phase — favouring alts.
✅ Conclusion
BTC.D is in a macro uptrend but approaching a critical test of channel support + RSI bounce zone. If 60% holds, expect a move back toward 65–68%. If it breaks, altcoin dominance could surge. This chart is pivotal for allocating between BTC and alts. BTC will eventually rotate into ALT coins creating a price drop in BTC and an increase in price with majority of ALTS. I believe this will happen after BTC tops out late august at $138000, then a true ALT season is necessary.
Disclaimer:
The content provided in this post is for informational and educational purposes only and should not be considered financial or investment advice. I am not a financial advisor, and this is not a recommendation to buy, sell, or hold any cryptocurrency, asset, or security. Always do your own research and consult with a qualified financial advisor before making any investment decisions. Trading and investing involve risk, and past performance does not guarantee future results.
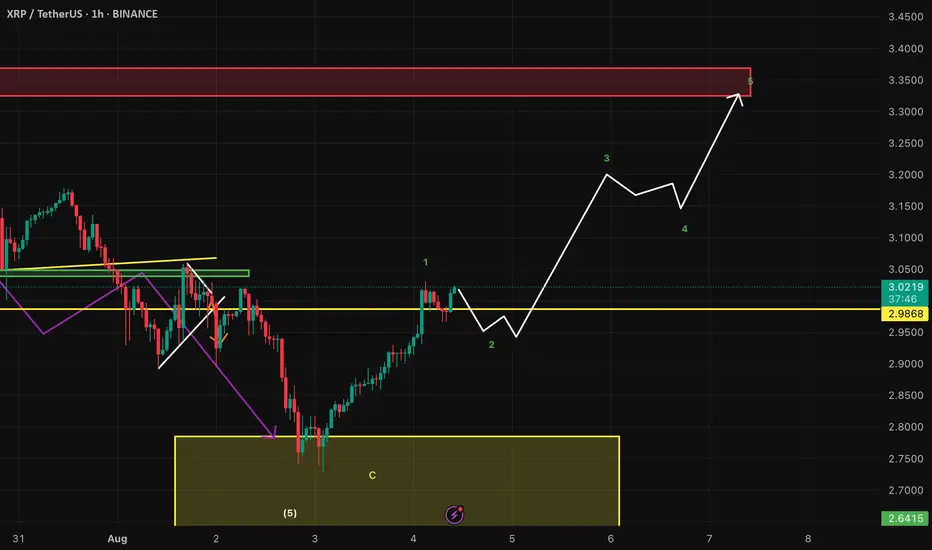
XRPUSD LongWe just finished the 5th wave as exspected and allready started the 1st wave of the next bullish move. I will wait for a correction and enter a long position.
Aug 4, 2025 -- BTCUSDT.PMarket can go to test the weekly Orderblock. If that OB breaks, we are in a reversal and market is more likely to run the HTF SSL. If it runs away from the OB and shows us the first sign of expansion, we can target BSL and beyond.

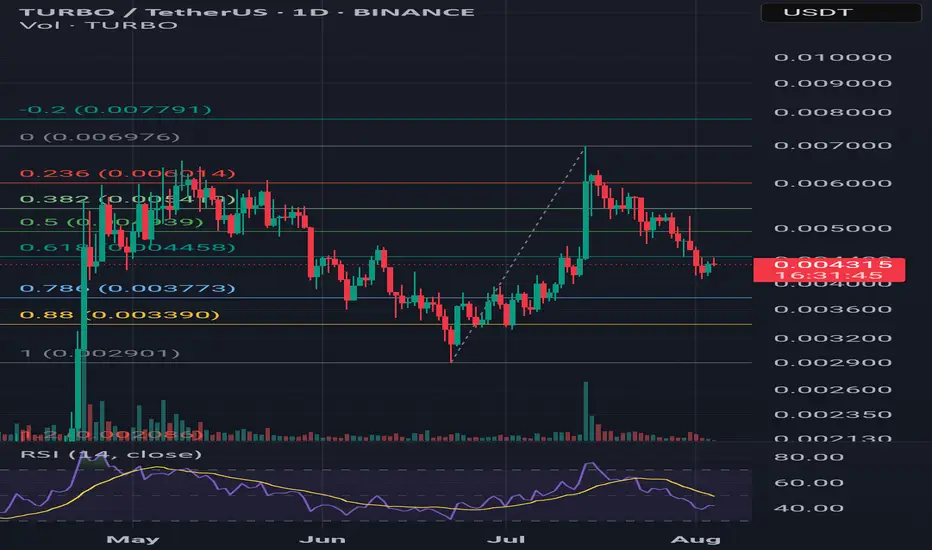
TURBO/USDT – Cup and Handle Formation (1D Chart)Overview:
TURBO/USDT is potentially forming a textbook Cup and Handle pattern on the 1-day chart. Price action suggests a rounded bottom (the “cup”) followed by a consolidation range (the “handle”), setting up for a possible breakout.
---
🔍 Pattern Structure:
- Cup Formation:
Price rallied from ~0.0029 to ~0.0060 USDT, retracing slightly from the top. This rounded rise resembles the classic cup shape.
- Handle Formation:
Recent price consolidation between 0.0042–0.0049 USDT hints at the formation of the handle. A breakout above resistance could validate the pattern.
---
📈 Key Technical Levels:
Entry Zone | 0.0047 – 0.0050 |
| Resistance (Breakout)| ~0.0060 |
| Target 1 | ~0.0064 |
| Target 2 | 0.0078 – 0.0084 |
| Stop Loss | Below 0.0042 |
🔄 Additional Indicators:
- Volume: Watch for increasing volume to confirm breakout momentum.
- RSI (14-day): Neutral zone with room for upward movement. Momentum is building.
- Fibonacci Levels: 0.618 retracement (~0.004458 USDT) has acted as a key support during handle formation.
---
💡 Idea: Monitor for a daily close above 0.0060 with volume confirmation. That could mark the beginning of a bullish continuation. Risk management is essential if price fails to hold above the handle support.
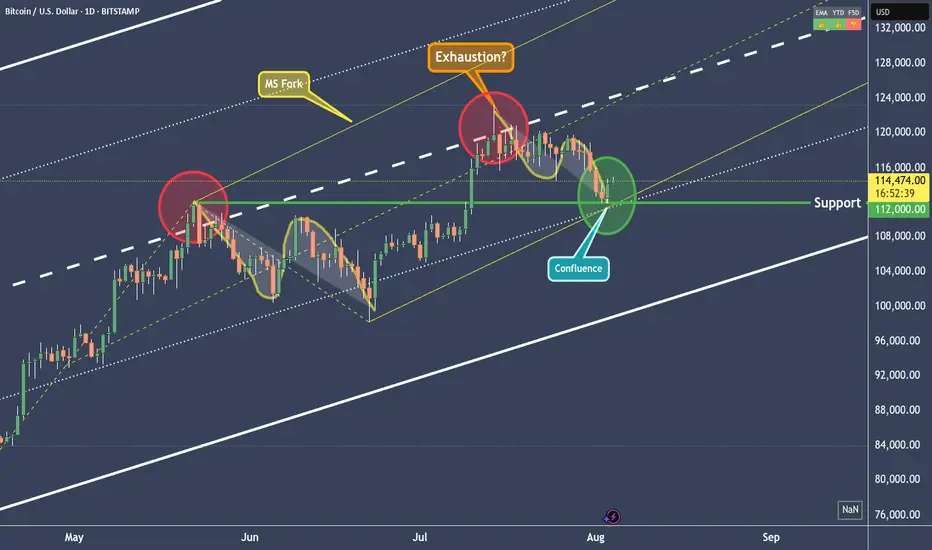
BTCUSD - Right to the point!In the last post (see the Linked Chart), I showed why BTCUSD would fall, and I also pointed out where the first price level for a possible pause might be.
On Friday, that level was reached, and the market seems to be turning *on the dot*. Will we now see higher prices again, or even a new all-time high? Let’s take a closer look:
The “confluence” point is marked by the white fork and the yellow modified Schiff fork. This point lies exactly on the 1/4 line. And this line often indicates temporary levels where at least a pause in the movement can be expected.
When we look at what Bitcoin did at this price level in mid-June, it seems likely that it will rise again. The overall pattern, from the centerline to the 1/4 line, looks extremely similar (see the A-B-C Wave Pattern)!
And yet, I’m not entirely convinced by the picture. Because this was the second time we reached the centerline.
For the brave, this wouldn’t be a bad entry point—or an opportunity to increase the position after this pullback. A possible stop for traders could be placed just below the current low, with targets at the centerline of course.
But why not just lean back, enjoy the profits, and switch into observation mode for now…
I will also make a video that explains the details and connections more clearly.
Happy Monday and stay patient to fight the FOMO! §8-)
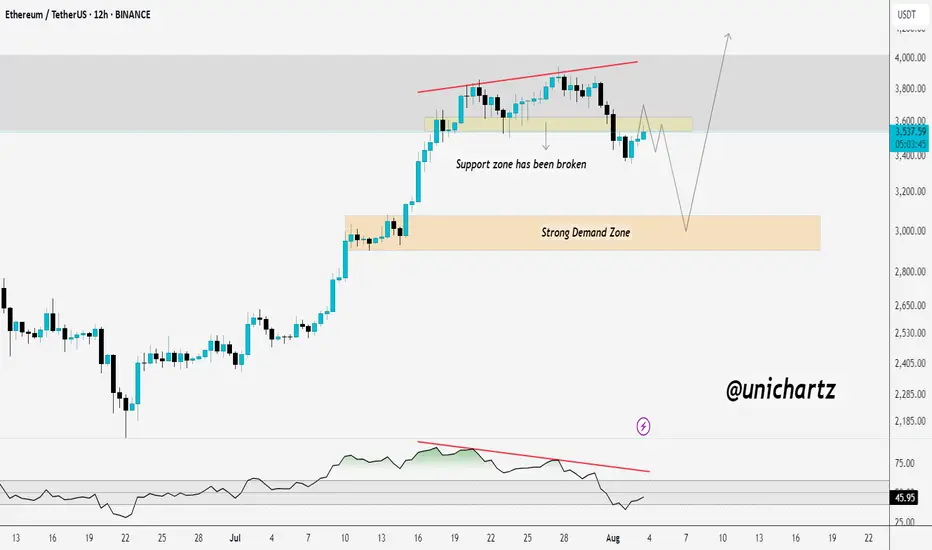
Breakdown Confirmed? ETH Could Drag Alts LowerCRYPTOCAP:ETH support zone around $3,560 has been broken, and current price action appears to be a retest of the breakdown. If ETH fails to reclaim this level, we could see further downside toward the strong demand zone near $3,000.
The RSI bearish divergence also adds to the bearish bias. If this retest fails, altcoins may face deeper corrections, as ETH often leads the market.
DYOR, NFA
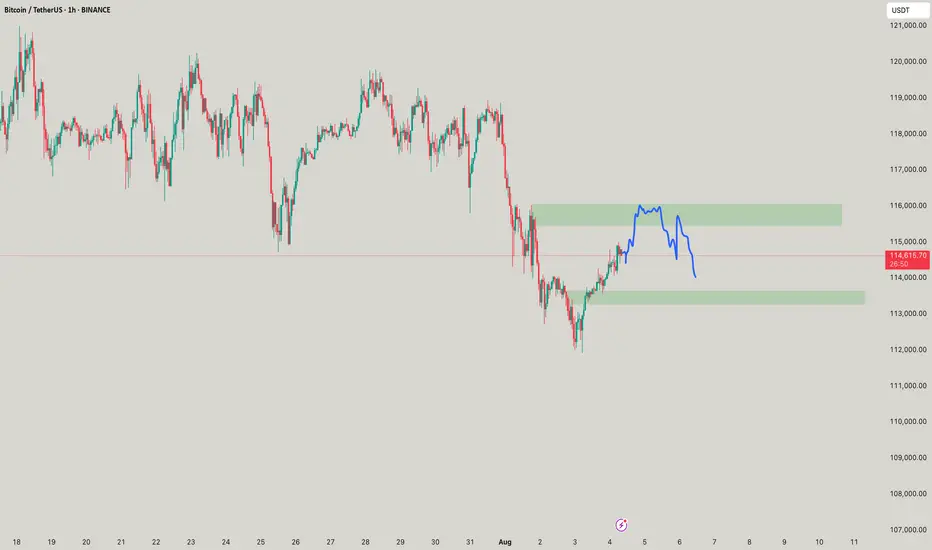
BTC - Falling or Going up? Will it go 120k?BTC's move as said is something to be taken care off, while if it falls below from the point i drew needs to be seen
MARKETS week ahead: August 4 – 10Last week in the news
US macroeconomic data took center stage during the previous week, with major correction occurring on Friday, after the NFP July data were released. Investors fear of economic consequences of implementing trade tariffs pushed US equity markets to downside. The S&P 500 lost 1,5% on Friday, closing the week at the level of 6.238. On the same grounds the price of gold strongly gained 2,2% on Friday, reaching the last price at $3.362. Strong reaction also came from US Treasury yields, where the 10Y US benchmark dropped to the level of 4,22%. This time the crypto market was also affected, where BTCs price dropped sharply, closing the week around the $113K level.
The FOMC meeting was held during the previous week, without changes in the level of interest rates. As per Fed's view, the economy is growing at a solid pace, while they acknowledged increasing risks originating from implemented trade tariffs on inflation and potential slowdown in the future economic growth. There were no comments regarding potential rate cuts in September, except that the Fed will continue further to balance interest rates based on “the incoming data, the evolving outlook and the balance of risks”, as noted by Fed Chair Powell.
A macro data heavy week in the US included data on JOLTs in June of 7,437M, modestly below market forecast of 7,55M. The PCE Price Index in June was relatively steady with 0,3% for the month and 2,6% for the year, which was in line with market expectation. However, what shocked the market on Friday were posted non-farm payrolls data for July of only 73K, although the market estimate was standing at 110K. During Saturday, news was published that the US president Trump requested immediate release of a duty of a Commissioner of labor statistics, due to posts of inaccurate labor data and its frequent revisions. The US President also questioned the accuracy of the July NFP figure of 73K.
During the previous weekend the U.S. finalized the trade-tariffs deal with the European Union. Details of the deal are officially published at the website of the European Commission, and include, among other, tariffs of 15% on imports from the EU, establishment of tariff-rate quotas for imports of steel, aluminium and copper from the EU, cutting the current 50% current tariffs. EU companies will also invest at least $600B in different sectors in the US by 2029.
Interesting news for crypto enthusiasts was posted by Cointelegraph, noting that on July 4, 2025, eight dormant Bitcoin wallets from the Satoshi era collectively moved 80.000 BTC, with each wallet transferring 10.000 BTC. The Satoshi era, generally defined as the period from 2009 to 2011, was when Bitcoin could still be mined or transacted using standard computer processors. The sudden activation of these long-inactive wallets has sparked intense speculation, with some suggesting that emerging quantum computing threats may have prompted the transfers. Still, analysts with a knowledge of blockchain technology commented that coins were not transferred directly to cryptocurrency exchanges but instead moved to newly created SegWit addresses — a move that likely indicates a security upgrade.
CRYPTO MARKET
As the crypto market became part of mainstream markets, it needed to manage both ups and downs of the investors' sentiment, which was usually related to traditional markets. This occurred during the Friday trading session, when investors' fear of future consequences of implemented trade tariffs turned to the negative side. Total crypto market capitalization decreased by 6% on a weekly basis, losing a total $216B. Daily trading volumes were relatively flat on a weekly basis, moving around $304B on a daily basis. Total crypto market capitalization increase from the beginning of this year currently stands at +12%, with a total funds inflow of $384B.
This week BTC was leading the market cap drop, with an decrease in value of 4% w/w and outflow of almost $96B in funds. ETH also had a drop in value of 7,2%, with total funds outflow of $32B. The third coin by total market cap, XRP, was traded around 10% lower, closing the week with total fund outflow of $18,6B. Another coin with a significant drop in the market cap was Solana, of almost 13% w/w, and funds outflow of $13B. Both DOGE and ADA were on a losing side, where DOGE was traded 17,1% lower, losing $6,13B in the market cap, while ADA dropped by 14,6% with an outflow of $4,3B. The majority of other altcoins finished the week with a loss in value between 14% and 18%.
This week there has not been too much activity when circulating coins are in question. Algorand had an increase of coins on the market by 0,2% w/w, while Stellar's number of coins surged by 0,3%. This week Filecoin had a modest increase of 0,1% on a weekly basis, same as ZCash and DOGE.
Crypto futures market
The general drop in the value of crypto coins on the spot market was also reflected to some extent also in the futures market. BTC futures were traded lower by more than 3% for all maturities, while ETH futures had a weekly drop in value of more than 4%. However, it is important that the general levels of the value of futures remain at higher grounds.
BTC futures maturing in December this year closed the week at $116.390, and those maturing in December next year were last traded at $123.490. A similar situation is with ETH futures, which managed to hold grounds above the $3K. Futures maturing in December 2025 closed the week at $3.631, and those maturing a year later were last traded at $3.894.