This Level Will Decide the Next Big Move in Crypto Markets🔍 General Chart Context
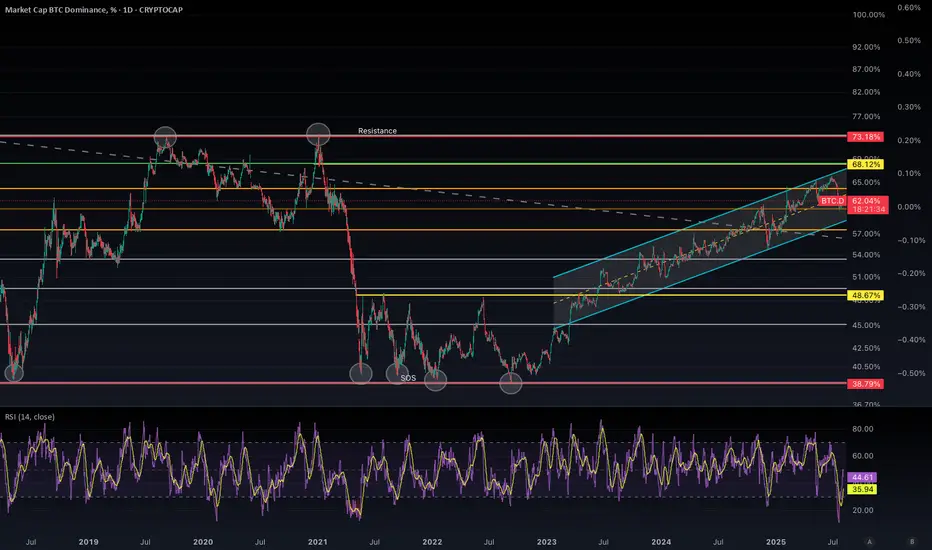
This chart tracks Bitcoin Dominance (% of total crypto market cap), currently sitting around 62.04%. BTC Dominance reflects Bitcoin’s market share vs altcoins — when it rises, BTC is outperforming alts; when it falls, altcoins are gaining.
🔄 RSI Analysis:
VERY IMPORTANT
BTC.D RSI against BTC RSI (daily candle)
BTC dominance dropped 46% from December 2020 - May 2021, while the price has dropped 55%. 6 months of bear market created an all time low for the RSI on the daily - rightfully so, RSI went all the way down to 10.
NOW (Last week)... the RSI has dropped down to the same level for the first time in 3 years! However, the difference is (outside the fact were already in a bull market) BTC dominance only dropped 10%. This is literlly music to my ears, massive sign of strength!
BTC RSI on the daily will use that 10-11 level as a support (historically speaking extremely low probability RSI will decline further) and continue rising until BTC price reaches $138K we could see a 68% dominance and a 80 RSI, after BTC price topping out, price will rotate into the ALT's starting the ALT season everyone has been waiting for late August and resulting in BTC to drop most likely to the 100K level. Which will be my next accumulation zone for the next big leg up over the new year.
🔁 Historical Levels & Key Zones
Resistance (73.18%): This is a long-term top marked with historical rejections (highlighted with circles).
Major Resistance Zones:
68%: Also a local high from prior cycle — current short-term resistance.
65%: Interim structural resistance, previously tested as a top and support.
🔮 Interpretation & Probabilities
🟩 Bullish Scenario (High Probability)
As long as BTC.D stays in the channel, the most likely path is a retest of 65%–68%.
RSI nearing oversold supports a relief bounce soon.
If BTC price continues up, altcoins may bleed further — pushing BTC.D higher.
Key levels to reclaim: 65% and 68%. If broken, next target is the cycle top (73%).
🟥 Bearish Scenario (Moderate-Low Probability for now)
If BTC.D breaks below the ascending channel and loses 60%, we could enter:
An altcoin-led market (altseason).
Watch for confirmation via RSI divergence, price structure break, and volume drop in BTC.D.
🧠 Macro View & Correlation to Crypto Market Cycles
The trend since late 2022 shows BTC regaining strength over altcoins — consistent with risk-off sentiment and macro uncertainty.
A move above 68% dominance typically signals BTC dominance in bull runs, often preceding parabolic BTC price increases. Something I am personally expecting moving into the new year.
Conversely, a breakdown from the channel would mark a risk-on phase — favouring alts.
✅ Conclusion
BTC.D is in a macro uptrend but approaching a critical test of channel support + RSI bounce zone. If 60% holds, expect a move back toward 65–68%. If it breaks, altcoin dominance could surge. This chart is pivotal for allocating between BTC and alts. BTC will eventually rotate into ALT coins creating a price drop in BTC and an increase in price with majority of ALTS. I believe this will happen after BTC tops out late august at $138000, then a true ALT season is necessary.
Disclaimer:
The content provided in this post is for informational and educational purposes only and should not be considered financial or investment advice. I am not a financial advisor, and this is not a recommendation to buy, sell, or hold any cryptocurrency, asset, or security. Always do your own research and consult with a qualified financial advisor before making any investment decisions. Trading and investing involve risk, and past performance does not guarantee future results.
Crypto market
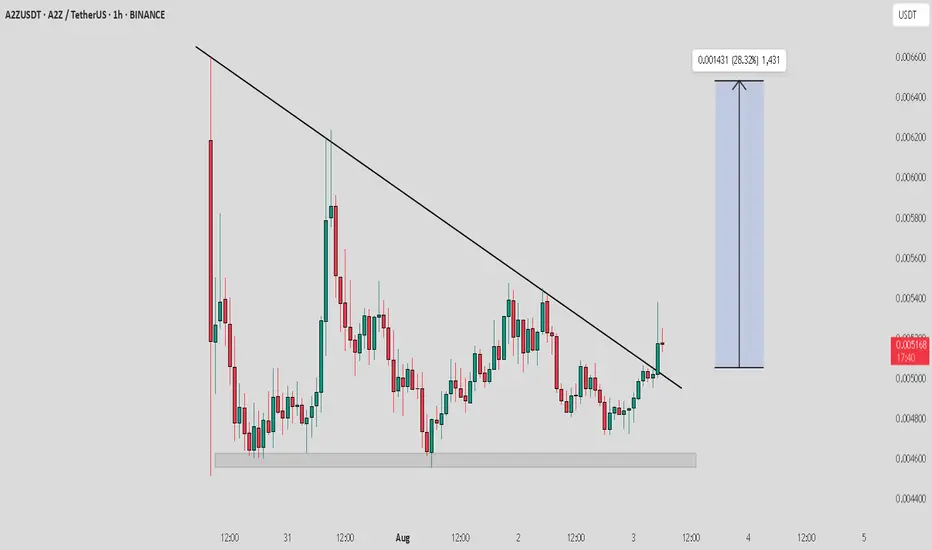
A2Z / USDT : Keep a close watch on retest proccessA2Z/USDT has broken out of a key trendline resistance and is now retesting the breakout zone.
This retest phase is critical — a successful hold here could trigger a sharp bullish move of 20-30% in the short term.
Volume confirmation and strong bullish candle on lower timeframes will add more confidence.
Keep it on your radar — next move could be quick.
TURBO/USDT – Cup and Handle Formation (1D Chart)Overview:
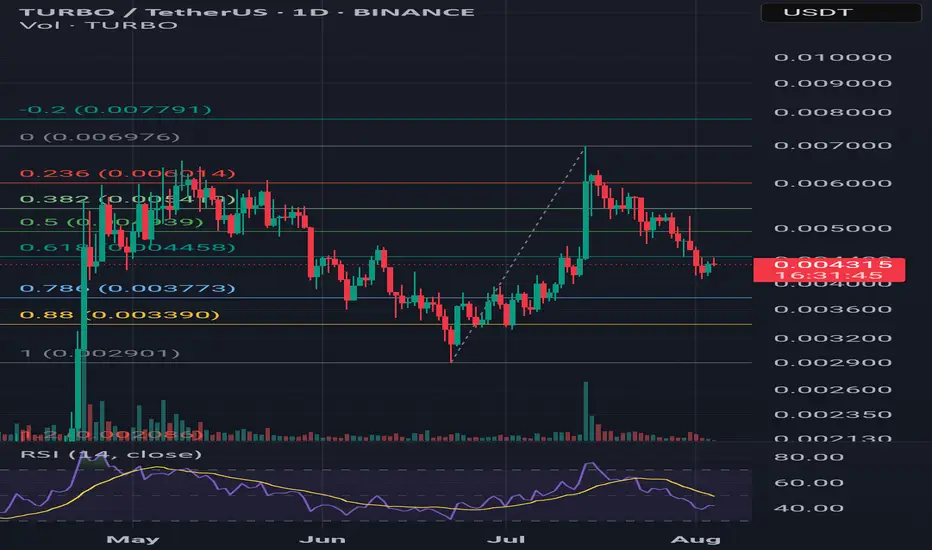
TURBO/USDT is potentially forming a textbook Cup and Handle pattern on the 1-day chart. Price action suggests a rounded bottom (the “cup”) followed by a consolidation range (the “handle”), setting up for a possible breakout.
---
🔍 Pattern Structure:
- Cup Formation:
Price rallied from ~0.0029 to ~0.0060 USDT, retracing slightly from the top. This rounded rise resembles the classic cup shape.
- Handle Formation:
Recent price consolidation between 0.0042–0.0049 USDT hints at the formation of the handle. A breakout above resistance could validate the pattern.
---
📈 Key Technical Levels:
Entry Zone | 0.0047 – 0.0050 |
| Resistance (Breakout)| ~0.0060 |
| Target 1 | ~0.0064 |
| Target 2 | 0.0078 – 0.0084 |
| Stop Loss | Below 0.0042 |
🔄 Additional Indicators:
- Volume: Watch for increasing volume to confirm breakout momentum.
- RSI (14-day): Neutral zone with room for upward movement. Momentum is building.
- Fibonacci Levels: 0.618 retracement (~0.004458 USDT) has acted as a key support during handle formation.
---
💡 Idea: Monitor for a daily close above 0.0060 with volume confirmation. That could mark the beginning of a bullish continuation. Risk management is essential if price fails to hold above the handle support.
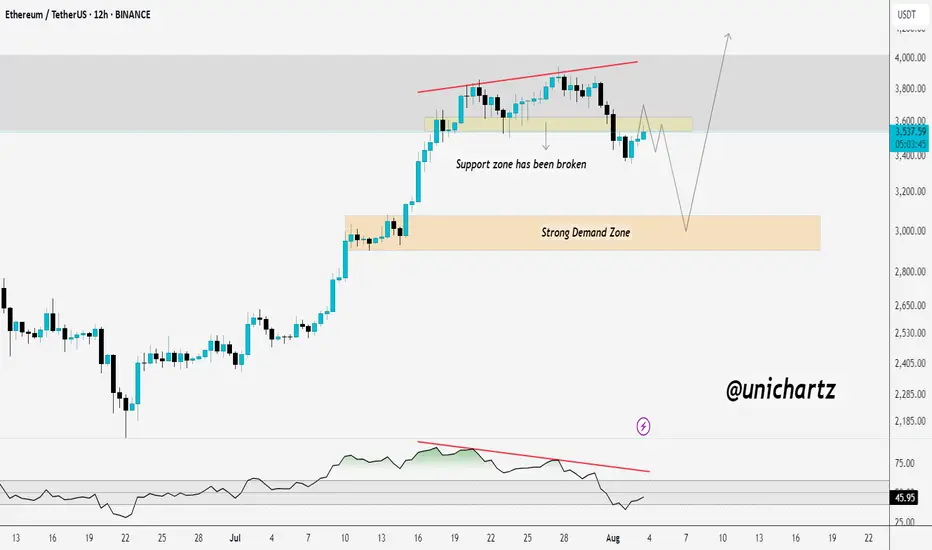
Breakdown Confirmed? ETH Could Drag Alts LowerCRYPTOCAP:ETH support zone around $3,560 has been broken, and current price action appears to be a retest of the breakdown. If ETH fails to reclaim this level, we could see further downside toward the strong demand zone near $3,000.
The RSI bearish divergence also adds to the bearish bias. If this retest fails, altcoins may face deeper corrections, as ETH often leads the market.
DYOR, NFA
SUI’s Next Big Move? Key Levels You Must WatchHey friends, it’s Skeptic 🩵
In this video, I’m diving into the current setup on SUI – whether to long or short, plus an update on market context and risk zones.
I broke down key levels, previous triggers, and what price action is hinting at next.
This one’s packed with insights, especially if you're in futures or looking for an entry on spot.
⚠️ Don’t forget about risk management – chasing pumps is a recipe for FOMO and mistakes.
💬 Let me know your thoughts on SUI in the comments, and let’s talk setups.

BITCOIN BULLISH POSSIBLE VIEW🧠 Key Observations (Smart Money Concepts - SMC Style)
🔄 Market Structure:
MSS (Market Structure Shift): Price recently made a MSS after a BOS (Break of Structure), indicating a shift to bullish structure.
BOS (Break of Structure): Seen on the move up from the demand zone.
SSL (Sell-side Liquidity) taken before the recent bullish move — classic liquidity sweep behavior.
📦 Zones:
Demand Zone: Between ~$111,000 and ~$113,000
4HR Supply Zone: Around ~$115,000 to ~$116,000 — where price is currently reacting.
Golden Zone (Entry/POI): Near the origin of the move that caused the BOS.
📍 Entry & TP/SL Setup:
Buy Limit: Placed at 111,931.32, right at the edge of the demand block.
Stop Loss (SL): Set just below at 110,453.42
Take Profit (TP): Targeting 113,676.39, right before the next resistance.
📊 Volume Analysis:
Large bullish volume spike aligns with the most recent BOS.
Diminishing sell volume during retracement suggests exhaustion of bearish momentum.
✅ Trade Idea (Based on Chart Setup):
Bias: Bullish
Entry: 111,931.32 USDT
Stop Loss: 110,453.42 USDT
Take Profit: 113,676.39 USDT
Risk/Reward: ~1:1.5 to 1:2
🔍 Additional Notes:
Liquidity Sweep: SSL cleared → indicates potential for long setups.
BOS + MSS Confluence: Bullish intent confirmed.
BB (Break of Block): Indicates intent to move higher if resistance is broken.
ERL Target: Final target is shown far above current price, near 123,280.88, could be a longer-term swing target if price holds structure.
🔄 Next Steps (as per typical TradingView publish ideas):
Set alerts at the demand zone.
Monitor price action when it taps into the Buy Limit level.
Watch for confirmation candle or volume spike before manual execution (if not using limit orders)

"BTC Moves Down — Scenario Confirmed"As expected, the market couldn’t sustain the overheating.
Over the past few days, Bitcoin has shown clear signs of weakness. The rally from $105K to $118K happened too quickly, without proper correction, and with noticeably declining volume toward the end of the move. In such situations, the market often loses footing — and that’s exactly what we’re seeing now: BTC has corrected down to $114,000.
If you've been following my analysis, you know I pointed out signs of overheating earlier: strong deviation from moving averages, weak reaction at key resistance levels, and upward wicks without volume confirmation. My indicator gave an early warning of trend weakening around the $117–$118K zone. That’s when it became clear momentum was fading.
This isn’t a crash or panic — it’s a normal, healthy market correction. Overleveraged long positions are getting flushed out, and late entries at the top are being shaken off. In such phases, it’s crucial not to react emotionally but to follow a clear system.
The key point: markets don’t reverse “suddenly.”
Everything happening now was visible in advance — if you were looking not just at price, but at the structure of the movement.

MARKETS week ahead: August 4 – 10Last week in the news
US macroeconomic data took center stage during the previous week, with major correction occurring on Friday, after the NFP July data were released. Investors fear of economic consequences of implementing trade tariffs pushed US equity markets to downside. The S&P 500 lost 1,5% on Friday, closing the week at the level of 6.238. On the same grounds the price of gold strongly gained 2,2% on Friday, reaching the last price at $3.362. Strong reaction also came from US Treasury yields, where the 10Y US benchmark dropped to the level of 4,22%. This time the crypto market was also affected, where BTCs price dropped sharply, closing the week around the $113K level.
The FOMC meeting was held during the previous week, without changes in the level of interest rates. As per Fed's view, the economy is growing at a solid pace, while they acknowledged increasing risks originating from implemented trade tariffs on inflation and potential slowdown in the future economic growth. There were no comments regarding potential rate cuts in September, except that the Fed will continue further to balance interest rates based on “the incoming data, the evolving outlook and the balance of risks”, as noted by Fed Chair Powell.
A macro data heavy week in the US included data on JOLTs in June of 7,437M, modestly below market forecast of 7,55M. The PCE Price Index in June was relatively steady with 0,3% for the month and 2,6% for the year, which was in line with market expectation. However, what shocked the market on Friday were posted non-farm payrolls data for July of only 73K, although the market estimate was standing at 110K. During Saturday, news was published that the US president Trump requested immediate release of a duty of a Commissioner of labor statistics, due to posts of inaccurate labor data and its frequent revisions. The US President also questioned the accuracy of the July NFP figure of 73K.
During the previous weekend the U.S. finalized the trade-tariffs deal with the European Union. Details of the deal are officially published at the website of the European Commission, and include, among other, tariffs of 15% on imports from the EU, establishment of tariff-rate quotas for imports of steel, aluminium and copper from the EU, cutting the current 50% current tariffs. EU companies will also invest at least $600B in different sectors in the US by 2029.
Interesting news for crypto enthusiasts was posted by Cointelegraph, noting that on July 4, 2025, eight dormant Bitcoin wallets from the Satoshi era collectively moved 80.000 BTC, with each wallet transferring 10.000 BTC. The Satoshi era, generally defined as the period from 2009 to 2011, was when Bitcoin could still be mined or transacted using standard computer processors. The sudden activation of these long-inactive wallets has sparked intense speculation, with some suggesting that emerging quantum computing threats may have prompted the transfers. Still, analysts with a knowledge of blockchain technology commented that coins were not transferred directly to cryptocurrency exchanges but instead moved to newly created SegWit addresses — a move that likely indicates a security upgrade.
CRYPTO MARKET
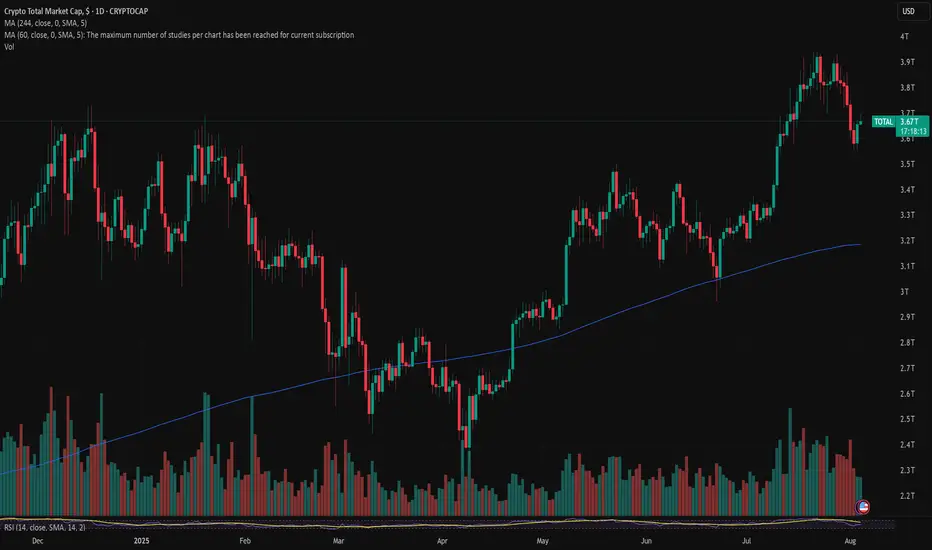
As the crypto market became part of mainstream markets, it needed to manage both ups and downs of the investors' sentiment, which was usually related to traditional markets. This occurred during the Friday trading session, when investors' fear of future consequences of implemented trade tariffs turned to the negative side. Total crypto market capitalization decreased by 6% on a weekly basis, losing a total $216B. Daily trading volumes were relatively flat on a weekly basis, moving around $304B on a daily basis. Total crypto market capitalization increase from the beginning of this year currently stands at +12%, with a total funds inflow of $384B.
This week BTC was leading the market cap drop, with an decrease in value of 4% w/w and outflow of almost $96B in funds. ETH also had a drop in value of 7,2%, with total funds outflow of $32B. The third coin by total market cap, XRP, was traded around 10% lower, closing the week with total fund outflow of $18,6B. Another coin with a significant drop in the market cap was Solana, of almost 13% w/w, and funds outflow of $13B. Both DOGE and ADA were on a losing side, where DOGE was traded 17,1% lower, losing $6,13B in the market cap, while ADA dropped by 14,6% with an outflow of $4,3B. The majority of other altcoins finished the week with a loss in value between 14% and 18%.
This week there has not been too much activity when circulating coins are in question. Algorand had an increase of coins on the market by 0,2% w/w, while Stellar's number of coins surged by 0,3%. This week Filecoin had a modest increase of 0,1% on a weekly basis, same as ZCash and DOGE.
Crypto futures market
The general drop in the value of crypto coins on the spot market was also reflected to some extent also in the futures market. BTC futures were traded lower by more than 3% for all maturities, while ETH futures had a weekly drop in value of more than 4%. However, it is important that the general levels of the value of futures remain at higher grounds.
BTC futures maturing in December this year closed the week at $116.390, and those maturing in December next year were last traded at $123.490. A similar situation is with ETH futures, which managed to hold grounds above the $3K. Futures maturing in December 2025 closed the week at $3.631, and those maturing a year later were last traded at $3.894.
BTCUSD BUY 109270On the daily chart, BTCUSD is experiencing a pullback from its highs, with short-term bears taking advantage. Currently, attention can be paid to the support level near 109270, which is a potential buy level for a bullish bat pattern and is within the previous demand zone.

Technical Analysis: All About Its Origin
Technical Analysis is the discipline that studies and graphically records the price and volume changes of a stock or asset, with the aim of exploiting recurring patterns and phenomena with predictive characteristics.
The origins of Technical Analysis date back to 17th-century Japan, in the rice futures markets of Osaka. After a century of internal wars among the daimyo—Japanese feudal lords—General Tokugawa emerged victorious at the Battle of Sekigahara (1600), initiating the unification of Japan. To maintain the loyalty of his subjects, Tokugawa, appointed Shogun, consolidated his power and ensured the allegiance of his followers by concentrating the political-military elite and their families in Edo (modern-day Tokyo).
At that time, the primary source of income for the daimyo was rice collected from the peasants working their lands. Since transporting rice to Edo was impractical, it was stored in the port of Osaka. The proximity of the daimyo in Edo sparked a competition for prestige, manifested through luxuries and other excesses. To sustain this lifestyle, the daimyo sold stored rice and even future harvests. For this “future rice,” warehouses began issuing contracts known as “empty rice.” These contracts were traded in a secondary market, giving rise to one of the world’s first futures markets.
The most prominent trader in this market was Munehisa Homma, who operated in the early 18th century. For Homma, markets were heavily influenced by the psychology of investors, who sometimes perceived a harvest differently from reality. In his book, *The Fountain of Gold*, he expressed ideas that remain highly relevant today, particularly what many Western traders know as contrarian opinion:
“When the price of rice begins to rise, orders come in from all directions at once, and soon the Osaka market joins the frenzy. The price of rice rises faster when people place orders even for stored rice, and it becomes clear that a buying fever is underway. But when you want to be in the position of placing buy orders like everyone else, it’s important to be on the side of those placing sell orders. When people move in unison, rushing westward with the determined intention of participating in the rise, that’s the moment for you to head east, and you will discover great opportunities.”
Steve Nison, an investor who popularized the use of Japanese candlesticks in the West, states in his book *Beyond Candlesticks*:
“In the material I translated, candlestick charts are often called Sakata charts, in reference to the port city of Sakata, where Homma lived. However, based on my research, it is unlikely that Homma used candlestick charts. It is more likely that these charts were developed in the early part of the Meiji period in Japan (late 1800s).”
It is worth noting that, although Homma may not have used candlestick charts, this type of graphical representation was the evolution of centuries of experience using price records for predictive purposes.
The Revolution of Japanese Candlestick Charts
The graphical representation of prices has been a determining factor in the evolution of technical analysis, marking a clear distinction between investment approaches in the East and the West. While traditional bar charts, predominant in the West, were limited to showing opening and closing prices, Japanese candlestick charts offered a more comprehensive view of investor psychology. These charts incorporated not only the opening and closing prices but also the highs and lows of each session, represented intuitively through the body and wicks of the candles.
Perhaps Western investors, constrained by the simplicity of bar charts, developed an approach more focused on studying price formations, while the Japanese could make decisions based on the analysis of small groups of candles. Over time, however, both approaches proved equally practical, and a multi-timeframe understanding became part of the operations of both Western and Japanese investors.
An example of the application of a multi-timeframe approach in the West is found in the father of modern technical analysis, Richard W. Schabacker, who, despite his short life, left a prolific body of work. In his book *Technical Analysis and Stock Market Profits* (1932), he classifies markets into major movements (monthly), intermediate movements (weekly), and minor movements (daily). In Japan, Goichi Hosoda, the creator of the Ichimoku Kinko Hyo indicator, is the best example of an investor who dedicated his life to cataloging and studying price formations beyond the use of candlestick patterns.
Over time, modern Western investment platforms adopted the innovations of Japanese candlestick charts, integrating the ability to display highs, lows, openings, and closings in a single format.
In the early 20th century, scholars of charts in the West were known as chartists, but today, “Chartism” is associated with a classical methodology popularized by journalist and investor Richard W. Schabacker (1899–1935) and later by the book *Technical Analysis of Stock Trends* (1948) by authors Robert D. Edwards and John Magee.
Theory on the Emergence of Technical Analysis
Since the dawn of humanity, people have sought to represent the phenomena around them to understand or communicate information. Whether through cave drawings, symbols, or written records, visual representation has been a fundamental tool for making sense of the world. Undoubtedly, price fluctuations were a phenomenon that invited analysis.
The earliest investors, using graphical representations, aimed to find order in chaos. By meticulously recording price movements, these pioneers likely discovered something surprising: repetitive patterns that seemed to predict future behavior. This discovery must have been thrilling, as it offered the promise of significant profits, often with seemingly low risk.
Without needing to understand market psychology, as later technical analysts would, these early investors found a practical advantage in these patterns. When enough of them identified and acted on the same pattern, it tended to fulfill itself more frequently, reinforcing its validity. Thus, what began as an intuitive observation evolved into a structured practice, laying the foundation for what we now know as Technical Analysis: a discipline that thousands of investors use to interpret market behavior and make informed decisions.
Fun Fact
The first work to describe the phenomenon of stock market investing is titled *Confusion of Confusions* (1688) by José de la Vega, set in Amsterdam, the financial hub of Europe at the time. More than a detailed study of the investment methods of the era, this novel seeks to entertain and inform readers about the risks of speculation.
Its author, moreover, employs a narrative style that surpasses even the florid prose of his contemporaries:
“They strive to perpetuate the unrest of those who frequent their dealings, and just as they imprison them in their towers, they cast the locks into the sea so that the hope of ever removing the bolts may never flatter them.”
Conclusions
Some might consider the history of technical analysis a curious but irrelevant tale for modern practice. However, history shows us that markets are more than just numbers—they are a reflection of human psychology. Far from being a mere catalog of tricks to memorize, technical analysis invites us to understand psychological dynamics to make informed decisions.
Recognizing that markets are shaped by historical patterns grants us a strategic advantage. By studying how past investors interpreted prices and emotions—from rice traders in 17th-century Japan to modern analysts—we can anticipate market movements with greater precision. This perspective not only enriches our trading but also positions us as more aware and prepared investors in an environment where collective psychology remains the dominant force.
References
Nison, S. (1994). *Beyond Candlesticks: New Japanese Charting Techniques Revealed*. New York, NY: John Wiley & Sons.
Schabacker, R. W. (1932). *Technical Analysis and Stock Market Profits*. New York, NY: B.C. Forbes Publishing.
Edwards, R. D., & Magee, J. (1948). *Technical Analysis of Stock Trends*. Springfield, MA: John Magee.
Rabassa, Y. (n.d.). *How to Master Japanese Candlesticks?* . YouTube.

ARKMUSDT Make or Break? Testing the Ultimate Historical Support!🧱 Critical Support Zone in Play
ARKM is currently trading around $0.470, sitting right on top of a major historical support zone ($0.400–$0.470) highlighted in yellow on the chart. This area previously served as a launchpad in late 2023, propelling price to an all-time high of $3.996.
Now, after a prolonged downtrend, the price is once again testing this same key level. The market's reaction here will likely define the next macro direction—will ARKM bounce and reverse, or break down into new lows?
---
📐 Technical Structure & Key Levels
Major Support (Demand Zone): $0.400 – $0.470
Layered Resistance:
Minor: $0.616, $0.730, $0.894
Mid-Level: $1.575
Major: $2.493 & $3.188
All-Time High: $3.996
Volume Insight: Still relatively low, suggesting possible accumulation.
---
🔄 Pattern Development:
✅ Potential Double Bottom or Accumulation Base – Multiple bounces off the $0.400 zone hint at the formation of a medium-term reversal structure.
If buyers step in and push the price above $0.616–$0.730, we could see confirmation of a trend reversal beginning.
---
📈 Bullish Scenario:
If price:
Holds and rebounds strongly from $0.400–$0.470
Breaks and closes above $0.616 and $0.730 with increasing volume
Then next bullish targets are:
➡️ $0.894 (key resistance)
➡️ $1.575 (mid-range supply zone)
➡️ $2.493 – $3.188 (macro targets for medium-long term rally)
📌 Volume breakout and bullish candle structures will strengthen this scenario.
---
📉 Bearish Scenario:
If price:
Breaks and closes decisively below $0.400, invalidating the support zone
This could trigger a mass stop-loss cascade, with sellers taking over.
Next possible supports: ⚠️ $0.250 (minor support)
⚠️ $0.170 (last structural support in breakdown mode)
This scenario might unfold if overall crypto market sentiment worsens.
---
🧠 Strategy & Trade Ideas:
Buy on Reversal: Strong bounce at $0.400 zone with tight stop-loss below support
Buy on Breakout: Clear break and retest of $0.730 with volume confirmation
Sell/Short: Breakdown below $0.400 with failed retest
🛡️ Always apply proper risk management with a minimum 1:2 risk-reward ratio. Avoid FOMO—wait for confirmation.
---
🔍 Final Thoughts:
ARKM is in a high-stakes zone that has historically generated explosive moves. This is either a huge opportunity for accumulation or a potential breakdown into uncharted lows. The next few candles could define the rest of the year for this asset.
#ARKM #ARKMUSDT #CryptoTA #AltcoinAnalysis #SupportAndResistance #CryptoBreakout #DoubleBottomPattern #ReversalZone #BuyOrBreak #CryptoSetup

BTC USD Long updateBe patient.
This trade might take one month to complete.
Be patient and wait and wait and wait.

127k after small fall to 112k . buy altcoins in 112k
Hello. Wait for a small correction to the 112k range. There is still wave 5 left to end this bullish move, which I think will make a new record in the 127k range.


Gaming Narrative Just Getting StartedHello Traders 🐺
Usually, I’m a big fan of large market cap coins — you can rely on them and make solid profits, especially with proper leverage.
But sometimes, especially at the beginning of an Altcoin season, I like to pick one or two small-cap alts that have the potential for a 50x–100x run from my entry point.
So, here’s one of the bags I’m holding.
Everything looks fine — it's currently ranked around #1500 on CMC, and I believe it can easily reclaim a spot below #1000.
Tokenomics look solid, and in my opinion, the gaming sector this cycle could be mind-blowing, with huge upside potential.
Even better, this project is about to launch its mobile version, which in my view will make the game way more accessible — and that could change everything.
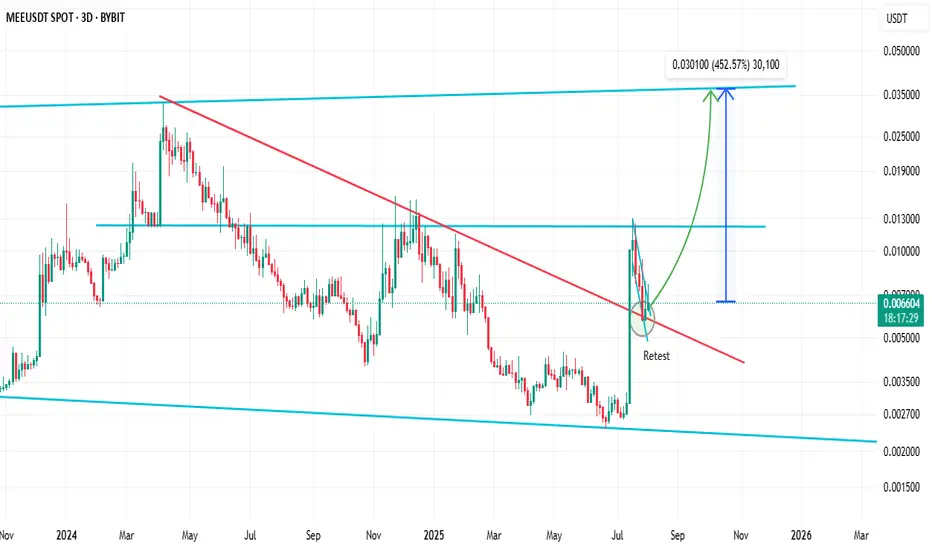
As for the chart:
Price is breaking above the weekly resistance and currently retesting it as support.
If it manages to break out of the daily channel, I believe the next stop is the ATH at $0.033.
Let’s see how this plays out.
As always —
🐺 Discipline is rarely enjoyable, but almost always profitable. 🐺
🐺 KIU_COIN 🐺
Sol/Btc✨ Solana vs Bitcoin — a quiet moment before the move?
📍 First week of August 2025
From the roaring highs of 2021,
Solana slowly faded under Bitcoin’s shadow…
Now resting around 0.0014 BTC,
breathing quietly, perhaps gathering strength:
🔸 RSI shows a bullish divergence — momentum building.
🔸 Moving averages (red & yellow) still overhead, but the gap is narrowing.
🔸 Key resistances:
▫️ 0.0020 → 38.2% Fib
▫️ 0.0025 → 50% Fib
▫️ 0.0030 → the golden 0.618 Fib.
🔮 Scenarios:
1️⃣ Break above 0.0020 → a fresh wave toward 0.0030 and beyond.
2️⃣ Rejection → a revisit to 0.0012 ~ 0.0014 BTC zone to reload.
📌 For now, the market holds its breath…
Will Solana awaken?
Or remain in Bitcoin’s shadow a little longer? 🌙

Multi-Timeframe: Range, Accumulation Opportunity on Pullbacks__________________________________________________________________________________
Technical Overview – Summary Points
__________________________________________________________________________________
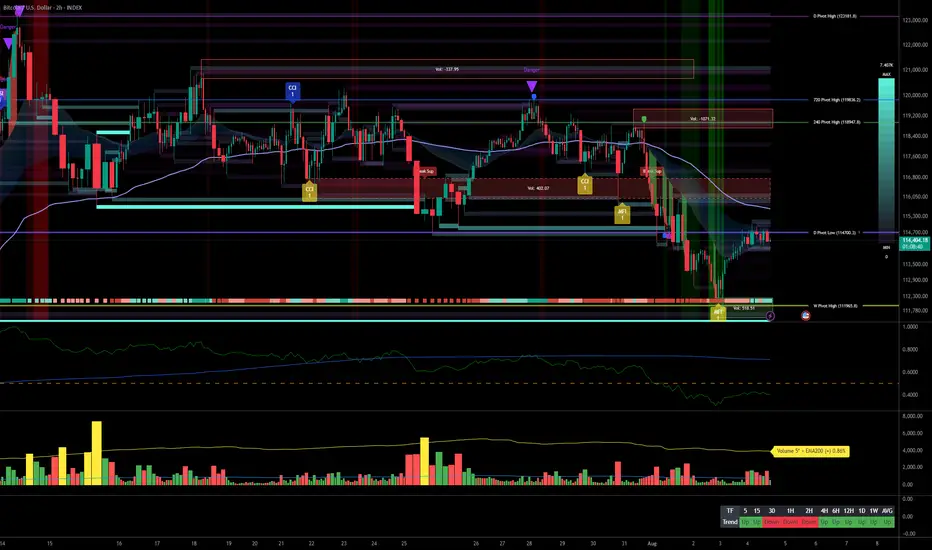
Overall Momentum: Dominant bullish trend above 4H. Short-term momentum shifts bearish on 2H/1H/30min, warrants caution.
Key Supports: 114,000 USDT (short term), 111,900 USDT (major pivot), 98,200 USDT (structural failure if lost).
Critical Resistances: 115,900 / 118,900 / 119,900 USDT, daily pivot high 122,318 USDT.
Risk On / Risk Off Indicator: Bullish confirmation on most higher timeframes.
ISPD DIV: Behavioural indicators neutral across all frames, no extreme signals (no panic or euphoria).
Volume: Normal overall, with isolated yellow bars signaling recent volatility spikes.
Multi-timeframe: Higher timeframes (1D, 12H, 6H, 4H) remain bullish. Lower timeframes (2H, 1H, 30min, 15min) show short-term downside momentum without systemic panic.
__________________________________________________________________________________
Strategic Summary
__________________________________________________________________________________
Main Bias: Bullish structure so long as 111,900 USDT holds. “Buy-the-dip” on pullbacks, tactical range approach below 115,900 USDT.
Opportunities: Scalping on key supports (113,000–114,000 USDT), accumulation on deep test of 111,900 USDT, adaptive exits at major resistances.
Risks Zones: Clear break of 111,900 USDT opens the way to a deeper corrective move, potentially to 105,000–110,000 USDT.
Macro Catalysts: FED on hold, ETF outflows, ongoing geo/trade war risks, US job stats uncertainties; to be monitored.
Action Plan: Adjust position size to intraday volatility, strict stop-loss below 111,800 USDT, firm monitoring of ETF flows, on-chain trends, and Risk On / Risk Off Indicator .
__________________________________________________________________________________
Multi-Timeframe Analysis
__________________________________________________________________________________
1D - Daily: Bullish trend until 111,900 USDT fails on close. Volume and behaviourals neutral.
12H / 6H / 4H: Range trading dominant. Pivots cluster in 114,700–116,000 USDT.
2H / 1H: Short-term bearish bias (MTFTI Down), increased risk of flush below 113,000 USDT; patience required for exhaustion or seller reversal.
30min / 15min: Volatility up, no behavioural extremes detected. Key watch on breaks below 113,000 USDT.
Risk On / Risk Off Indicator: Confirms bullish bias on higher frames (>4H), momentary loss of bullish momentum on short-term (30min–2H).
Summary: 111,900 USDT is the prime protection node; above = bullish. Below = risk of corrective extension. No current panic detected.
__________________________________________________________________________________
Macro & Bitcoin – Twitter Synthesis & Fundamental Insights
__________________________________________________________________________________
Macro: Mixed global sentiment, ongoing US-China trade tensions, persistent geopolitical volatility, equities and crypto under pressure but no systemic break yet. FED in wait-and-see, next big pivot in September.
BTC: Technical & on-chain accumulation at major supports, ETF outflows by retail but institutional accumulation, significant liquidations but no outright panic.
On-chain: 97% of BTC supply in profit, risk of distribution on overextended rallies, STH cost basis support intact ($105–117k zone).
Strategy: Base scenario = buy deep pullbacks, exit prudently at resistance, monitor ETF flows & macro headlines for tactical adjustment.
__________________________________________________________________________________
Practical Conclusion & Recommendations
__________________________________________________________________________________
Underlying trend remains bullish, extension likely if 111,900 USDT holds.
Monitor: volume/sell capitulation, Risk On / Risk Off Indicator, ETF flows.
Maintain strict risk management, adapt tactics to range volatility.
Avoid excessive leverage, keep tactical intraday flexibility as microstructure is volatile.
__________________________________________________________________________________
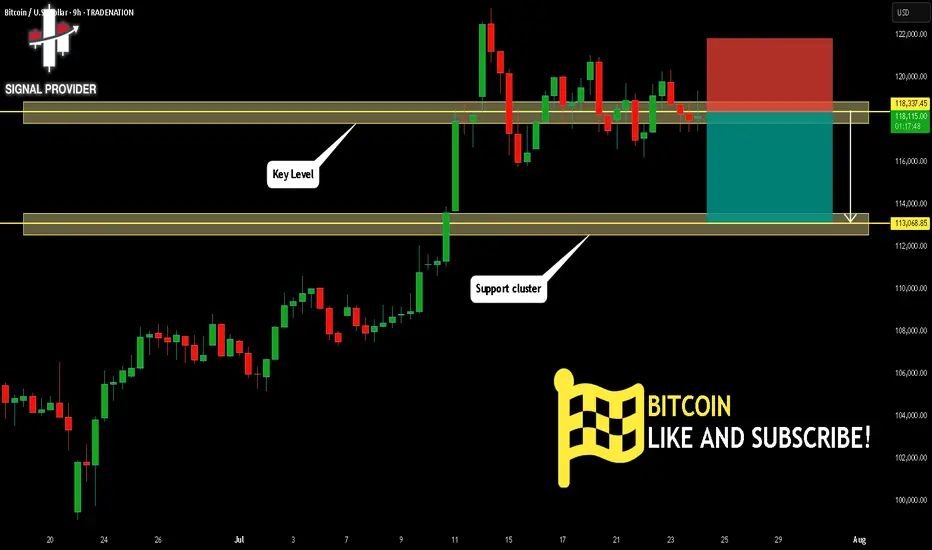
BITCOIN Will Fall! Short!
Take a look at our analysis for BITCOIN.
Time Frame: 9h
Current Trend: Bearish
Sentiment: Overbought (based on 7-period RSI)
Forecast: Bearish
The market is approaching a key horizontal level 118,337.45.
Considering the today's price action, probabilities will be high to see a movement to 113,068.85.
P.S
We determine oversold/overbought condition with RSI indicator.
When it drops below 30 - the market is considered to be oversold.
When it bounces above 70 - the market is considered to be overbought.
Disclosure: I am part of Trade Nation's Influencer program and receive a monthly fee for using their TradingView charts in my analysis.
Like and subscribe and comment my ideas if you enjoy them!
BTC DAILY - CUP & HANDLE BREAKOUT TARGETING $169KBitcoin just confirmed a macro Cup & Handle breakout with a strong push above the $112K neckline. The price is now consolidating above key moving averages – setting up for a potential explosive continuation. 🔥
🟢 Technical Highlights:
📈 Cup & Handle pattern – classic bullish continuation
💥 Breakout target: +32% move → $169,000
🟩 1D MA 50 / MA 200 acting as dynamic support
🔄 MACD bullish cross confirming momentum
🟦 Breakout above major resistance = new market structure zone
🧲 Psychological support near $99K and $112K
***********************************
🎯 Buy Signal Details:
Entry Zone (Pullback Valid): $112,000–$114,000
Take Profit: $169,000 🎯
Stop Loss: $99,000 🛡️
Buy Confidence: 95% ✅
📌 Not financial advice. This is pure chart-based technical analysis.

SOPH / USDT :Broke out from trendline resistance SOPH/USDT Breakout Watch
SOPH/USDT has just broken the trendline resistance and is showing strong bullish potential. With a successful retest, we could see a 13 - 15% rise soon!
Key Point: Keep an eye on the retest for confirmation. A solid hold will trigger a strong upward move. Be ready for the breakout!

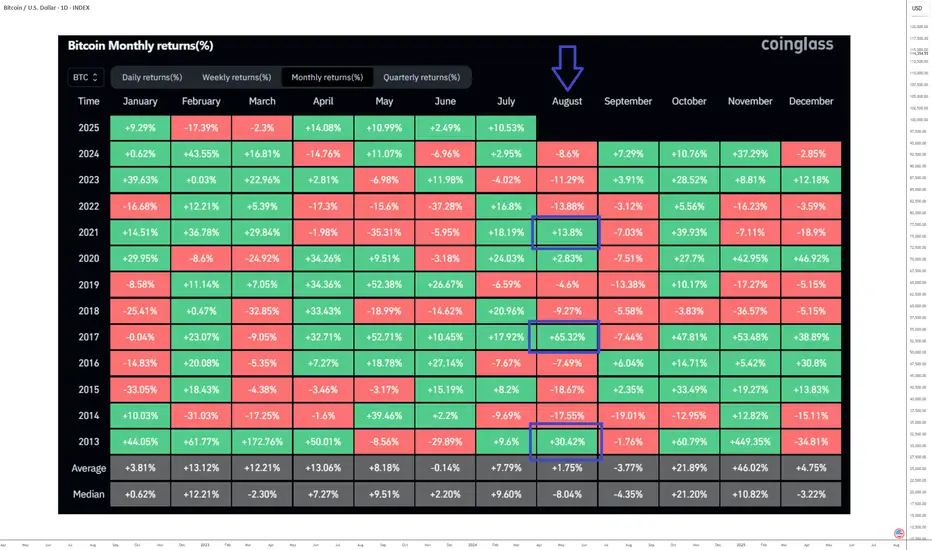
BITCOIN, a favorable August in terms of seasonality?The underlying bullish trend in the price of Bitcoin remains intact despite uncertainty regarding the likelihood of a US Federal Funds rate cut at the next monetary policy decision on Wednesday, September 17.
The bullish cycle linked to the 2024 halving continues, and BTC/USD is still under the technical influence of the bullish breakout in early July from a bull flag continuation pattern.
What can we now expect from August from a technical standpoint for Bitcoin and altcoin prices?
1. August seasonality is favorable for BTC only in the final year of the 4-year cycle, and 2025 is the final year of the current cycle
August does not generally show strong average or median performance for BTC from a statistical seasonality perspective. However, when examining performance based on the year within Bitcoin’s 4-year cycle, we see that every final year of the cycle has featured a bullish August. This does not mean the market will rise steadily from August 1 to 31, but statistically, the end-of-month performance should be positive.
2. The positive correlation between Bitcoin’s price and global M2 liquidity suggests a favorable trend in August
Another factor supporting a bullish August is the positive correlation between Bitcoin’s price and the projected global M2 liquidity 12 weeks ahead. This correlation has worked well throughout the current cycle and suggests August will be bullish — though caution is warranted, as a correction is expected in September according to this approach.
3. From a chart analysis perspective, Bitcoin remains under the bullish influence of a bull flag continuation pattern
Bitcoin broke out to the upside from a bullish flag in early July, and this setup remains the dominant technical factor. The theoretical target of this pattern is $130,000, with an invalidation level below $110,000.
4. Altcoins are trending toward the previous cycle’s record highs from late 2021
The chart below shows the underlying trend in altcoins, excluding BTC, ETH, and stablecoins. Chart analysis also conveys a bullish message for this altcoin index in August. The invalidation level is below the $690B support.
DISCLAIMER:
This content is intended for individuals who are familiar with financial markets and instruments and is for information purposes only. The presented idea (including market commentary, market data and observations) is not a work product of any research department of Swissquote or its affiliates. This material is intended to highlight market action and does not constitute investment, legal or tax advice. If you are a retail investor or lack experience in trading complex financial products, it is advisable to seek professional advice from licensed advisor before making any financial decisions.
This content is not intended to manipulate the market or encourage any specific financial behavior.
Swissquote makes no representation or warranty as to the quality, completeness, accuracy, comprehensiveness or non-infringement of such content. The views expressed are those of the consultant and are provided for educational purposes only. Any information provided relating to a product or market should not be construed as recommending an investment strategy or transaction. Past performance is not a guarantee of future results.
Swissquote and its employees and representatives shall in no event be held liable for any damages or losses arising directly or indirectly from decisions made on the basis of this content.
The use of any third-party brands or trademarks is for information only and does not imply endorsement by Swissquote, or that the trademark owner has authorised Swissquote to promote its products or services.
Swissquote is the marketing brand for the activities of Swissquote Bank Ltd (Switzerland) regulated by FINMA, Swissquote Capital Markets Limited regulated by CySEC (Cyprus), Swissquote Bank Europe SA (Luxembourg) regulated by the CSSF, Swissquote Ltd (UK) regulated by the FCA, Swissquote Financial Services (Malta) Ltd regulated by the Malta Financial Services Authority, Swissquote MEA Ltd. (UAE) regulated by the Dubai Financial Services Authority, Swissquote Pte Ltd (Singapore) regulated by the Monetary Authority of Singapore, Swissquote Asia Limited (Hong Kong) licensed by the Hong Kong Securities and Futures Commission (SFC) and Swissquote South Africa (Pty) Ltd supervised by the FSCA.
Products and services of Swissquote are only intended for those permitted to receive them under local law.
All investments carry a degree of risk. The risk of loss in trading or holding financial instruments can be substantial. The value of financial instruments, including but not limited to stocks, bonds, cryptocurrencies, and other assets, can fluctuate both upwards and downwards. There is a significant risk of financial loss when buying, selling, holding, staking, or investing in these instruments. SQBE makes no recommendations regarding any specific investment, transaction, or the use of any particular investment strategy.
CFDs are complex instruments and come with a high risk of losing money rapidly due to leverage. The vast majority of retail client accounts suffer capital losses when trading in CFDs. You should consider whether you understand how CFDs work and whether you can afford to take the high risk of losing your money.
Digital Assets are unregulated in most countries and consumer protection rules may not apply. As highly volatile speculative investments, Digital Assets are not suitable for investors without a high-risk tolerance. Make sure you understand each Digital Asset before you trade.
Cryptocurrencies are not considered legal tender in some jurisdictions and are subject to regulatory uncertainties.
The use of Internet-based systems can involve high risks, including, but not limited to, fraud, cyber-attacks, network and communication failures, as well as identity theft and phishing attacks related to crypto-assets.