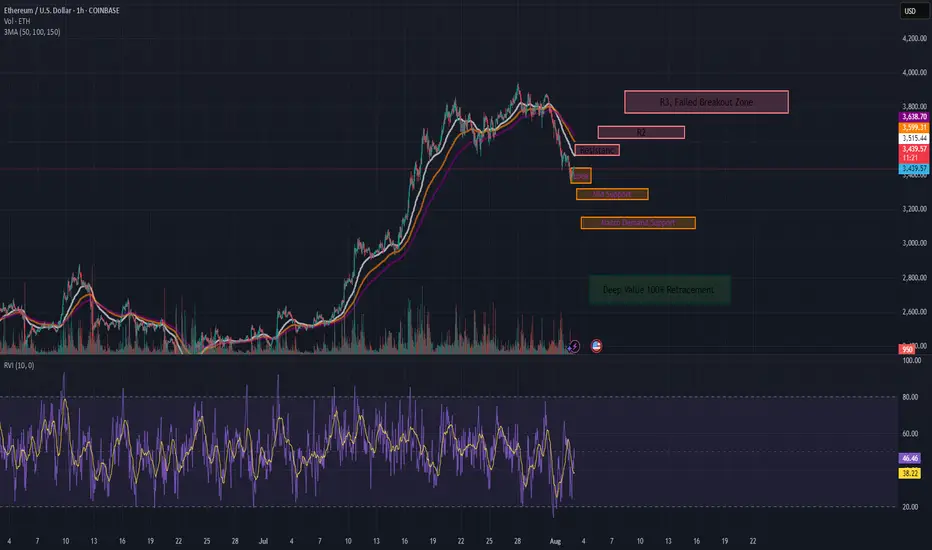
ETH Tactical Long: Laddered Bounce from Absorption ZoneCOINBASE:ETHUSD has been in a steady 1H downtrend, but key support at $3,440 is showing signs of absorption. Volume is thinning on sell-offs, and we're seeing early reversion signals.
This is my over the weekend analysis, not a final recommendation.
Setup Type: Mean Reversion / Absorption Bounce
- Trend: Still bearish on 1H (below 50/100/150 MAs), but slope compression hints at weakening
momentum
- RVI: Below 50, but curling up → early bounce bias
- Volume: Sellers fading into $3,440 = buyer absorption zone
📊 1hr Quant Entry Levels & Laddered Plan
Zone Type Action
$3,440–3,435 Primary Entry Base long entry zone 🔄
$3,420–3,410 Add-on Entry Optional bid stack 🧱
$3,320 Soft Invalidation Trend continuation if lost 🚫
$3,150 Deep Value Wick Low-prob, high-juice trap 💎
🎯 Targets:
T1: $3,515 → EMA cluster rejection zone
T2: $3,600–3,638 → Range midpoint
T3: $3,800 → Trend reversal if reclaimed
⚖️ Risk/Reward: 1:2.5+ (depends on fill ladder)
We are starting entries here, but be cautious if we break through our support levels and you don't have the appetite for the deep value range it may be wiser to wait for a confirming trend or post.
Crypto market
Bitcoin (BTC): Either $108K or Back Above $117KBTC is in a volatile position, where purely on a chart we can't really tell whether we might be heading up or down from here.
What we noticed, though, is the order books orders near lower zones, where buyers have set few buys, possibly hinting to potential bullish movement to happen.
So what to keep in mind here?
1) Keep an eye on that bearish CME gap, which might be filled and marked as smaller target for short
2) Before we see either a breakout from the 117K area or a breakdown from the $108K zone, we should not enter into any early trades here on the current timeframe.
Swallow Academy

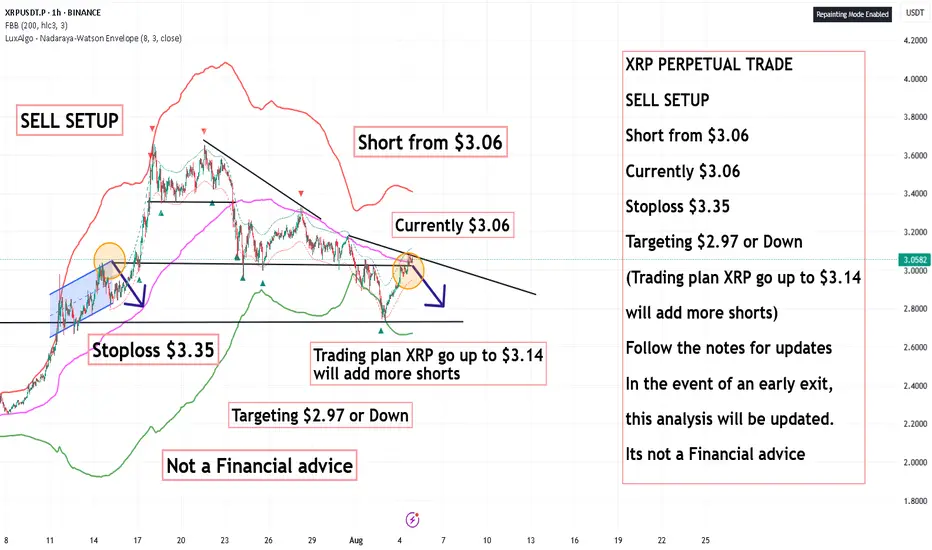
XRP PERPETUAL SELL SETUP ,Short from $3.06XRP PERPETUAL TRADE
SELL SETUP
Short from $3.06
Currently $3.06
Stoploss $3.35
Targeting $2.97 or Down
(Trading plan XRP go up to $3.14
will add more shorts)
Follow the notes for updates
In the event of an early exit,
this analysis will be updated.
Its not a Financial advice
$BTC Obeying Elliott Wave(Updates)This is an update of a previous publication(link below).
This is a 5th Wave of a Main Wave as Wave 4(Black) shown at the bottom left corner already completed. Price retested and confirmed at the 261.8% Fib. level then launched the wave we are currently on. Wave 1,2 and 3(Green) are all formed, with 2 being a Zigzag. This means 4(Green) should be a Flat. When Wave 3(Green) completed price retested at the 161.8% Fib. level for Wave A(Blue) of the Flat and 261.8% Fib. level for Wave B(Blue) of the same Flat. Price bounces off a few Fib. levels(not fully shown) to launch Wave C(Blue) also Wave 4(Green). A confirmation at its current location would trigger a sell to Wave 4.
Click below for more information:

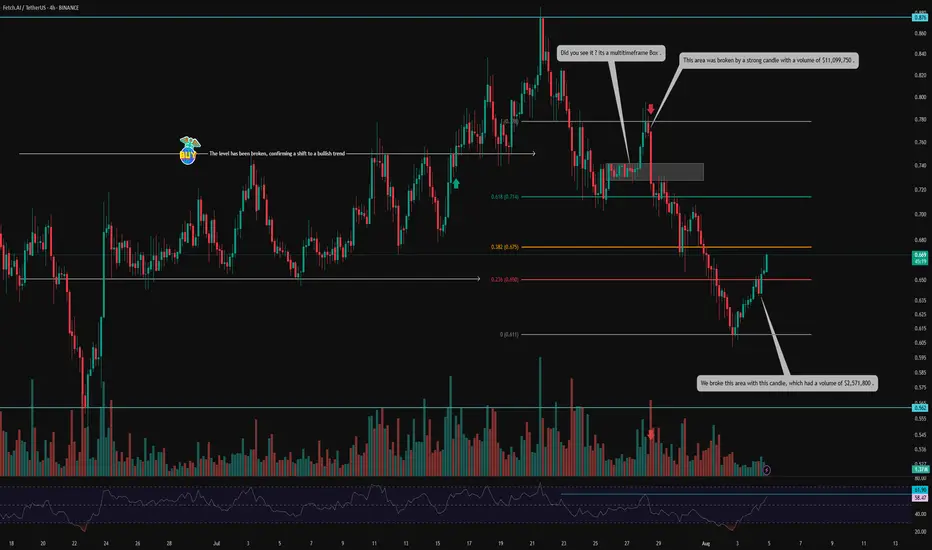
FET on Fire: Volume-Backed V-Pattern Breakout in 4H Structure💀 Hey , how's it going ? Come over here — Satoshi got something for you !
⏰ We’re analyzing FET on the 4-hour timeframe .
👀 After breaking out of its range around $0.75, FET experienced a solid upward move , reaching $0.876 . However , it was rejected from that level and faced heavy selling pressure , eventually forming a consolidation box on the multi-timeframe .
The break of this box, accompanied by rising volume and a total market structure break , led to a move toward the $0.778 resistance , where the price dropped again — this time with significant sell volume .
🎮 The Fibonacci levels in this chart are drawn based on volume-based market activity — specifically from the candle where the sell-off began to the candle where selling pressure ended and a reversal candle formed .
It may sound a bit technical , but the 0.236 Fib level acted as a key V-pattern resistance , which was beautifully broken with a strong $2,571,800 volume, and the candle closed above it .
Following that , traders showed reactions to this level , and the liquidity absorption can be seen in the form of wicks .
🔑 The next important zone is the 0.382 Fibonacci level at $0.675, where we see two possible scenarios :
Reaction and pullback , followed by a breakout .
Breakout first , then a pullback .
You can also place a buy stop at this level — just make sure to use a wider stop-loss .
⚙️ The structure is looking relatively good . The 61.9 RSI region could cause some noise in lower timeframes , but the key area is RSI 70 , which is the entrance to the Overbought zone .
🔼 Volume has been decent , especially considering today is Saturday and a weekend session . This adds more confirmation to the breakout of the V-pattern and the potential end of the correction .
🖥 Summary :
FET is one of those coins with strong recovery potential , operating in the AI sector . It tends to respect classic price action patterns , and with well-drawn Fibonacci levels , volume confirmation , and RSI moving into Overbought , it often activates buy-stop positions cleanly .
💡 Disclaimer :!!! .
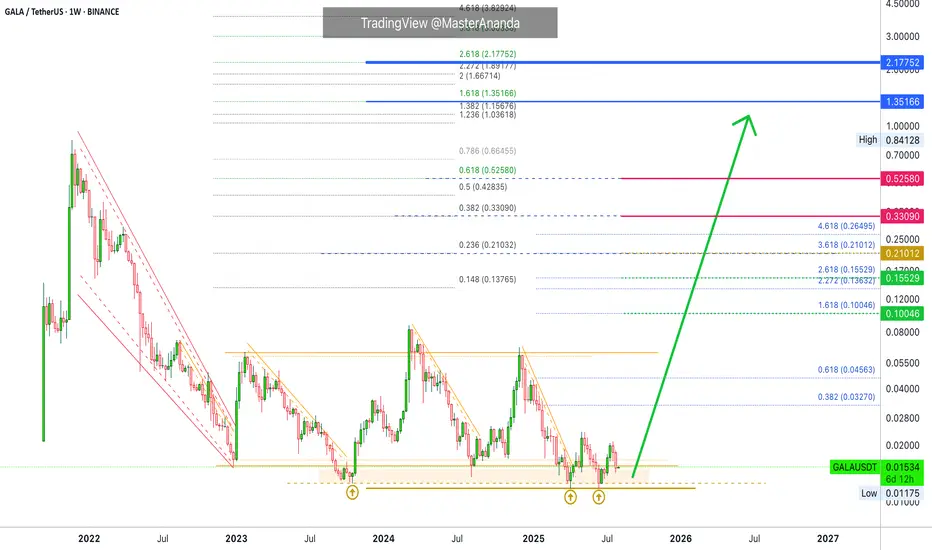
Gala Games Update · Let's Talk Waiting, Patience & TimingThe month is now August 2025. Gala Games closed two weeks red and is now trading back within the "opportunity buy zone." What to expect?
Market conditions have not change. Gala Games (GALAUSDT) is trading at bottom prices. The lowest ever and the lowest possible literally, the opportunity buy zone.
Just a few weeks back, we would look at this zone as a missed opportunity. Now we look at it with disinterest but this is actually the best time possible to buy and hold. This is the best price zone to accumulate in anticipation of what happens next.
The month is now August and we still have five months left in this year. August, September, October, November and December, late 2025. Our predictions, analyses and predictions are all still valid and on-track for a strong bull market in late 2025. There is plenty of time for a bullish cycle to start and develop here. Remember that it can happen that bullish action goes into 2026 and beyond.
Market conditions are great and we are still looking at bottom prices. From the bottom we grow.
Patience is key. This is the best time to accumulate.
Namaste.
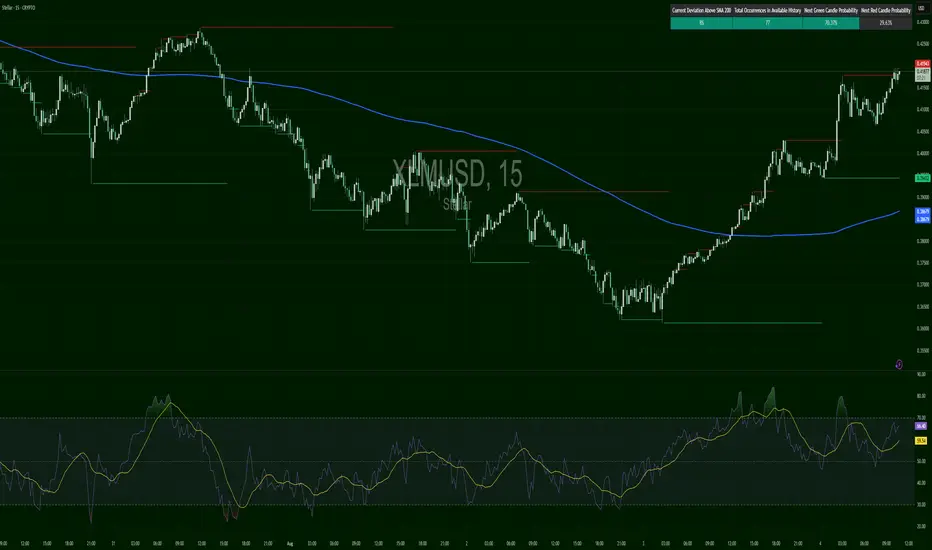
XLMUSD – Ripping Through OrbitBreakout confirmed, with price up to $0.41824, now resting against resistance at $0.41843. RSI is hot at 65+, and the probability model gives a 70% chance of green continuation — the highest among your current tickers.
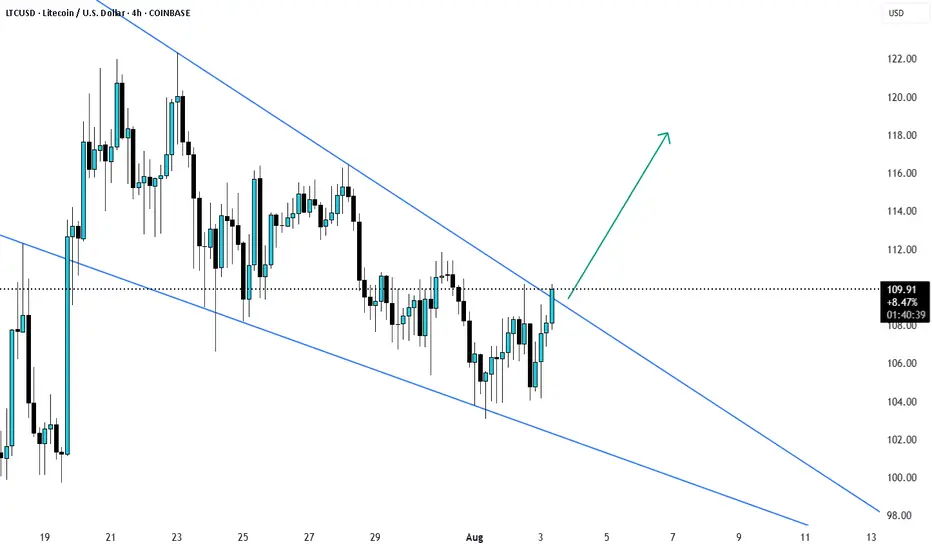
LTCUSD Breakout? wait for candle to closeLTCUSD trading in a down trend has now broken the resistance and wait till the candle is closed and possibly retest and then enter the trade. target can be 118-120
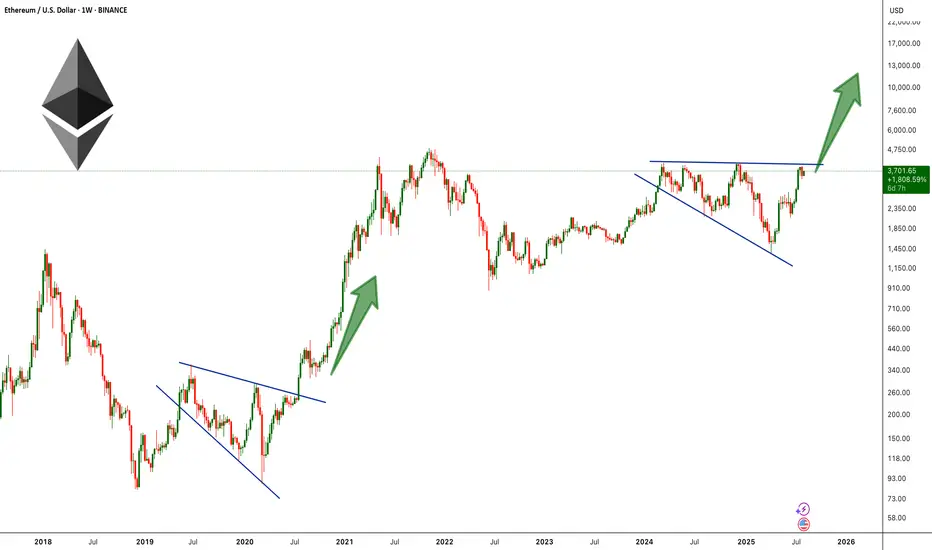
ETH Broadening Wedge Formation !BINANCE:ETHUSDT is forming a broadening wedge pattern on the weekly chart, a structure that often signals high volatility and strong momentum once the price breaks out. This setup is reminiscent of ETH’s 2019–2020 pattern, which also formed as a broadening wedge before breaking to the upside and triggering a historic rally to new all-time highs.
Currently, ETH is pressing against the upper resistance line of the wedge near the $3,900–$4100 zone, a level that has acted as major resistance multiple times in recent months. A decisive breakout above this barrier could ignite strong bullish momentum, opening the path toward the $6,000–$10,000 range.
Cheers
Hexa
BTCUSDT Bearish Expect the resistance 120KBTCUSDT is currently showing signs of a bearish trend, aligning with our previous analysis. The price faced strong resistance near the 120,000 level, from where we expect a move toward the downside.
Technical Insight:
After the recent strong bullish momentum, Bitcoin may enter a corrective phase. This local correction could attract fresh interest from buyers at lower levels. Watch closely for any bounce or consolidation near the 110K 115K zone, which could act as a decision point for the next major move.
Note: A sustained break below 114K could accelerate the downside pressure towards 110K. Conversely, any recovery above 120K would invalidate this bearish scenario and suggest continued bullish strength.
You May find more details in the chart.
Ps: Support Growth like and comments for better analysis Thanks for Supporting.

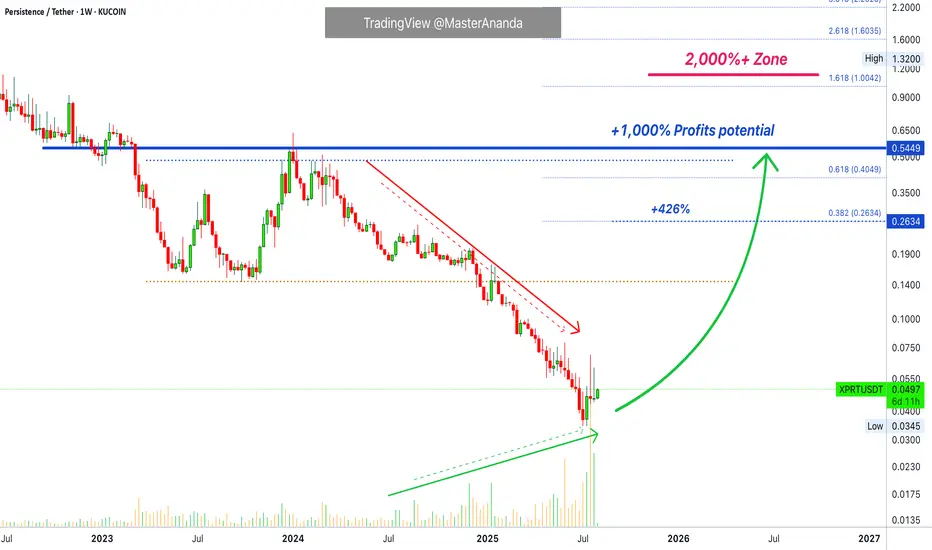
Persistence · Bottom Prices & 2,000% Strong PotentialPersistence. Here we have an interesting chart and trading pair and we start with a volume divergence. What is the divergence? Prices are dropping while volume is rising. XPRTUSDT starts to crash down and as it crashes down volume starts to rise up. And now we have a strong bottom with strong reversal candles. We just witnessed the last market flush. A strong, long and prolonged downtrend will lead to a change of trend.
I like this chart because it has huge potential for growth. Back to baseline prices, which is normally an easy target, in this case strong, give us 1,000% profits potential. As usual, there are low targets for those trading short-term and mid-term and higher targets for those trading long long-term.
The bottom is early but there is still a strong reversal signal because we have a v shaped bottom. A close this week at current prices or higher and we have full technical confirmation. Since we can preempt these movements, we buy before full confirmation because we are bullish on the market and while confirmation is not yet present here other pairs are moving ahead. We know that what one does, the rest follows; When one Crypto recovers, the rest of the market is about to do the same.
We focus on the long-term. We are going up. Short-term, anything goes. Mid- to long-term, watch how prices grow. We are still trading at the bottom, or very close to the bottom and long-term support. This is exactly when the market turns. When everything is down and out for a long while, when long-term holders start to give up, when you are ready to quit, that's when everything changes for the better. Never give up.
Namaste.
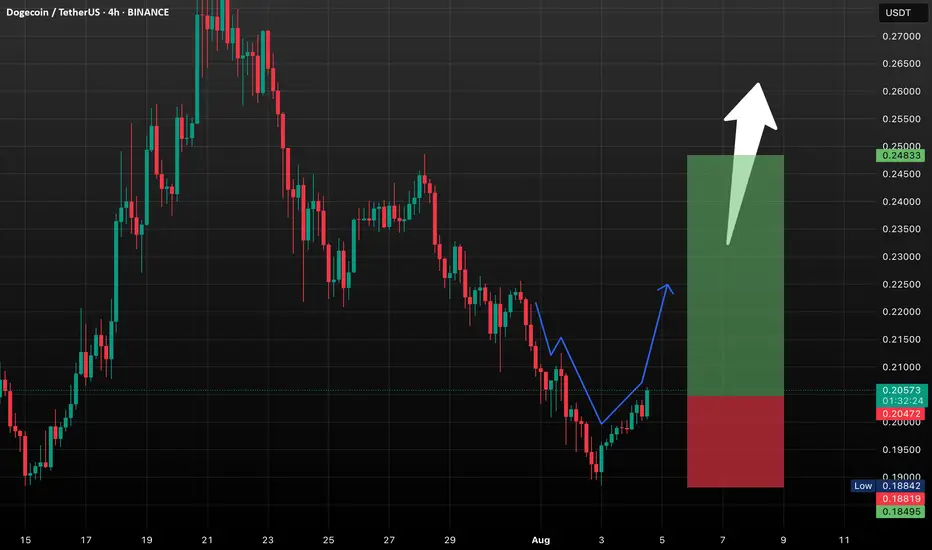
DOGE Setup Heating Up: These Levels Could Define the Next Move!Prediction for the Period Ahead (Next 1–2 Weeks):
*Base case: Holding support at $0.198–$0.200 → test $0.215.
*Bull trigger: Break above $0.215 with volume → possible move to $0.232 and higher.
*Downside risk: Falling below $0.182 could drag the price to $0.175 before any recovery.
DOGE is currently consolidating in a tight range with a neutral to slightly bearish technical bias. However, a breakout above $0.215, particularly supported by volume, could set the stage for further gains targeting $0.232–$0.287 zone. Conversely, a downturn past $0.182 opens the risk of a deeper test toward $0.175. In either scenario, the upcoming weeks seem pivotal...
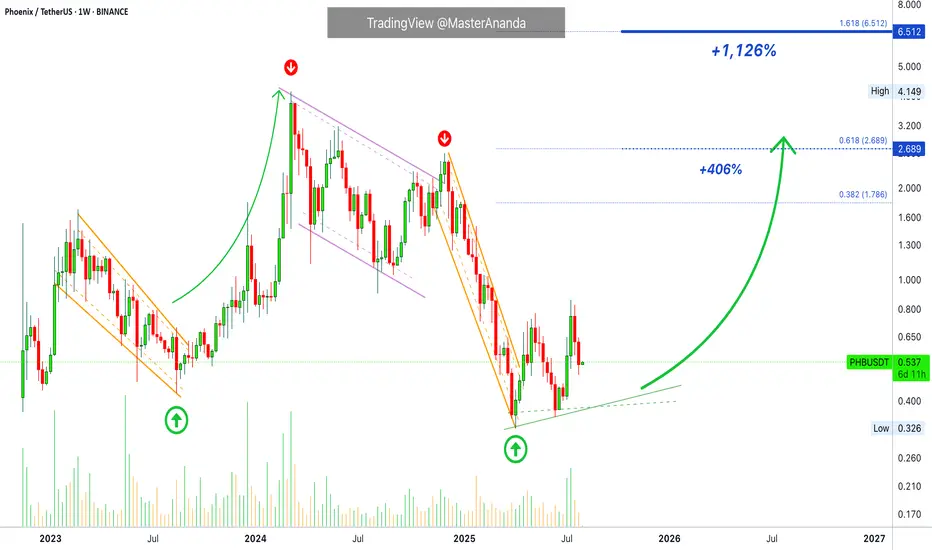
Phoenix Recovers · Easy 1,126% Target @ $6.5 Phoenix is just coming out of a major downtrend. After the main low there was a higher low and rising buy volume. Whenever there is a down wave that ends in strong buying, we know the market is about to turn, we have proof here.
PHBUSDT produced a down move in February 2023. Prices moved lower and a major low happened in August 2023, trading volume started to rise. The rise in volume predicted a change of trend. Then prices also started to rise and we ended up with a bullish wave.
PHBUSDT produced a down move in March 2024, this was a long drawn out correction. The market was moving lower with lower highs, the main one showing up December 2024 and then a major crash. A major low showed up April 2025 and now we are seeing rising volume, the signal that predicted an advance last time. With rising volume and a higher low, we can expect prices to rise next.
And this is it. Phoenix is trading at bottom prices but is slowly starting to recover. Strong bullish action is the next logical step. The market will grow. Crypto will grow. The altcoins are bullish now.
Namaste.
Polkadot (DOT): Aiming To Reach here $5.00-$5.40Polkadot still looks good, even after the pullback, which left the price basically near the area where we started the whole upside game plan. Targets remains the same; R:R for this trade is good as always!
More in-depth info is in the video—enjoy!
Swallow Academy

BTCUSDT local correction is expectedExpecting local correction on BTC, as the price didn't manage to fix above 118500. Main target is around 103-105. In case of the deeper correction - next targets are mentioned on chart.
Invalidation will occur when price will fix above 118500 at least with one full candle.
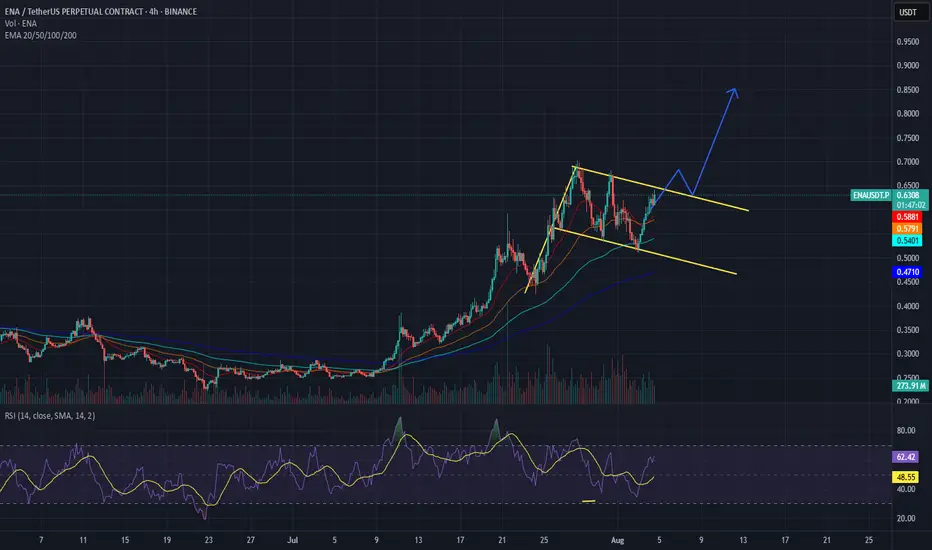
ETHENA Potential Double Bottom Setup UnfoldingEthena (ENAUSDT) is currently developing a possible double bottom reversal structure, with price rebounding firmly from the lower boundary zone. This key support has now produced a bullish reaction, guiding price action toward the upper neckline resistance of the pattern.
A successful breakout above the neckline will confirm the double bottom formation and validate the bullish reversal scenario. This setup aligns with classic accumulation behavior often seen at market bottoms. If confirmed, the projected targets have been clearly mapped on the chart for your strategic positioning and risk management.
Watch the neckline zone closely it holds the key to short-term trend reversal or continued range behavior.
Share your thoughts in the comments.

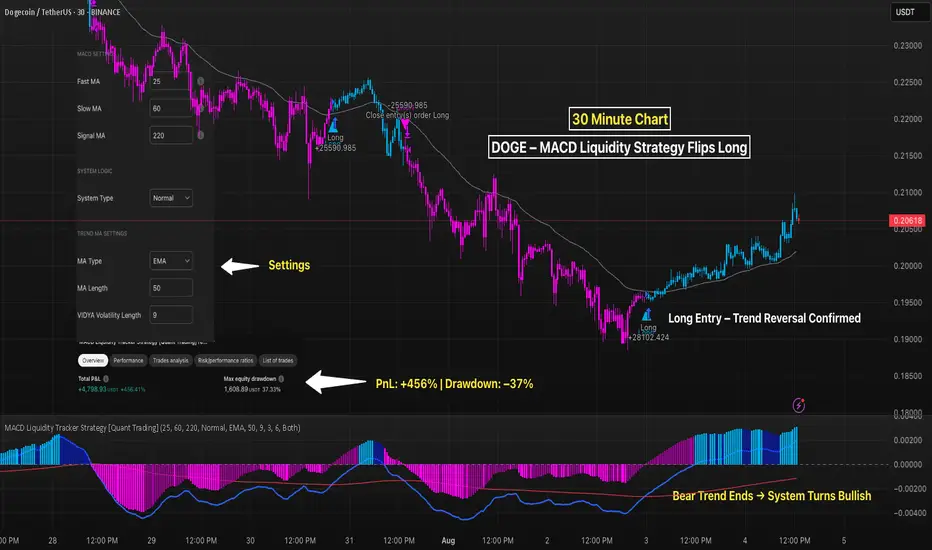
DOGE 30M – MACD Liquidity Strategy Flips Long With MomentumDogecoin just flipped bullish on the MACD Liquidity Tracker Strategy, with a fresh long signal printed around $0.191. After a sustained downtrend marked by persistent short bias (purple candles), the system has now confirmed a trend reversal — backed by both price structure and MACD momentum.
The histogram flipped blue, price reclaimed the trend EMA, and candles turned from purple to blue — all indicating a shift in control.
📈 Strategy Settings:
– Fast MA: 25
– Slow MA: 60
– Signal MA: 220
– Trend Filter: 50 EMA
– Mode: Normal
📊 Backtest Performance (on this symbol + timeframe):
– Total PnL: +456.41%
– Max Drawdown: –37.33%
– Best suited for momentum reversals after consolidation or stop-hunt spikes
If this momentum holds, DOGE could retest local highs around $0.215+ — but a breakdown back below $0.20170 would invalidate the setup.
This system does the heavy lifting — you just follow the signal.
👇 Drop “QTP” below and we’ll send you the full strategy access.
The bull market here will continue if the price break 4K$ As we can see on chart two major resistances which are reason of killing BINANCE:ETHUSDT each time are the red trendline and also the 4K$ resistance zone and soon i believe ETH now has the power to break this resistances and start new high volume pump the targets like 5000$ and new ATH.
DISCLAIMER: ((trade based on your own decision))
<<press like👍 if you enjoy💚

ENAUSDT tradeWe can see how a bullish flag is formed on ENAUSDT. I opened a position close to upper line expecting to see a pump since BTC.D started forming downtrend and bounced from a strong resistance 62% level and EMA-200 on 1-D chart
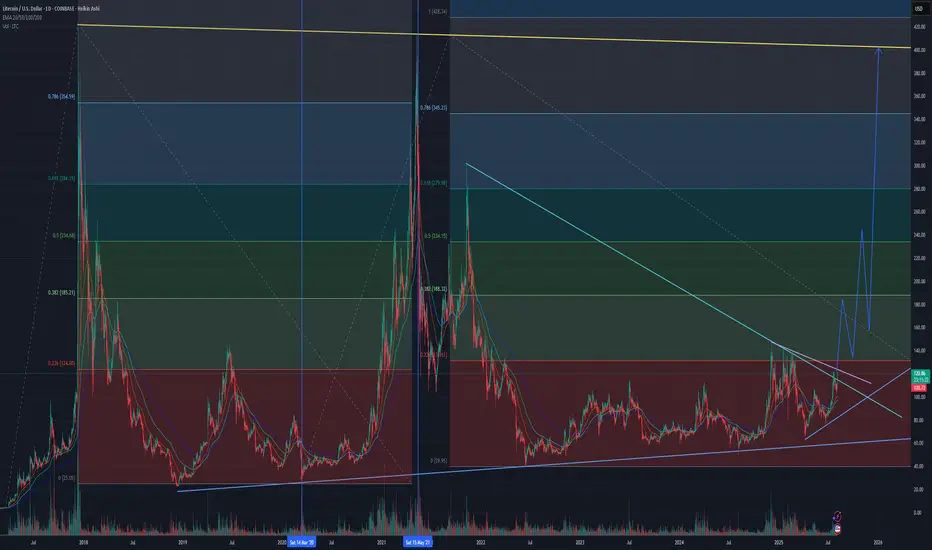
Why Litecoin is my #1 pick right nowObserving the price action between the two vertical blue lines (the '20 to '21 bull cycle), and comparing to the trend based fib extension levels on the left, we have a blueprint for the fib levels that LTCUSD responds to. At the .236 fib, a 24% pullback. At the .382 a 36% pullback. At the .5 a 38% pullback. Then the market got super heated and it blew past the .618 and had another 38% pullback before the final push up to $413, followed by a 75% "correction".
I'm using those fib levels for my sell/buyback zones in the current bull cycle:
- The first one is at $131, but I think LTC may blow past this one since it's so close to where LTC is breaking out of the trendline and the crypto market just had a retrace.
- The second level is at $188.
- Third level at $234.
- The final level I'm aiming for is the golden trend line at around $400.
- Based on breaking out of the long descending wedge on the LTC:BTC chart, it's possible for LTCUSD to have a huge blow-off top and hit upwards of $600.
Looking at the LTC:BTC pair, (see my last post), Litecoin has a huge potential in the current bull cycle. In the '20-'21 cycle it didnt breakout against bitcoin until the end of the bull run and that breakout wasn't major. LTC:BTC is currently breaking out of a long-term trendline with significant volume.
We'll see. But one thing is for sure, LTC held up well against BTC during the recent drop from $119k to $112k, and now it's pumping steadily. Lookin' good.
What do you think?
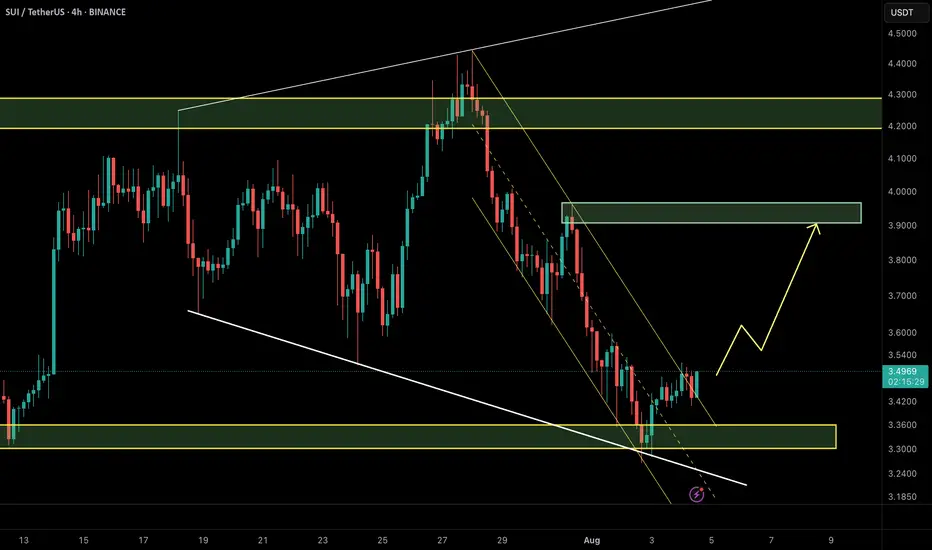
SUI/USDT – Price Outlook (2H TF)🔍 Updated Aug 4, 2025 | SMC + NeoWave
SUI has broken out of the descending channel and is currently holding above the strong demand zone around $3.35–$3.40. This zone overlaps with a bullish order block and prior trendline support.
📌 Bullish Scenario (preferred):
Price confirms support → Push toward $3.90–$4.00 supply zone.
📌 Invalidation:
A close below $3.35 invalidates the setup and suggests continuation of the correction.
💡 Tip: A breakout of structure (BOS) + mitigation of OB = solid confluence for long setups.
ARUSDT Gearing Up for a Powerful Wave 3 LaunhARUSDT has completed its corrective phase via a well defined ending diagonal, followed by a strong impulsive move completing wave 1. Price recently tested a significant supply zone, leading to a sharp retracement toward $4.48, aligning with the previous bottom structure.
This zone is projected to form the immediate base, and our plan is to accumulate within this range, targeting the anticipated wave iii, historically known as the strongest and most extended move in the Elliott Wave sequence.
The entry plan and potential targets are clearly outlined on the chart. Feel free to share your view.

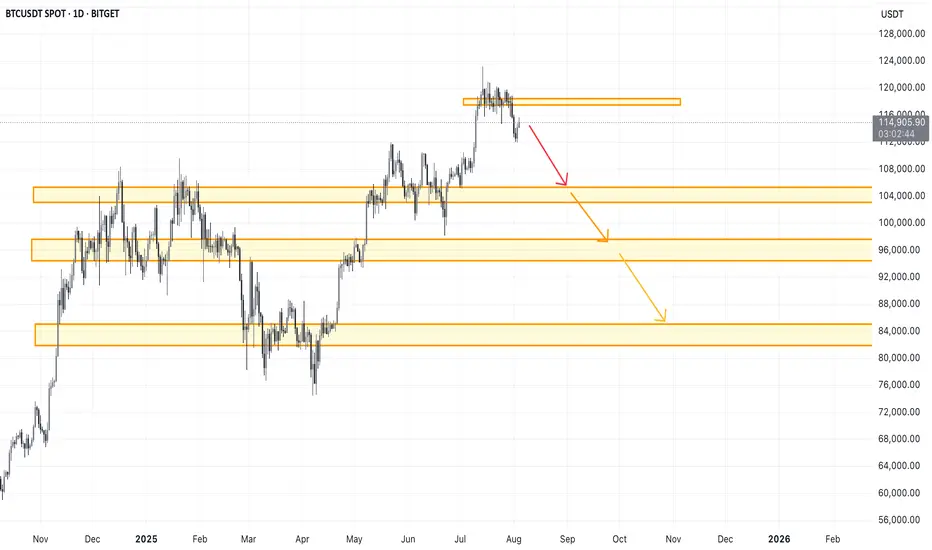
Bitcoin Range for August?Historically August has been a tough month for crypto in the past with mostly flat to negative returns. For that reason, although not a perfect science, I would not be surprised if we see a rangebound environment continuation for BTC.
So what would that look like? Structurally there are three thirds to the range, currently price is looking to break through into the upper third after bouncing off the bottom third bullish orderblock.
Trade setups will naturally present themselves as rotational plays both bullish and bearish at the extremes of each of the thirds but much larger trades from the range top and bottom.
Altcoins are lagging behind BTC structurally so where BTC has been choppy for a few weeks, most large cap alts have hit their highs and are now looking to settle into a range before the next leg up.
