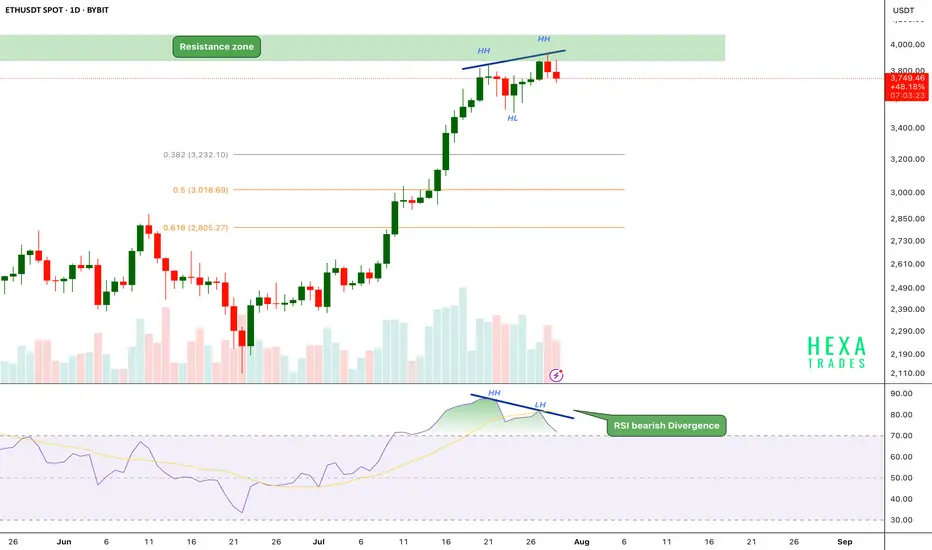
ETH Bearish Divergence!CRYPTOCAP:ETH has been in a strong uptrend, printing consistent higher highs (HH) and higher lows (HL). However, on the daily chart, the price has now reached a critical resistance zone near the $3,800–$4,000 range.
Key Points:
🔸 Bearish RSI Divergence
While price action has formed a new higher high, the RSI has printed a lower high, signaling bearish divergence.
This indicates that upward momentum is weakening even as price attempts to push higher — a common early warning of a possible short-term reversal.
🔸 Fibonacci Retracement Levels
The fib 0.382 at $3240 and 0.5 and 0.618 retracement levels are sitting around $3,000 and $2,800, respectively, potential targets if a correction follows.
🔸 Volume Profile
Volume is gradually declining as price approaches resistance, suggesting buyer exhaustion.
If the price breaks above the $4,000 psychological resistance, we could see a strong bullish move.
ETH is facing strong resistance after a powerful rally, with RSI bearish divergence and weakening momentum hinting at a possible short-term pullback. We should be cautious entering fresh longs here without confirmation.
Support: $3,200, $3,000, and $2,800
Cheers
Hexa
BINANCE:ETHUSDT BITSTAMP:ETHUSD
Crypto market
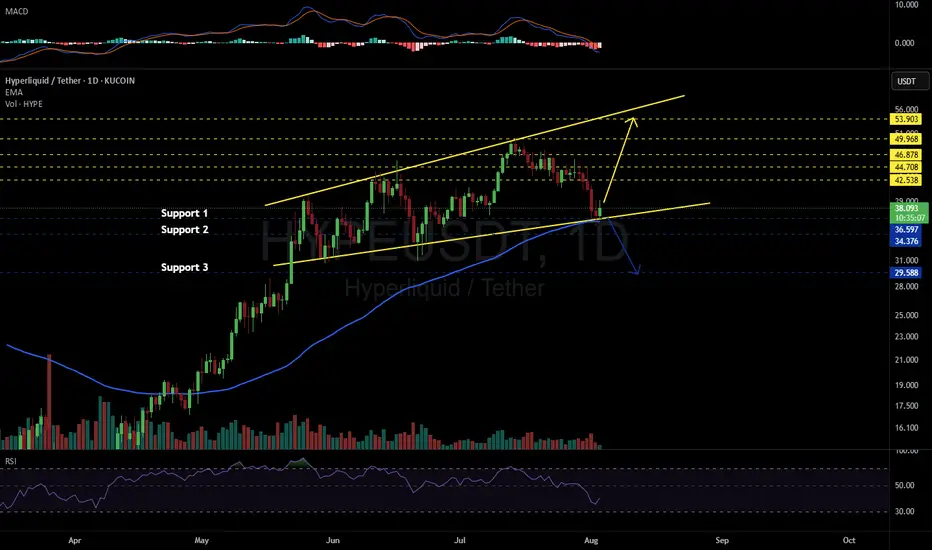
HYPEUSDT 1D#HYPE is moving inside an Ascending Broadening Wedge pattern on the daily chart — a structure that typically carries a bearish bias.
However, for now, #HYPE has bounced from the wedge support line and the daily EMA100, suggesting a possible short-term move to the upside.
If momentum continues, potential targets are:
🎯 $42.538
🎯 $44.708
🎯 $46.878
🎯 $49.968
🎯 $53.903
📉 On the other hand, if price breaks below the pattern, the daily EMA100, and the $36.597 support, deeper correction could follow toward:
🔻 $34.376
🔻 $29.588
⚠️ As always, use a tight stop-loss and apply proper risk management.

Is $Hype worth the hype?Ascending Channel:
- The price has been moving inside a rising (bullish) channel since mid-April 2025.
- If this channel holds as support, the price may bounce upward again, continuing the uptrend.
- If it breaks below the channel, this could signal a trend reversal or deeper correction.
Tips
- Trend followers may look to buy on dips near the lower channel line.
- Breakout traders should watch for moves outside the lower channel line.

VINE Short x3Short VINE $0.70 bouncing against 20EMA
Target $0.60 on the trend line to sell 100%
Stop $0.744 which is above highest candle on the hour line above the 20EMA

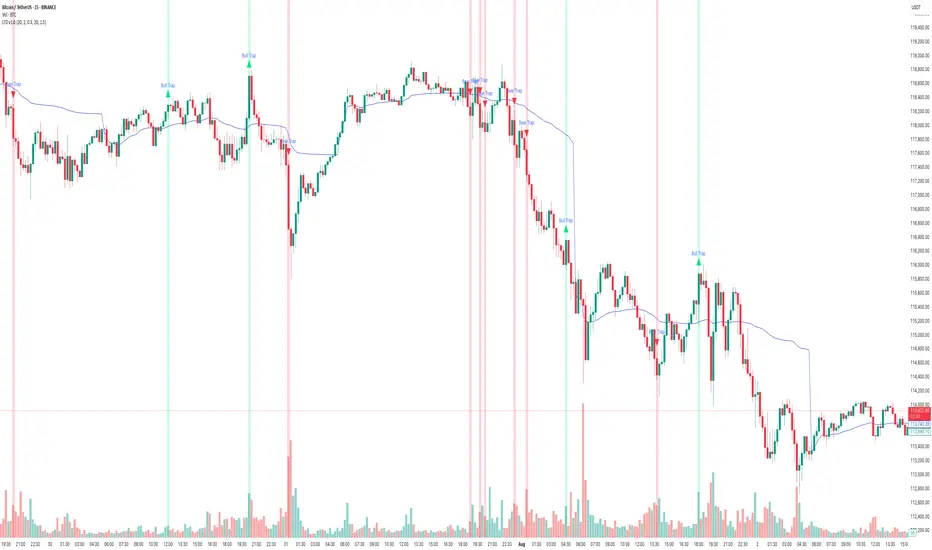
How to use Free TradingView Indicator to detect Liquidity TrapsPerformance on Shared BTC/USDT Chart
Indicator : Liquidity Trap Detector (LTD)
Timeframe: 15-sec (as per chart)
Observation Period: Full session visible in the screenshot
1. Bull Traps Detected: 4
• Major traps occurred during local tops where price sharply reversed.
• Example: ~19:15 and ~21:00 marked strong reversals after fake breakouts.
2. Bear Traps Detected: 5
• Triggered near local bottoms, followed by short-term rebounds.
• Example: ~22:15 and ~00:30 triggered after sudden downward sweeps.
3. Accuracy:
• Approx. 70–75% of traps correctly led to meaningful reversals.
• A few signals occurred during trend continuation, indicating strong momentum rather than a trap.
4. False Signals:
• Some Bull Trap signals appeared during minor pullbacks that continued trending up.
• Filtering with cooldown periods or trend filters (e.g., EMA alignment) can reduce noise.
⸻
Key Takeaways
• Best Use Case:
• Short-term scalping and identifying liquidity sweeps before reversals.
• Works well in ranging or high-volatility conditions.
Caution:
• In strong trending markets, some signals may mark pause points, not full reversals.
• Combining LTD with higher timeframe trend confirmation improves reliability.
It’s nonsense to review the Bitcoin chart on a linear scale.It’s nonsense to review the Bitcoin chart on a linear scale.
I drew equivalent rising support lines on both scales:
📉 Linear support = $27K
📈 Log support = $52K
The difference is massive.
Log scale reveals reality.

BRETT HTF Liquidity Raid + Demand TapWhat’s up, Candle Craft fam 🔥
We’re eyeing a high-probability bounce zone below structure for BRETT. No need to wait for confirmation here — the liquidity + structure setup is too clean.
📍 Updated Setup:
– Price broke rising wedge + retracing
– Anticipating dip into HTF demand pocket
– Bounce expected from 0.04747–0.04307 range
– Optional CHoCH entry if you want confirmation on M5
🎯 Entry: Limit orders in 0.04747–0.04307 zone
🩸 SL: 0.04150
🎯 TPs:
TP1: 0.05120
TP2: 0.06080
⚠️ Volatility Warning:
With Fed rate decision and US crypto framework coming today, we expect major volatility and potential flushes across alts. This could be the liquidity event that delivers the entry.
Candle Craft | Signal. Structure. Execution.

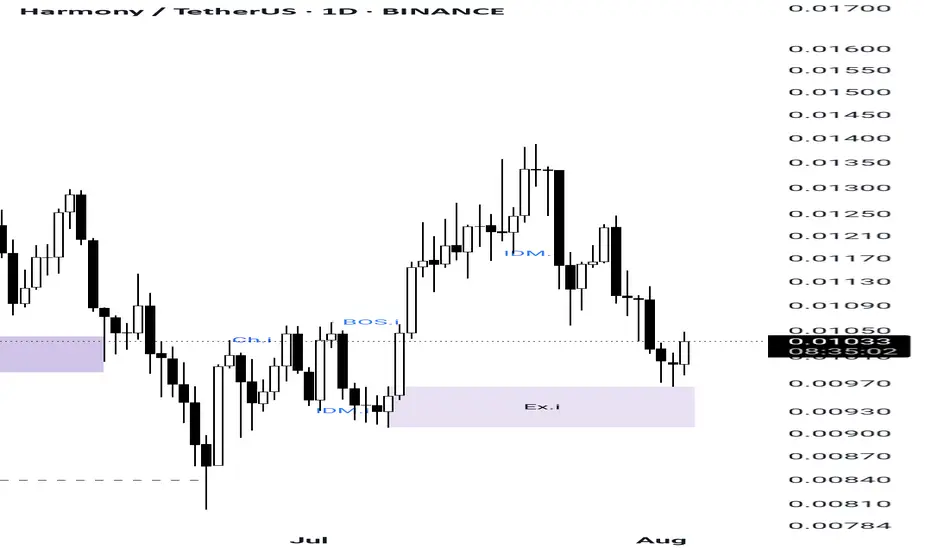
Harmony(ONE) is going to pump...As you can see in ONE Structure it made a minor structure and price touched its minor EX orderblock and for sure it made a SCOB confirmation
So now its ready to pump...
It's my own analysis and it's not investment advise , so DYOR
Bitcoin Forming a New Range?After all of the ups and downs over the past few days, I zoom out to a higher time frame to get a grasp of what's really happening. With three hours or so left in the day it looks most likely that the formation of a new range is in the works. I'm looking for two options over the next few hours, one being that it gets right back into the previous range and is all just a wick on the weekly chart which caused three days of panic for absolutely no reason. This would probably be hilarious but also the less likely outcome!

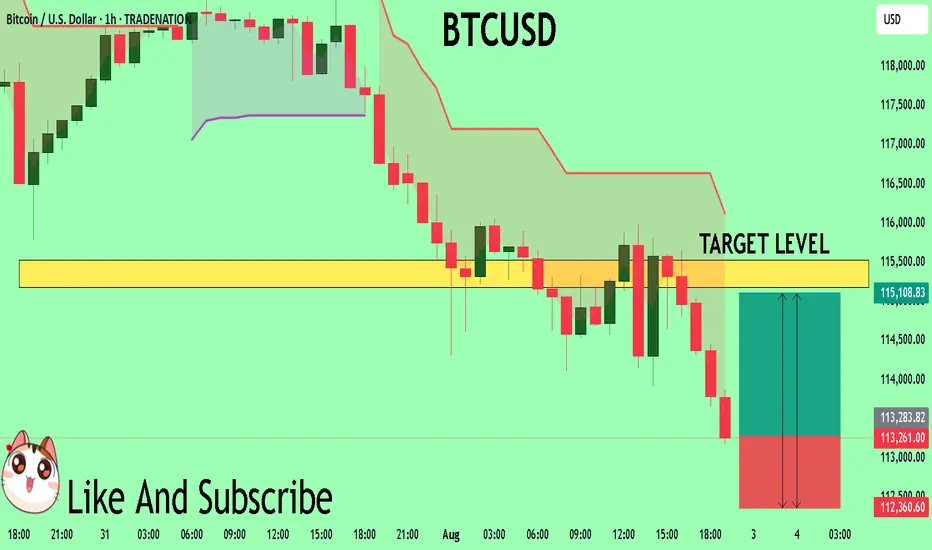
BTCUSD Will Explode! BUY!
My dear followers,
I analysed this chart on BTCUSD and concluded the following:
The market is trading on 11326 pivot level.
Bias - Bullish
Technical Indicators: Both Super Trend & Pivot HL indicate a highly probable Bullish continuation.
Target - 11517
Safe Stop Loss - 11236
About Used Indicators:
A super-trend indicator is plotted on either above or below the closing price to signal a buy or sell. The indicator changes color, based on whether or not you should be buying. If the super-trend indicator moves below the closing price, the indicator turns green, and it signals an entry point or points to buy.
Disclosure: I am part of Trade Nation's Influencer program and receive a monthly fee for using their TradingView charts in my analysis.
———————————
WISH YOU ALL LUCK
August 2025 Monthly ScenariosChartingMyLosses | Monthly Analysis | 1M TF
Speculative structure meets macro zones
🔵 Scenario 1: Direct continuation to the highs (Blue Path)
Price holds above PH June and pushes toward the 0.78 retracement of July, targeting 121,399 USD. This would be a classic bullish continuation fueled by residual momentum and liquidity above recent highs.
🟢 Scenario 2: Support retest before continuation (Green Path)
A sweep of the 109,893–103,009 USD zone (June’s fib cluster and previous breakout range) leads to a rebound. This would validate the zone as a new macro support and could signal institutional reaccumulation before an end-of-month push to the highs.
🔴 Scenario 3: Deep retracement into OB + FVG (Red Path)
Bears attack, dragging price down to the 98,459–96,000 USD range, tapping into a Daily Order Block + FVG inefficiency. A full liquidity sweep in this zone could set up a powerful reversal toward the new max, but would require market-wide risk-on behavior to confirm.
🧠 Speculative Note
In just one month, BTC can traverse thousands of dollars. The real question isn’t "will it drop or pump?" but rather "where is price most efficient to move next?". Keep an eye on volume, reactions at fib levels, and especially how the market behaves near the prior June low (PL).

BTCUSD ANNASIS OUTLOOK BULLISH MOVE POSSIBLE 4/8/2025BTCUSD – Bullish Opportunity
Current price holding strong above $114,400
Next target: $117,100
Trend momentum remains bullish
Breakout continuation possible above $115,000
#BTCUSD #BullishSetup #CryptoLive #BreakoutWatch

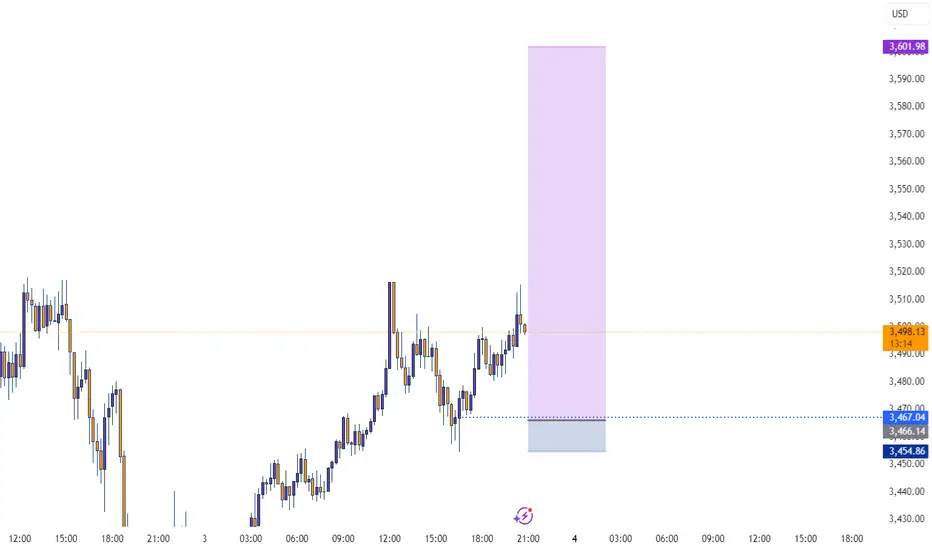
Patience to identify the market trendBased on the previous analysis, after hitting the sell target, the price made an upward correction.
Right now, it’s unclear whether we’re seeing the beginning of a trend reversal to the upside, or if the price is going to drop back below the zone, giving us another short opportunity.
If it does drop again, there’s a possibility it could fall as far as 3000.
We need to be patient and let the market show its hand — then we can respond accordingly.
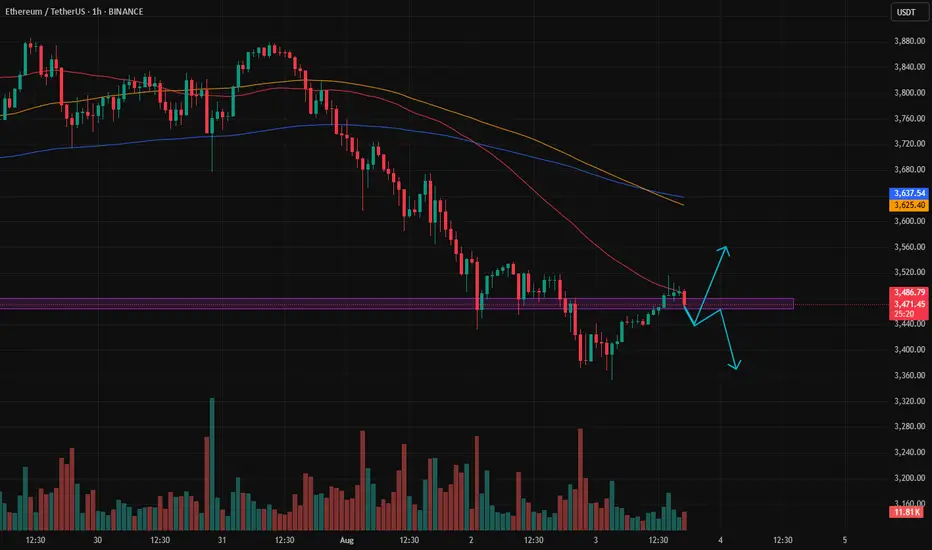
EtherumEth is in bullish trend
on 1D TF there was a bearsish divergeanc which create a correction
scrip has taken support from 0.5 fib level and bouncing back now.
apprently it is forming a flag pattern and it can hit target of 4500 soon.

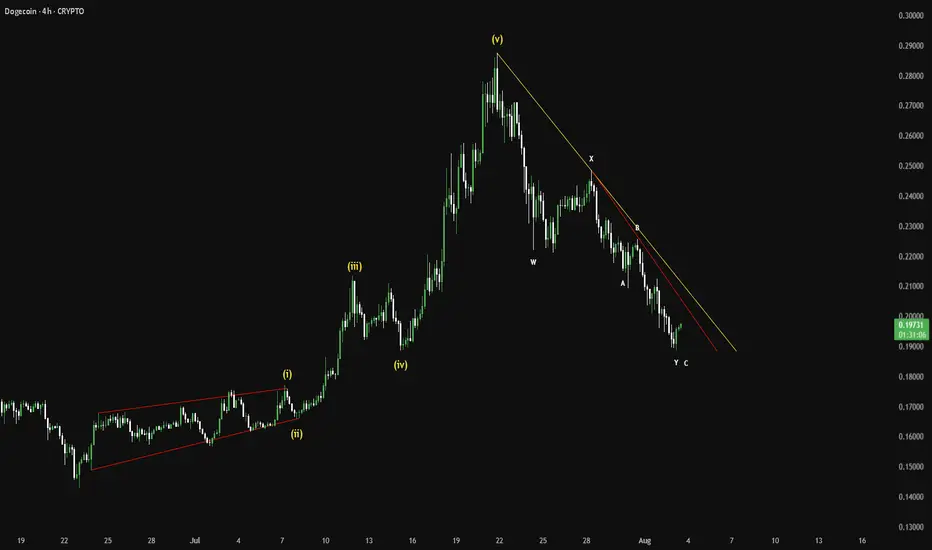
DOGE COIN made a bottom ? start of a new trend ?preferred counts
everything is on the chart , for this dogecoin if not holding then it will move down more

BTC/USD) Bullish Analysis Read The captionSMC Trading point update
Technical analysis of Bitcoin (BTC/USDT) on the 4-hour timeframe, with a focus on smart money concepts like FVG (Fair Value Gap) and support/resistance zones.
---
Technical Breakdown:
1. Price Structure & Path Projection:
BTC is currently in a sideways range, but the drawn projection suggests a potential bullish reversal from the key support zone or the FVG level.
Two bullish paths are suggested:
One bounces from the key support zone (~114,725).
The other dips deeper into the FVG level, sweeping liquidity before heading higher.
2. Key Zones:
Key Support Level: Around 114,700–114,800, aligning with the EMA 200 and prior reaction levels.
FVG Level (Fair Value Gap): Just below the support zone — marked as a potential liquidity sweep area before bullish continuation.
Resistance Zone: 123,069.65, where partial profit could be taken.
Final Target Point: 130,312.02, projecting a strong bullish move from the base.
3. EMA 200 (Blue):
EMA sits around 114,685.97, acting as a strong dynamic support, supporting the bullish scenario.
4. RSI (14):
RSI is neutral at 51.10, providing room for bullish momentum without being overbought.
Mr SMC Trading point
---
Trade Idea Summary:
Bias: Bullish
Entry Zone:
Conservative: Near 114,725.18 (key support + EMA 200)
Aggressive: Deeper at FVG level if price sweeps that zone
Targets:
TP1: 123,069.65 (resistance zone)
TP2: 130,312.02 (main target)
Invalidation: Break and close below FVG zone would negate the setup
---
Please support boost 🚀 this analysis)

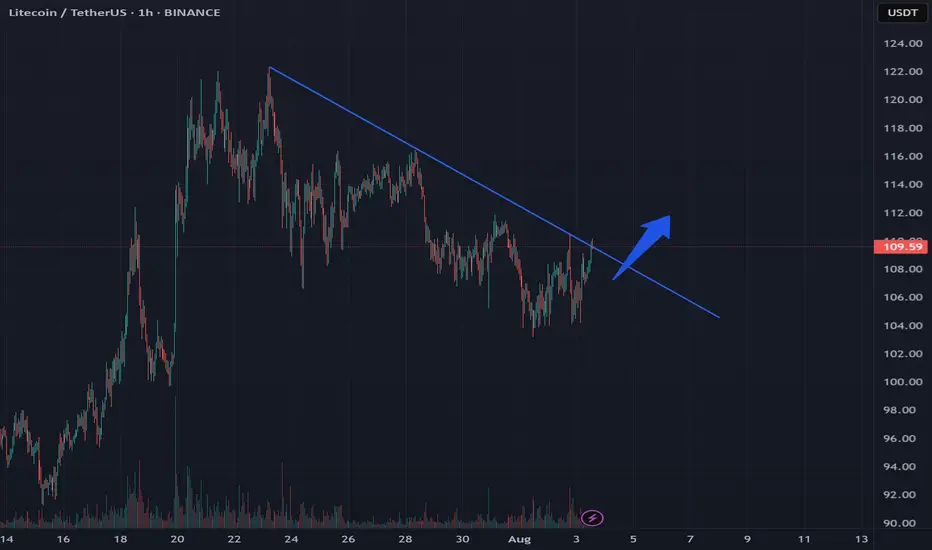
LTC Forms Triangle Pattern Signaling Potential BreakoutLTC is currently forming a triangle pattern on the 4-hour time frame. A break of the upper trend line may indicate an exit from the support zone. Based on historical dynamics, such breaks often lead to upward momentum with a higher probability.
Current price: $108.12
With a higher probability, the price can reach the marks of $111 to $115
The price can also touch the lower marks of $105.4
This analysis is based on the technical pattern and also incorporates AI to provide more accurate results.
Buy BTCUSD Focus on the $117,500–119,000 levels: a breakout upwards could mean the beginning of growth, a breakout downwards — a strong correction.
Follow the actions of institutional players, flows into ETFs, and political and regulatory news.
Manage risk: BTC remains a volatile asset, the possibility of large peaks and falls remains.

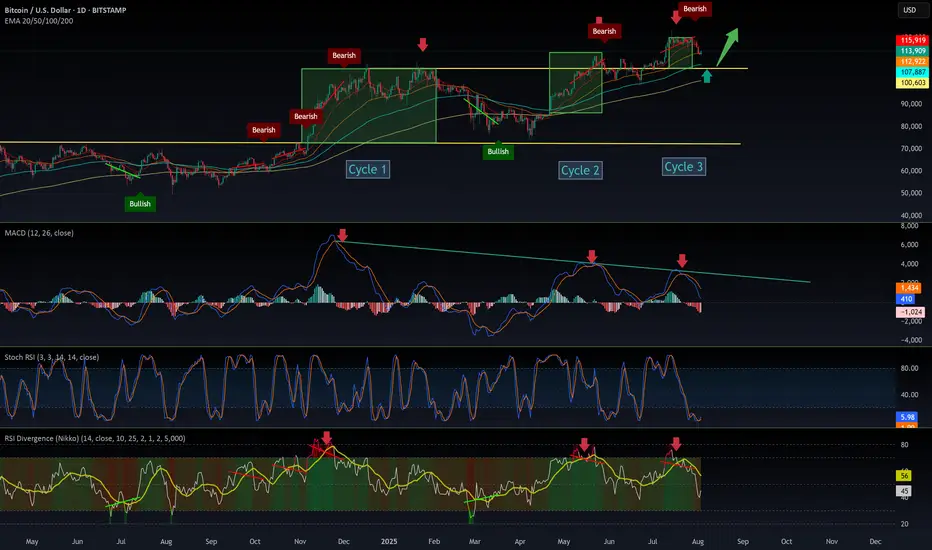
$BTC New Cycle: It’s Hard Not to Notice the ShiftSince December 2024, CRYPTOCAP:BTC has been closely following the SPX500, forming three similar cycles—each decreasing in intensity and shorter in duration.
The similarities are striking, especially when analyzing the MACD and RSI.
Each cycle ends with a bearish divergence.
Each cycle sees a rebound or bottom during consolidation, often touching the top of the previous cycle.
Most importantly, the cycles are accelerating.
However, it’s difficult to draw a definitive conclusion. These patterns are new in Bitcoin’s history, and there's no past reference for such institutional-driven behavior.
I believe the entry of institutions is reshaping Bitcoin’s rhythm. Their strategy is accumulation, not speculation, which brings more stability but also alters traditional crypto cycles.
What do you think will be the consequences of this shift?
Drop your thoughts in the comments👇
BTCUSD: Local Bullish Bias! Long!
My dear friends,
Today we will analyse BTCUSD together☺️
The market is at an inflection zone and price has now reached an area around 114,020 where previous reversals or breakouts have occurred.And a price reaction that we are seeing on multiple timeframes here could signal the next move up so we can enter on confirmation, and target the next key level of 114,821.Stop-loss is recommended beyond the inflection zone.
❤️Sending you lots of Love and Hugs❤️