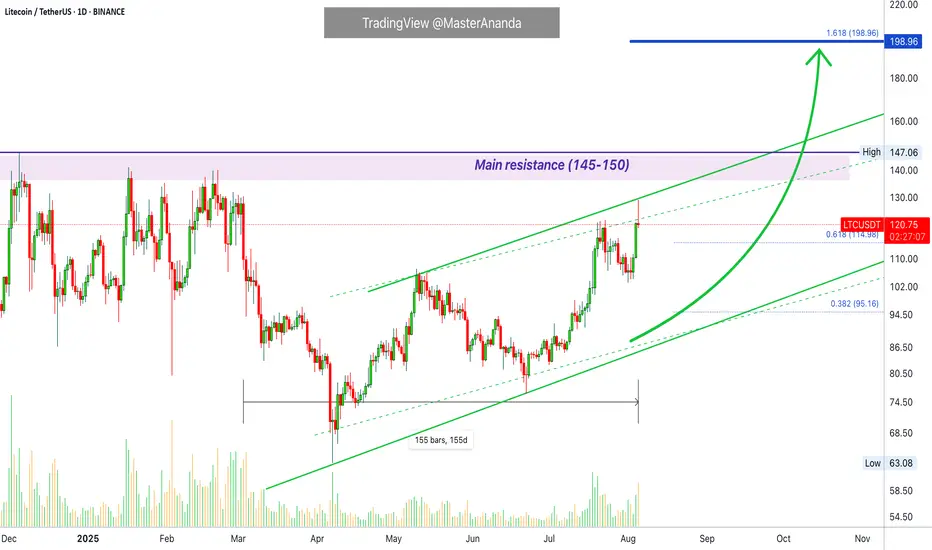
Litecoin Hits a New High · Update · Highest Price in 5 MonthsToday Litecoin hit its highest price in more than five months, since March 2025. Soon Litecoin will break its December 2024 high and produce the highest prices since the last bull market, 2021. We are getting very close now.
A few weeks back the market was in a similar situation, doubt started to creep in and people wondered if the market was set to endure a long-term correction or resume higher. We used Bitcoin Cash which was moving ahead to prove the rest of the market would do the same and it happened as predicted. Before Bitcoin Cash, further back, we used XRP and it worked.
Today we are looking at Litecoin and the action this chart is showing matches additional growth. While some pairs are retracing or consolidating, others continue to move ahead. This only happens in a bull market, and, when Bitcoin retraces while the altcoins continue to grow, this is a sure sign that the bulls are buying and the market expects additional growth.
Additional growth but remember retraces will always be present along the way. The market grows steadily but it takes time. Five steps: three steps forward, two step back. Allow time for variations. Retraces and corrections are an opportunity to rebuy and reload.
Secure profits when prices are up; buy back at support.
Sell when prices are high; sell when the market is green.
Sell when everything feels fine and great.
Buy when prices are low; buy when the market is red.
Buy when everything feels down and depressed.
Go against the market impulse. Make your decisions based on information. The market is growing and set to continue growing long-term. Choose wisely and let the market take care of the rest.
Namaste.
Crypto market
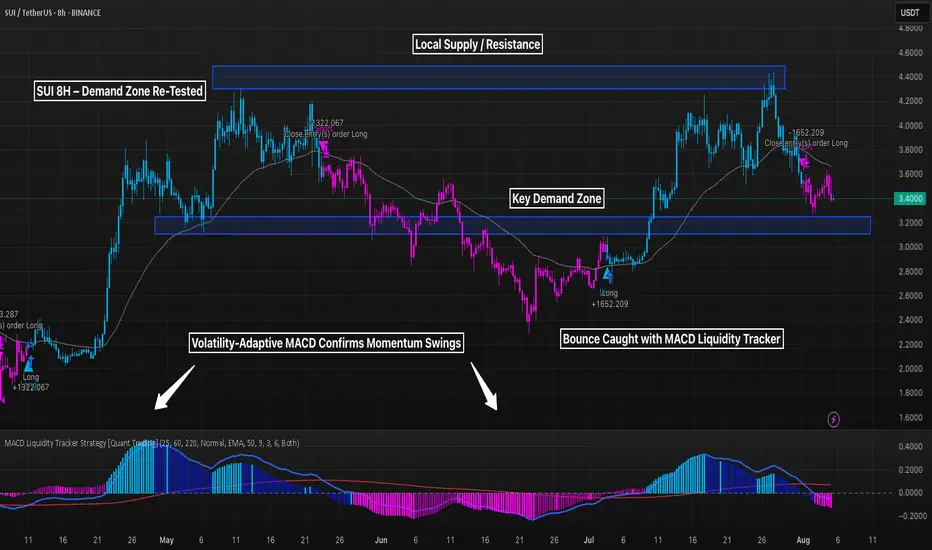
SUI 8H – Demand Zone Re-Tested, Will Strategy Fire Again Soon?SUI is approaching a major demand zone after rejecting from local highs near $4.60 — and the MACD Liquidity Tracker Strategy just closed its most recent long position. With momentum fading and price nearing structure, the next signal could be pivotal.
🔹 Strategy Settings
MACD: 25 / 60 / 220
System Type: Normal
MA Filter: EMA 50, VIDYA smoothing (9)
This configuration has historically excelled on volatile pairs like SUI — catching high-RR reversals from demand zones.
🔹 Price Structure
Key support sits between $3.10–$3.30 — a previous breakout base.
If price retests this zone and MACD curls, we may get another high-conviction entry.
Resistance remains at $4.50+, where the last major exit was triggered.
🔹 Momentum Check
MACD histogram flipped bearish, but flattening — suggesting weakening downside.
Strategy will likely stay flat until a new trend forms, giving traders time to prep.
Will the bot strike again at support — or is SUI setting up for something deeper?
Let’s analyze 👇
DOGE 1H – MACD Liquidity Strategy Captures Long/Shorts This chart showcases the MACD Liquidity Tracker Strategy running on DOGE 1H — using optimized settings tailored for crypto volatility. With a 100% gain on this run and multiple entries capturing major moves, this configuration continues to show powerful edge on low timeframes.
🔹 Strategy Details
Strategy Type: Normal
MACD Settings: Fast 25 / Slow 60 / Signal 220
Trend Filter: EMA (50) with VIDYA smoothing
Short trades disabled for directional clarity in volatile trends
🔹 Trade Highlights
Captured a +27.24% move on the initial breakout
Re-entered on trend continuation, banking +15.84% on the rebound
Just fired another long signal off recent lows — potential bounce forming?
🔹 Backtest Stats
Total PnL: +997.35 USDT
Win Rate: ~50%
Max Drawdown: 49.92%
Ideal for traders comfortable with high-volatility setups and swing entries
Would you trust the MACD Liquidity Tracker for your DOGE entries?
Let me know how you’d tweak it 👇

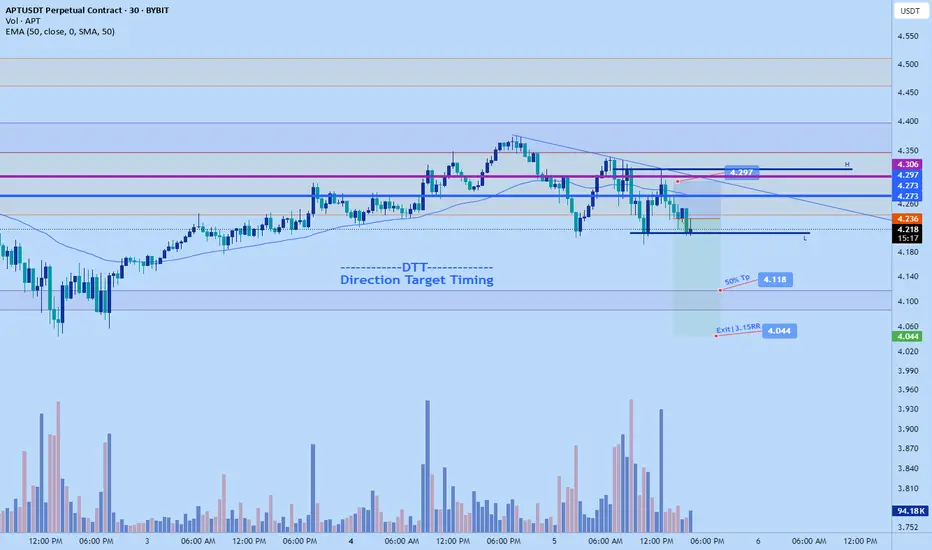
Aptos short to $4.044sl: 4.297 or higher
Tp1: 4.118---50%
full exit at $4.044
Overall market seems to be breaking back down and aptos also looks like to do so as market have flipped bearish on 1hr to 4hr tf aligning with daily downtrend. Anticipating new lower lows.
Elliott Wave Science: Bitcoin Steadily Chases $400KAfter some back and forth, I have located the needed confirmations to find high confidence that Bitcoin stretches toward the $400K mark by September-December 2026. I will continue to track the waves day by day, week by week, while applying the unbiased science of Elliott Wave Theory.

XRP 1D – Major Support Bounce Inside Channel, Will Range Hold?XRP just defended a critical long-term support zone near $2.70 — aligning perfectly with the mid-channel range and previous breakout level. After rejecting from multi-month resistance around $3.15, price has returned to structure for a potential higher low.
🔹 Structure & Range
The macro channel (white lines) has guided price action for over 9 months.
XRP recently tagged the upper boundary, rejected, and pulled back into support around $2.70.
This zone was tested multiple times historically — it now serves as a pivot for continuation vs. reversal.
🔹 Momentum Signal
The Stoch RSI is printing a bullish cross from oversold — a classic confluence for reversal setups.
If the support zone holds, we could see price attempt another run at the $3.15–$3.30 resistance and eventually challenge the upper trendline.
🔹 Macro Outlook
Holding this structure = bullish midterm continuation.
Losing it opens the door for a drop back toward $2.00–$2.25, where the lower channel support sits.
Will XRP defend this channel — or is a breakdown back to $2.00 inevitable?
Drop your analysis in the comments 👇

on weekly chart btcusdt long term shortAccording to the weekly chart it would say that btc is near or at the peak and in the next few weeks or months it will start to fall.
As can be seen on the chart, if btc continues to follow the time interval of 202 bars and the fractal structure of the previous period, the next decline should last longer than a year. The lines of resistance in that case would be:
1. green line or about 90k
2. orange line or about 55k
3. red line or about 15k
Disclaimer: This is not financial, investment, trade or other advice. This is my personal opinion which can very easily be wrong.
You trade at your own risk.

Bitcoin Short SetupHi everyone.
In Bitcoin 1H TF we have a CHoCH followed by a BOS and a pullback, I think it is possible the price meet this area and then continue to go down...
Let's see what happens...
Good luck

ETH LongETH pulled back to .5 fib on daily which is also near the EMA20 and max pain for long (3,553). I'm expect price to move up from here or dip to the .618 level at the most (~3,500).
Trade: Using ETHU (2x lev ETF). Setting stop loss just below 3,500. Initial TP 3,825 and will use a trailing stop to lock profit in along the way. Ideally, I will let this trade run to $4-6k range if the momentum is strong.

BNBUSDT 4H Review🔍 Technical Structure
📉 Descending Channel (orange lines)
The price was moving in a clear downtrend within the channel.
A breakout from the channel to the top occurred, which is a potentially bullish signal.
The price is currently testing a level above the channel—a classic retarget (retest) of the breakout.
🟩 Support/Resistance Levels (green and red lines)
✅ Support:
760.97 USDT – currently tested as support after the breakout from the channel.
739.81 USDT – local support, previous resistance.
717.89 USDT – stronger support, lower boundary of the channel.
❌ Resistance:
779.87 USDT – short-term resistance.
809.72 USDT – key resistance on the higher timeframes.
📊 Volume
Volume increased during the breakout from the channel, supporting its credibility.
It is currently declining slightly, which may suggest consolidation or waiting for another impulse.
🔄 Stoch RSI Oscillator (at the bottom of the chart)
Currently leaving the overbought zone (>80) and heading down.
Potential bearish or consolidation signal for the coming sessions.
🧠 Scenarios
1. Bullish Scenario (continuation of the breakout):
If the 760.97 level holds as support,
A move to 779.87 is possible, followed by a test of 809.72.
2. Bearish Scenario (false breakout):
If the price falls below 760.97 and fails to stay above 739.81,
A retest of 717.89 or even a return to the descending channel is possible.
📌 Conclusions
Currently, the key level is 760.97 USDT – maintaining it will confirm the bulls' strength.
Oscillators suggest a possible correction or consolidation.
For a long position: a good place to test 760.97 with a narrow SL below 739.81.
For a short position: a potential signal if 760.97 is not maintained.

BTC to cross SMA50 soon....When BTC crosses SMA50 (and it's getting awfully close) the dip will be more aggressive. Then it's only a matter of time when it crosses SMA200, and we all know what that means. Following the trends, cycles, history, and the problems that BTC solves (none, really) this is a bubble waiting to burst. Keep an eye on SMA9 (now under it) and Ultraalgo signals for confirmation if looking to get in, but the economy is cooling quickly and people will be looking to liquidate positions very quickly. Stay safe out there and always do your due diligence!

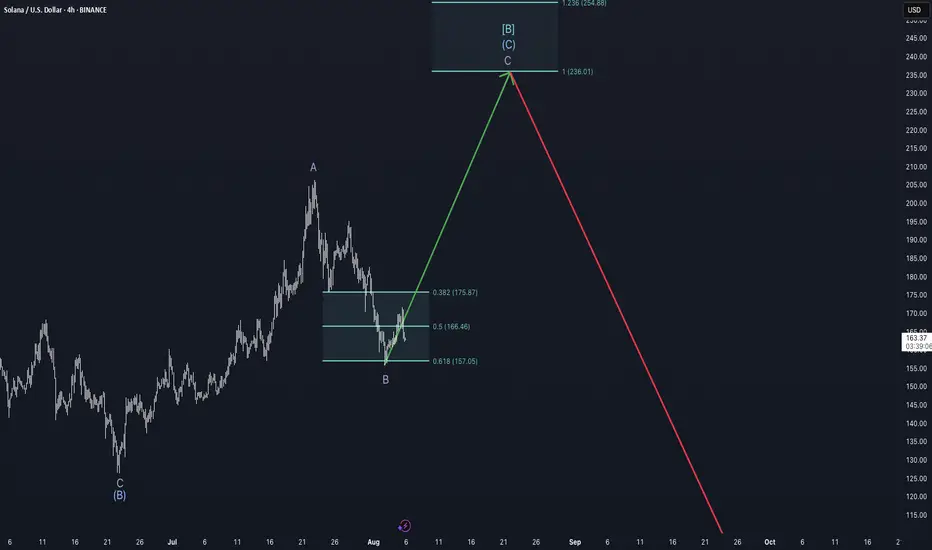
Bulls will be disappointed - Weekly Update August 5-11thSolana appears to be in the final leg of a complex corrective structure. According to the current Elliott Wave count, the larger cycle degree is unfolding in a downward wave c, while the primary degree is in an upward wave B, subdividing into intermediate wave C, which itself is in minor wave C—now developing.
The corrective decline from the July high has retraced toward the 0.618 Fibonacci retracement level (~$157) of the prior move, marking a typical zone for the end of Wave B within a flat or zig-zag formation. From this low, Solana has begun to push higher, indicating the likely beginning of Wave C to the upside. Based on Fibonacci extensions, the potential target zone for this move lies between $236 (1.0 extension) and $254 (1.236 extension).
From a market structure perspective, funding rates across major perpetual futures markets for SOL remain slightly negative or neutral, indicating that the majority of traders are not aggressively long at this stage. This often provides a more stable environment for an upward move, as it suggests the absence of overcrowded long positions that could lead to sharp liquidations. For reference, data from Velo (as of August 5) shows funding on Binance SOLUSDT Perpetual at 6.07%, confirming this neutral-to-slightly-bearish bias in funding.
Additionally, open interest has been neutral since the local low around $157. This is visible on futures data platforms such as Velo.xyz.
However, the liquidity heatmap does not currently support a strong magnet effect toward the $236–$254 zone. There is no significant cluster of stop liquidity or resting orders above $230 that would attract price purely through liquidation mechanics. In contrast, notable liquidity still resides below current levels, making the setup more technically driven than structurally supported by liquidity.
Given these conditions, the case for a C-wave rally remains technically intact, but traders should be cautious: the absence of upper-side liquidity and the corrective macro context imply that this move, even if successful, is likely a countertrend rally within a broader bearish cycle structure.
In conclusion, as long as price holds above the $157–$166 support zone and maintains impulsive structure on lower timeframes, the outlook remains short- to mid-term bullish toward the $236–$254 area. Yet, any breakdown below $157 would invalidate this wave count and suggest that Cycle Wave c may already be resuming to the downside.
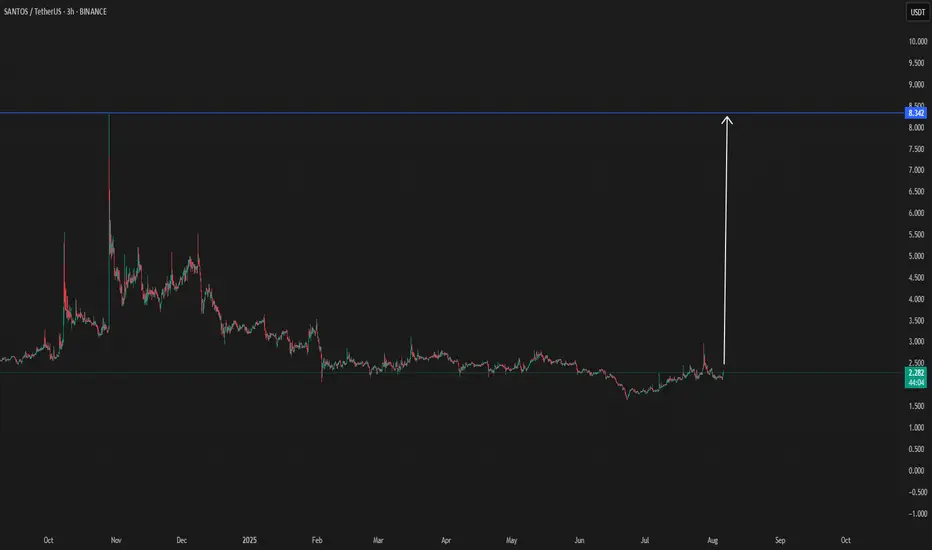
SANTOS/USDT $8 Possible targetSantos shows an interesting view since today, which can confirm a break
When there is confirmation will add here below
Like it did before, it can do it again.
DOGEUSDT heading towards 0.24 zone#DOGE #DOGEUSD #DOGEUSDT CRYPTOCAP:DOGE
This is where DOGEUSDT will bounce.
The price has tapped into the daily support DS1.
We see the reaction that there. However, the price may go deep into this support but not necessarily.
This condition presents a long opportunity on DOGEUSDT.
The price will bounce from DS1 and try another attempt at weekly resistance WR1.
The price may also struggle between 0.23 and 0.24 zone.
This may be an opportunity to load long term spot position since the price action is looking bullish for some upcoming months.
What do you think? Where do you see DOGEUSDT bounce and in upcoming month? Let me know in the comments.

BTC 8H – Fib Support Holds, Will Bulls Defend This Reclaim Zone?Bitcoin is back at a key decision point on the 8H chart — retesting the exact zone it broke out from just two weeks ago. This former resistance has flipped to support, but with momentum cooling off, bulls need to step in fast to avoid a deeper retrace.
🔹 Structure & Levels
Price is hovering inside a reclaimed range (blue box), retesting it from above.
Just below sits the Golden Pocket (0.5–0.618) retracement zone from the July rally — a classic bounce zone if the reclaim fails.
The 0.5 level at $110,879 aligns with previous consolidation structure, adding extra confluence.
Further below lies the 0.786 at $103,802, which marks invalidation for most swing long setups.
🔹 Momentum Check
The Stoch RSI has started curling down from overbought, suggesting momentum may stall short term.
If bulls can’t defend the current reclaim zone, we could see a flush into the Fib pocket before trend continuation.
🔹 Bias & Trade Idea
Holding this level = bullish continuation toward $118K–$120K range highs.
Lose it cleanly = watch for signs of reversal inside the golden pocket.
Risk is defined, structure is clear — and BTC has a habit of reacting cleanly to these zones.
Are you buying the dip now — or waiting for a cleaner tag of the Fib levels?
Drop your thoughts 👇

Updated chart: 1050 days of bull, 380 days of bearEach cycle fits quite neatly into ca. 1050 days of bull market and 375 days of bear. Sell in Sep/Oct 2025. Buy in Nov 2026.
An argument can be made that 2021 was a botched bull run. By the time we got to the second peak, Bitcoin was already running out of steam. One single peak would have topped around 100k. I blame SBF/Alameda.
People who are trying to extrapolate/do curve fitting through that 2021 peak will underestimate 2025.
2021 should be ignored as an exception.

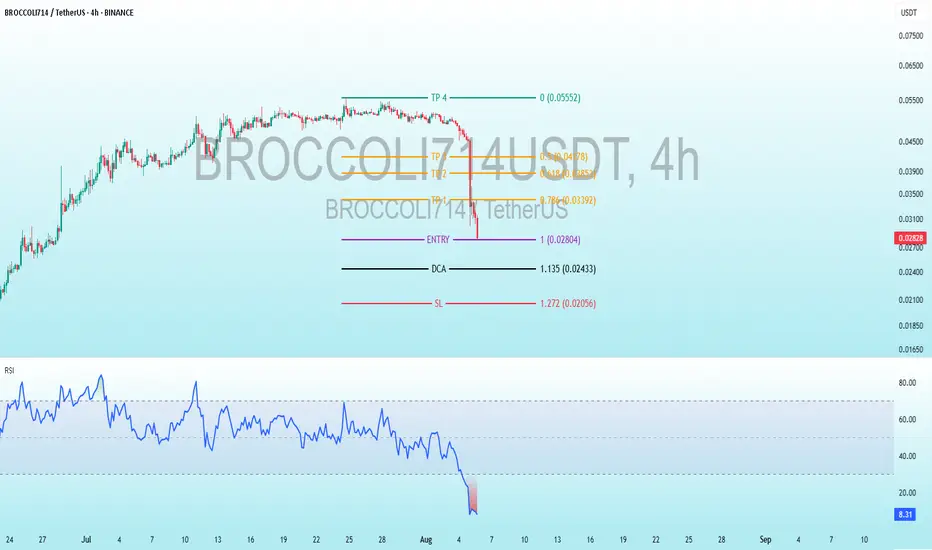
BROCCOLI714 Bullish DivergenceBINANCE:BROCCOLI714USDT
Trade Setup:
Target 1: 0.03392 (0.786 Fibonnaci Golden Zone).
Target 2: 0.03853 (0.618 Fibonnaci Golden Zone).
Target 3: 0.04178 (0.5 Fibonnaci Golden Zone).
Target 4: 0.05552 (0 Fibonnaci).
DCA : 0.02433 (1.135 Fibonacci)
Stop Loss: 0.0.02056 (1.272 Fibonnaci).
RSI Analysis: The RSI is showing a bullish divergence, suggesting potential bullish momentum. The current RSI is around 8.36, approaching oversold territory, so caution is advised.
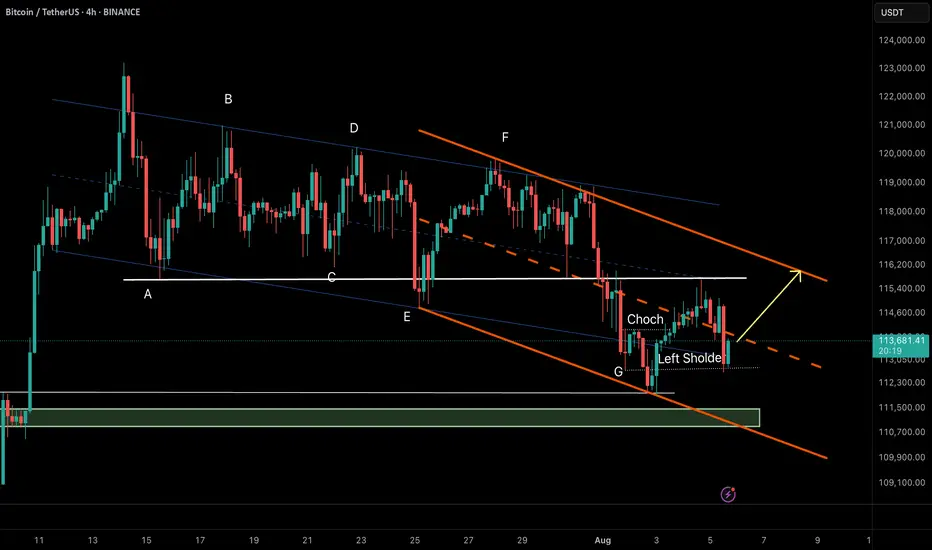
Bitcoin (BTC/USDT) – RTM Reversal Pattern in Action🔸 Market Structure:
Bitcoin has formed a descending channel after a prolonged correction. Recently, price tapped the channel bottom and printed a CHoCH (Change of Character), indicating a potential reversal.
The price has now retraced to the left shoulder of a potential inverse head & shoulders pattern—an RTM classic structure—which held as support, suggesting bullish continuation.
⸻
🔸 Key Technical Signals:
• ✅ CHoCH confirmed at demand zone near $112,300
• ✅ Retest of the left shoulder validates bullish structure
• ✅ Holding above the internal bullish trendline
• ✅ Price aiming toward upper channel resistance
⸻
🎯 Target:
$116,200 – Top of the descending channel & next key resistance.
❌ Invalidation:
Break and close below $112,800 would invalidate the current RTM setup and open room for deeper correction.
⸻
📌 Summary:
This is a textbook RTM reversal:
CHoCH → Retracement → Left Shoulder Test → Continuation
As long as the structure holds, we remain bullish toward the channel top.
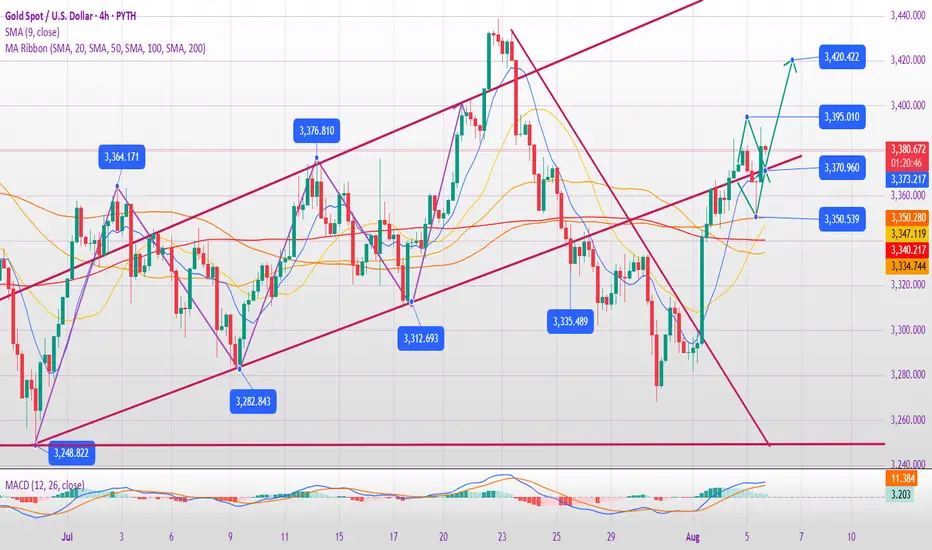
August 6th Latest Gold Trend Analysis Strategy:
I. Gold Fundamentals Analysis
Expectations of a Fed Rate Cut Strengthen:
Weak US economic data (such as employment and manufacturing) has heightened market expectations of a September Fed rate cut, putting pressure on the US dollar and benefiting gold.
Changes in Federal Reserve officials and policy uncertainty have exacerbated market volatility and increased demand for gold as a safe haven.
Escalating Global Trade Tensions:
The Trump administration's announcement of 25% tariffs on India and other countries has sparked concerns about trade friction and heightened risk aversion in the market.
Geopolitical risks (US-Russia confrontation, Middle East tensions) have further supported gold.
Weak US Dollar:
The US dollar index's rebound has been weak. If US economic data continues to be sluggish, it could fall further, which would be bullish for gold.
II. Gold Technical Analysis
Short-Term Trend (Intraday):
Support: 3360-3350 (critical watershed), 3345 (yesterday's low).
Resistance: 3385 (yesterday's high), 3390-3400 (strong resistance zone).
Technical Indicators:
RSI is approaching overbought territory, so be wary of a short-term pullback.
The 30-minute chart shows weakening upward momentum, suggesting a possible double top formation.
Key Pattern Observations:
Double Top Risk: If gold prices encounter resistance in the 3385-3390 area and fall below 3370, it could confirm a short-term top and trigger a correction.
Breakout signal: If it stands firmly above 3400, it may open up upside space to 3420-3450.
III. Today's Gold Trading Strategy
Short-Term Trading (Buy Low and Sell High):
Short Strategy:
Short on rebounds to the 3395-3400 range, stop loss at 3405, target at 3360-3350.
Long Strategy:
Go long on pullbacks to the 3350-3360 area, stop loss at 3337, target at 3380-3390.
Breakout Trading (Trend Following):
If it breaks through 3400: Go long with a light position, targeting 3420-3430.
If it falls below 3345: It may pull back to 3330-3300, and you can short-term sell.
IV. Risk Warning
Market Sentiment Changes: Trade frictions and geopolitical events could trigger significant volatility.
V. Summary
Short-term: Gold is expected to fluctuate upwards, but strong resistance between 3385 and 3400 is expected, so be wary of a pullback.
Trading Recommendation: Wait and see during the Asian session, then trade when the market opens in Europe and the US. Maintain a strict stop-loss (≤1% position risk).
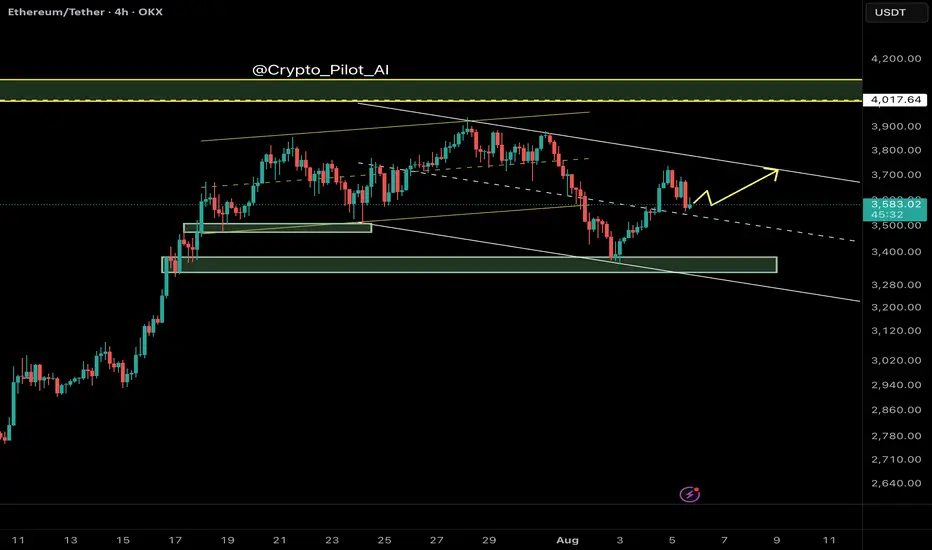
Ethereum (ETH/USDT) – Midline Break Retest and Channel Top in Si🔍 Technical Overview
Ethereum has recently broken above the midline of its descending channel, indicating a potential bullish shift within the short-term corrective structure. The price action suggests that we are currently witnessing a retest of the broken midline, which is now acting as dynamic support.
This behavior is consistent with smart money principles — where a previously broken internal structure gets tested before continuation.
⸻
🧠 NEoWave Context
Structurally, ETH appears to be developing a Contracting Corrective pattern, with the current leg likely evolving as Wave D. This wave typically exhibits strength and complexity, often stretching toward the channel top while still respecting broader consolidation boundaries.
⸻
💡 Smart Money Insights
• ✅ BOS already confirmed on LTF (1H, 4H) with higher lows
• 🔄 Price has reclaimed the internal broken structure (midline) and is retesting it
• 🔋 Bullish OB around $3,480–$3,510 acted as a launch zone for current leg
• 📍 Next resistance is the channel top near $3,740
⸻
📊 Trade Scenarios
🟩 Bullish Scenario (Preferred):
If the retest of the midline holds, ETH is likely to continue its move toward the upper boundary of the descending channel (~$3,730–$3,750). This aligns with Wave D expectations in complex corrections.
🟥 Bearish Invalidations:
A breakdown back below $3,520 and loss of the internal bullish structure would negate this short-term bullish scenario and reopen downside potential toward $3,350.
⸻
⚠️ Trader Tip:
Retests of internal structures like midlines or internal trendlines often provide low-risk continuation setups — if confirmed by bullish internal BOS.
⸻
✅ Conclusion
Ethereum remains technically corrective but with bullish momentum building within the channel. As long as the midline holds, we expect continuation toward the channel top, completing Wave D structure before potential reversal.
💬 Drop your alt counts or thoughts in the comments.
GAIA Crypto BullrunGAIA AI recently launched their mainnet and was added to 10 major centralized exchanges. Since then it has been dumping and has found a bottom. GAIA currently has a 7 million dollar marketcap and will likely be over 100 million at some point in the not too distant future. If it makes it into the top 200 coins, that will be a 30x gain from here. Get in under .75!!!

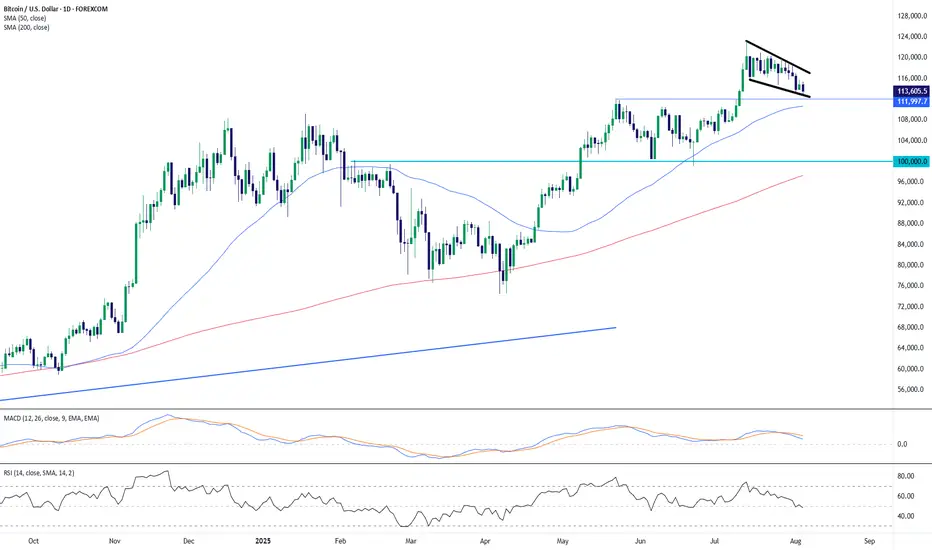
BTC/USD: Testing Key Support in a Bull Flag SetupBitcoin is currently pulling back from its July high near $122,000, but the structure on the daily chart shows a potential bull flag forming. Price action is now hovering around the $113,600–$112,000 support area, which aligns closely with the 50-day SMA ($110,627) and the lower boundary of the flag.
The broader trend remains bullish, as price continues to trade well above the 200-day SMA ($97,279), and the recent consolidation appears orderly rather than impulsive.
Momentum indicators:
MACD is in bearish territory and descending, reflecting short-term weakness.
RSI sits at 48.16, near neutral, offering room for movement in either direction.
A confirmed breakout above the flag’s upper trendline would signal potential continuation of the larger uptrend. However, a breakdown below $112,000 would invalidate the bullish flag scenario and possibly expose BTC to the psychological $100,000 level next.
Key Levels:
Resistance: $118,000–$120,000 (flag top).
Support: $113,600 and $112,000 (flag base and 50 SMA); $100,000 psychological level below.
Structure: Bull flag within a broader uptrend.
This remains a high-stakes zone for Bitcoin bulls. A decisive move out of this consolidation pattern will likely dictate the next major leg.
-MW
ADA accumulation/distributionI'm watching out for something like this on ADA. A mid time frame accumulation that completes a high time frame distribution. Clean POI's on both sides, let's see what will happen here.
