BTC/USD - KEY SUPPORT BREAKOUT IN FOCUS!Bitcoin is currently trading near a critical support level, and price action is setting up for a decisive move.
📉 Bearish Scenario (Primary Bias):
Key support at ~$117,800 has broken, signaling a shift in market sentiment.
If the breakdown holds, we could see a strong bearish continuation toward the demand zone around $111,000.
Price may retest the broken support before the next leg down.
📈 Bullish Scenario (Alternate):
If buyers regain control and reclaim the broken support, BTC could retest the strong high at $120,700, and possibly push toward the supply zone near $123,000.
🔎 Structure Highlights:
Supply Zone: $122,000 – $123,000
Demand Zone: $110,000 – $111,500
Key Resistance/Support: $117,800
Strong High: ~$120,700
📌 Watch Closely:
Price behavior on the retest of the broken support
Bearish confirmation for downside continuation
Bullish reclaim for short-term recovery
A decisive move is near – be ready for both scenarios with tight risk management!
Crypto market

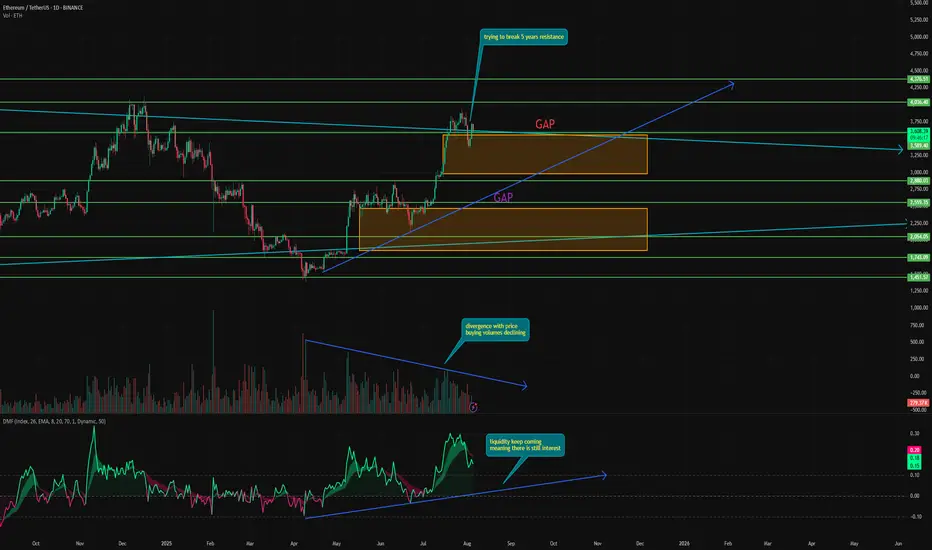
Time to take some profits in ETH⚡️ Hello everyone! Over the past week, the market has been actively correcting, which, ironically for ETH, coincided with reaching the $3,650 level, where its 5-year resistance line is located.
This is obviously a powerful level, which the price already broke through in December last year, but after spending less than a week above it, it went into correction.
If the price can really consolidate above this level, it will open the way for tremendous growth. Even $5,000 will seem like a joke.
⚙️ But is there a real chance of this happening? Let's take a look:
During its growth, ETH moved extremely sharply and powerfully, forming two gaps from below at $3,560–2,987 and $2,483–1,848. As we know, in 99% of cases, gaps close sooner or later. So there is a high probability of a downward movement. In addition, one of the gaps has already partially closed.
Volume - purchase volumes continue to diverge from the price, indicating waning interest in ETH. This often leads to a trend reversal.
Money Flow - Interestingly, liquidity continues to flow into the asset, unlike Bitcoin. And now it is at a fairly high level. In addition, there is harmony with the price.
📌 Conclusion:
Right now, ETH looks strong enough to finally break through resistance and open the way to new heights. However, this will also depend on the overall state of the market.
No matter how strong ETH is, if Bitcoin goes into correction, ETH will go with it.
But if we remove all emotions and thoughts and look at it technically, ETH has reached five-year resistance. And good traders buy on support and sell on resistance.
Have a nice day, everyone!

Litecoin (LTC): Aiming For $145 Area Before Potential CorrectionLitecoin looks good for potential upside movement here, although trades are not the best to take but we definitely see a good shorting opportunity appening soon.
More in-depth info is in the video—enjoy!
Swallow Academy


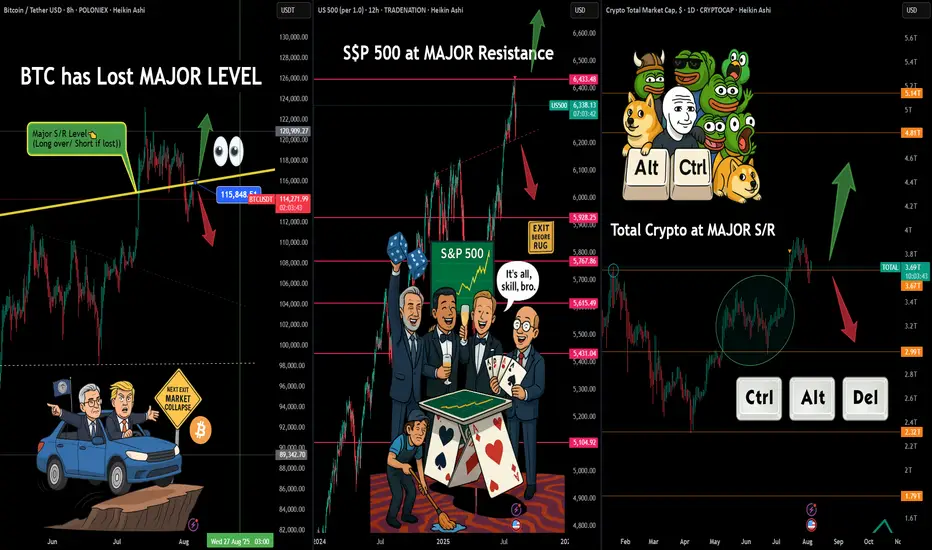
Alt-Season or Alt-Control-Delete.?🤖💣 Alt-Season or Alt-Control-Delete.? 🧠📉
The market looks like it's a bout to rug someone... and it might just be Trump.
While President Trump narrows down his Fed Chair shortlist, the real driver — Powell — is still at the wheel. But the car? It's swerving dangerously near the edge. BTC has lost a key S/R level, the S&P 500 is at major resistance, and Total Crypto Market Cap is stalling at a crucial decision point.
Despite the hype around altcoins and "recovery rallies," I’m deeply cautious. JP Morgan and Bank of America stocks might dip after Trump’s public accusations — signaling that institutions might already be repositioning. Capital tends to exit before the narrative shifts... and that shift could be incoming.
The chart says it best:
👀 BTC beneath S/R
🎲 S&P 500 gamblers partying at resistance
🧠 Meme coin mania while total crypto hits S/R
🧨 Trump’s signaling right, but Powell might yank the wheel left...
This could all be the calm before a liquidity flush.
Stay sharp, don’t follow the crowd — follow the capital.
That said , Bitcoin remains my favorite asset — especially in times of systemic risk. Remember what history shows us: when banks stumble or go bust, Bitcoin tends to rise. If there's one asset in the world I want to carry through a storm, it's Bitcoin. The decentralized antidote to centralized chaos.
One Love,
The FX PROFESSOR 💙
ps. we might see a breakout and Fomo for good reasons...why not? but for now my charts are screaming: CAREFUL!
Disclosure: I am happy to be part of the Trade Nation's Influencer program and receive a monthly fee for using their TradingView charts in my analysis. Awesome broker, where the trader really comes first! 🌟🤝📈
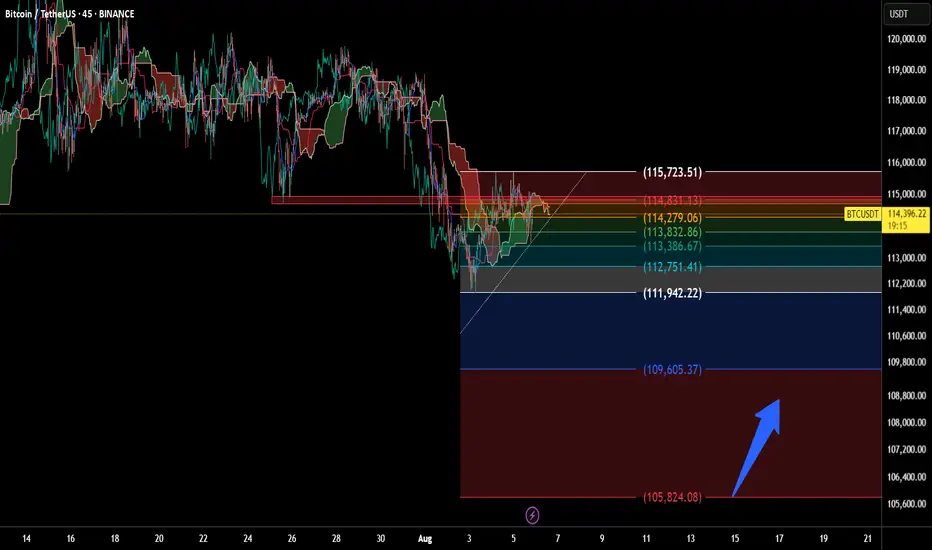
Will BTC Hold the Line? Support Levels TestedBitcoin is currently trading at 114,420 USDT on the 45-minute timeframe. This setup highlights a structured technical analysis using Ichimoku Cloud, Fibonacci retracement, and clearly defined support/resistance levels.
Key price zones:
- Resistance: 115,723.51 / 114,831.13
- Mid-range: 114,279.06 / 113,832.86
- Support: 113,386.67 down to 109,605.37
A downward arrow suggests a potential revisit to lower support zones, possibly around 105,824.08 USDT, indicating a watchlist area for accumulation or bounce confirmation.
💬 “Monitoring BTC’s reaction around key Fibonacci levels. Potential support zone in sight.”
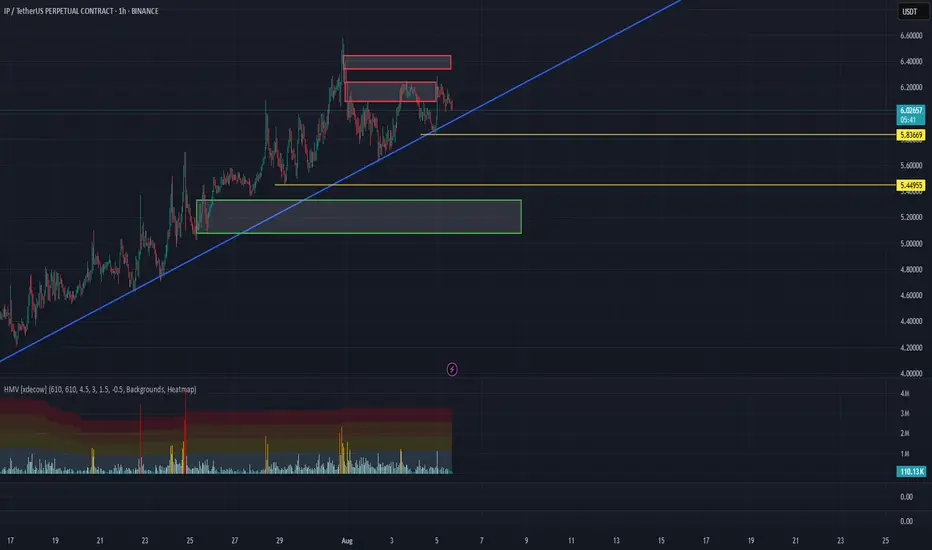
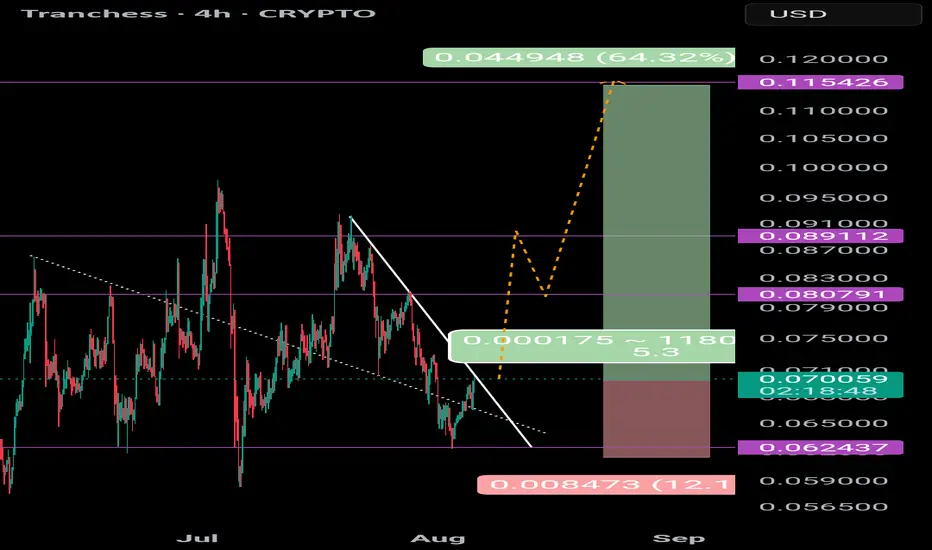
IP/USDT Analysis – High Probability of a Trendline Breakout
Currently, volatility is decreasing. At the same time, a clear imbalance is observed in cumulative delta — delta is dropping while price continues to rise. This could indicate hidden weakness from the buyer’s side. A sharp breakout of the descending trendline is likely in the near future, potentially resulting in a 12–15% move from current levels.
We are now in one of two sell zones — $6.09–$6.23. As long as the price fails to break above, we consider a short position toward support at $5.35–$5.10, either from the current sell zone or from $6.32–$6.44, if a reaction occurs there.
This publication is not financial advice.
BTC/USDT Analysis – Reached Resistance
Hello everyone! This is the daily analysis from the CryptoRobotics trading analyst.
Yesterday, Bitcoin reached the resistance zone at $115,000–$116,300 (a mirror volume zone), and we are already seeing a reaction from sellers.
Our primary expectations remain unchanged since yesterday — we anticipate a move back down toward the local low. If there’s no reaction at that level, we could see a further decline toward the next support zone at $110,000–$107,000 (accumulated volume). A shift to a bullish scenario is only possible if strong market buying appears, which would be reflected in a sharp spike in volume and upward positioning.
Buy Zones:
$110,000–$107,000 (accumulated volume)
Sell Zones:
$115,000–$116,300 (mirror volume zone)
$117,600–$118,600 (accumulated volume)
This publication is not financial advice.

ARusdtThis currency is in a good position, has good liquidity, and can move towards the desired targets. The short-term targets are $10 and $16, and the long-term target is $20.

ETHUSD bullish consolidation supported at 3,485The ETHUSD remains in a bullish trend, with recent price action showing signs of a corrective pullback within the broader uptrend.
Support Zone: 3,485 – a key level from previous consolidation. Price is currently testing or approaching this level.
A bullish rebound from 3,485 would confirm ongoing upside momentum, with potential targets at:
3,800 – initial resistance
3,855 – psychological and structural level
3,930 – extended resistance on the longer-term chart
Bearish Scenario:
A confirmed break and daily close below 3,485 would weaken the bullish outlook and suggest deeper downside risk toward:
3,372 – minor support
3,240 – stronger support and potential demand zone
Outlook:
Bullish bias remains intact while the ETHUSD holds above 3,485. A sustained break below this level could shift momentum to the downside in the short term.
This communication is for informational purposes only and should not be viewed as any form of recommendation as to a particular course of action or as investment advice. It is not intended as an offer or solicitation for the purchase or sale of any financial instrument or as an official confirmation of any transaction. Opinions, estimates and assumptions expressed herein are made as of the date of this communication and are subject to change without notice. This communication has been prepared based upon information, including market prices, data and other information, believed to be reliable; however, Trade Nation does not warrant its completeness or accuracy. All market prices and market data contained in or attached to this communication are indicative and subject to change without notice.

ETH/USDT | ETH Under Pressure – Watch $3500 Support!By analyzing the Ethereum chart on the weekly timeframe, we can see that after reaching the $3940 zone, ETH faced selling pressure and is now trading around $3540. If the price fails to hold the key $3500 support, a deeper decline is likely, with potential targets at $3040 first and possibly $2680 as the second bearish target.
Please support me with your likes and comments to motivate me to share more analysis with you and share your opinion about the possible trend of this chart with me !
Best Regards , Arman Shaban

BTCUSD important support at 112,760The BTCUSD remains in a bullish trend, with recent price action showing signs of a corrective pullback within the broader uptrend.
Support Zone: 112,760 – a key level from previous consolidation. Price is currently testing or approaching this level.
A bullish rebound from 112,760 would confirm ongoing upside momentum, with potential targets at:
117,680 – initial resistance
119,760 – psychological and structural level
122,100 – extended resistance on the longer-term chart
Bearish Scenario:
A confirmed break and daily close below 112,760 would weaken the bullish outlook and suggest deeper downside risk toward:
111,070 – minor support
108,800 – stronger support and potential demand zone
Outlook:
Bullish bias remains intact while the BTCUSD holds above 112,760. A sustained break below this level could shift momentum to the downside in the short term.
This communication is for informational purposes only and should not be viewed as any form of recommendation as to a particular course of action or as investment advice. It is not intended as an offer or solicitation for the purchase or sale of any financial instrument or as an official confirmation of any transaction. Opinions, estimates and assumptions expressed herein are made as of the date of this communication and are subject to change without notice. This communication has been prepared based upon information, including market prices, data and other information, believed to be reliable; however, Trade Nation does not warrant its completeness or accuracy. All market prices and market data contained in or attached to this communication are indicative and subject to change without notice.

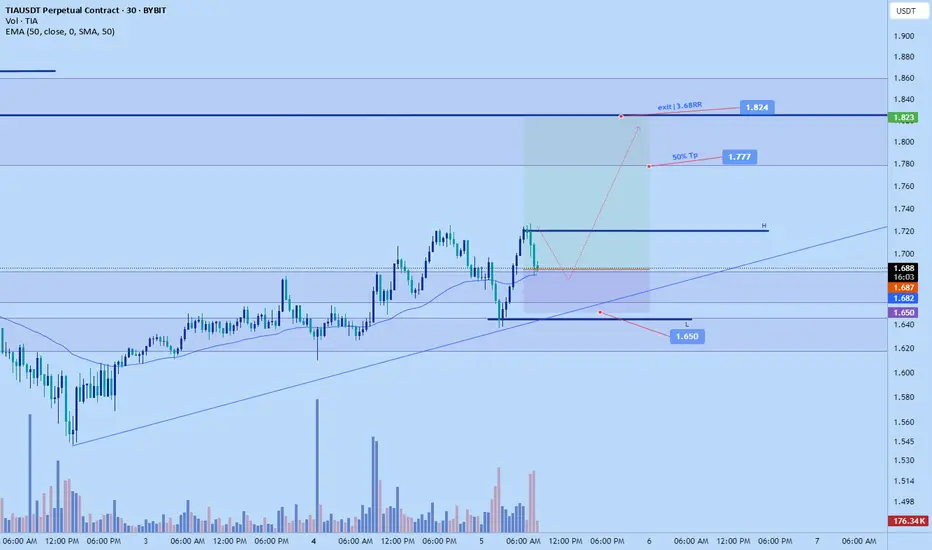
day 2 trend tradeyesterday was day 1 so today is day 2. stop hunt in newyork and giving a confirmation at 9:30

Dia is going crazy!! in case of breakout you can predict at least 45% profit and waiting for 200% profit in Bullrun.
In your own responsibility.

Monero’s 3% Dip: Fibonacci Says AccumulateXMR/USDT – Potential Accumulation Zone in Play
Monero (XMR) has dropped 3.14% on the 45-minute chart, currently trading around 295.48 USDT. Using Fibonacci retracement and Ichimoku Cloud analysis, a potential accumulation zone is identified between 288.16 and 256.86 USDT.
Key resistance levels at 319.47, 331.43, and 338.82 suggest a structured pullback. This dip could present a strategic entry point for traders anticipating a reversal or preparing for long-term positioning.
💬 “This area shows potential for coin accumulation.”

TON/USDT |Toncoin Pullback – Watching for Bounce Toward $4.20+By analyzing the Toncoin chart on the 3-day timeframe, we can see that after reaching $3.73, the price has entered a correction phase and is currently trading around $3.30. We should soon watch for a potential bullish reaction from the $3.03–$3.30 zone. If the next upward move begins, the bullish targets will be $3.74, $4.20, and $4.68.
Please support me with your likes and comments to motivate me to share more analysis with you and share your opinion about the possible trend of this chart with me !
Best Regards , Arman Shaban

New Bullish Rally About To Start Toward The 130k🔥 Well, the previous update played out perfectly — the price dropped to the $12K support area and bounced back strongly. Now, let’s talk about my next plan for Bitcoin
📥 At the moment, there’s a clear bullish flag forming on the chart. Price has bounced from the 1.618% PRZ (Potential Reversal Zone), which I’ve labeled as wave C of the larger corrective ABC structure.
📈 From here, I’m expecting a new bullish rally, with the next major target around $130K.

Bitcoin Price Prediction 2025–2030 | EMA & MACD AnalysisBitcoin trades near $114K in August 2025, sitting below EMA 9 and EMA 15 while holding above the EMA 200. The MACD shows weakening momentum, but support at $114K remains firm. This analysis highlights key support and resistance levels ($114K, $120K, $125K) and outlines scenarios for September, with long‑term forecasts pointing toward $300K–$350K by 2030.

BTC/USDT🩸 CRYPTOCAP:BTC ⁀➷
$Bitcoin. Macro chart Another
💯 Intermediate Target — 60 500 $
🚩 Macro Target 1 — 55 000 $
🚩 Macro Target 2 — 47 000 $
🚩 Macro Target 3 — 37 000 $
- Not financial advice, trade with caution.
#Crypto #Bitcoin #BTC #Investment
✅ Stay updated on market news and developments that may influence the price of Bitcoin. Positive or negative news can significantly impact the cryptocurrency's value.
✅ Exercise patience and discipline when executing your trading plan. Avoid making impulsive decisions driven by emotions, and adhere to your strategy even during periods of market volatility.
✅ Remember that trading always involves risk, and there are no guarantees of profit. Conduct thorough research, analyze market conditions, and be prepared for various scenarios. Trade only with funds you can afford to lose and avoid excessive risk-taking.

Trend Intact, Short-Term Caution, Monitor the 114k Area Closely__________________________________________________________________________________
Technical Overview – Summary Points
➤
Dominant bullish momentum on higher timeframes (6H, 12H, 1D) with ongoing consolidation; clear short-term bearish divergence on intraday (2H, 1H, 30min, 15min).
Key supports: 114,723 (D Pivot Low), 111,980 (W Pivot High) – essential zones for action/monitoring.
Critical resistances: 115,720–119,000, ultimate top at 122,318.
Normal volumes, no aggressive accumulation/distribution observed.
Risk On / Risk Off Indicator: “Strong Buy” in trend, neutral short term.
ISPD DIV/investor satisfaction neutral: No excess or behavioral anomalies.
Structural resilience but no strong short-term catalyst; awaiting a trigger from volume spike or macro reaction.
__________________________________________________________________________________
Strategic Summary
➤
Global bias: mid/long-term bullish, short-term caution.
Opportunities: tactical buys on 114,723–111,980, underweight before US ISM/PMI (expected volatility window).
Risk areas: a clear break below 111,980 = increased correction risk down to 107,500–110,000.
Catalysts: US ISM/PMI, ETF flows, extreme volume, Risk On / Risk Off Indicator reaction.
Action plan: Buy on strong support reaction (confirmation price action, tight stop <111,000) If no volume flow, prefer strategic waiting until macro announcements/exceptional volume Monitor volume anomalies, ETF flows, ISPD DIV extreme zone returns
__________________________________________________________________________________
Multi-Timeframe Analysis
➤
1D to 6H: Robust bullish trend, all major technical supports intact, Risk On / Risk Off Indicator “Strong Buy”. Volumes contained, no behavioral red flags.
2H, 1H, 30min, 15min: Clear bearish divergence via MTFTI (“Down”), no directional buyer flow, Risk On / Risk Off Indicator neutral.
Summary: Main scenario = consolidation/intermediate correction under resistance; actionable setups on clear support/equilibrium reactions (confirmation price action).
Fundamental side: macro stress tests absorbed, structurally healthy market, no major capitulation.
Key catalyst to watch: Post-US PMI/ISM reaction and ETF flows. Any major inflection below 114k–111k = immediate defensive management.
__________________________________________________________________________________
