Crypto market

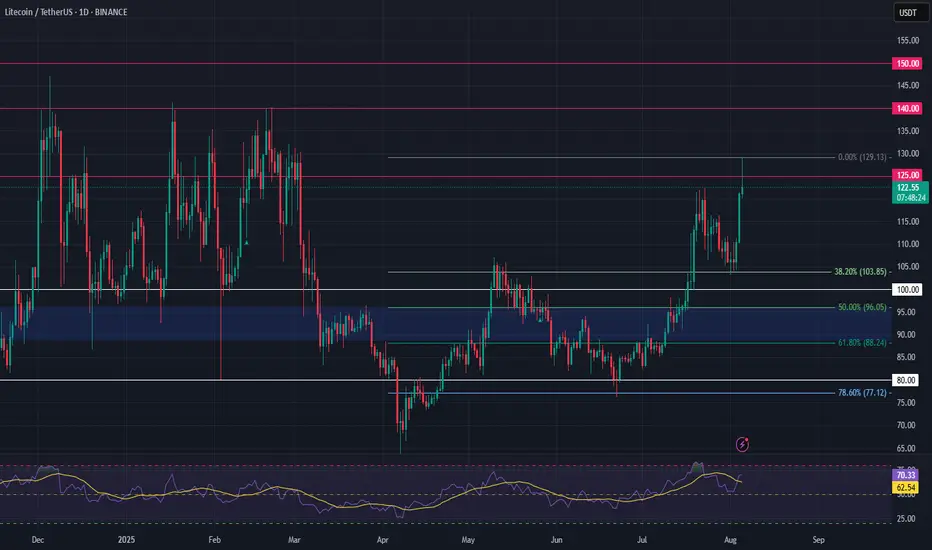
Litecoin (LTC) – Re-Entry After 44% RallyLTC rallied over 44% since our last trade setup. Now, we’re looking for a re-entry opportunity as the broader crypto market shows signs of a potential pullback.
🔍 Setup Overview:
Entry Zone: $108 – $103
Take Profits: $125 / $140 / $150
Stop Loss: Daily close below $100
Bias: Bullish continuation (as long as structure holds)
🧠 Trade Idea:
Expecting a possible sweep of the $104 low before upside resumes. Key condition: Daily candle must not close below $100—wicks are fine. If price respects this level, the bullish structure remains intact.
This is a classic liquidity grab scenario. Entering in the $108–103 zone allows favorable risk-to-reward if LTC catches support and reclaims momentum.
⚠️ Invalidation:
If LTC posts a daily close below $100, trade setup becomes invalid. Monitor price action closely around this key support zone.
BTC Double BottomDo not be surprised if BTC gives us another double bottom before reversing its direction back into price discovery. Looks like it could achieve the second bottom around 111-112. If anyone has spent any significant amount of time in the charts knows BTC LOVES a double bottom before going higher. Also, this cycle has seen a repeated pattern of accumulation, sweeping low, reclaiming range and then expansion.

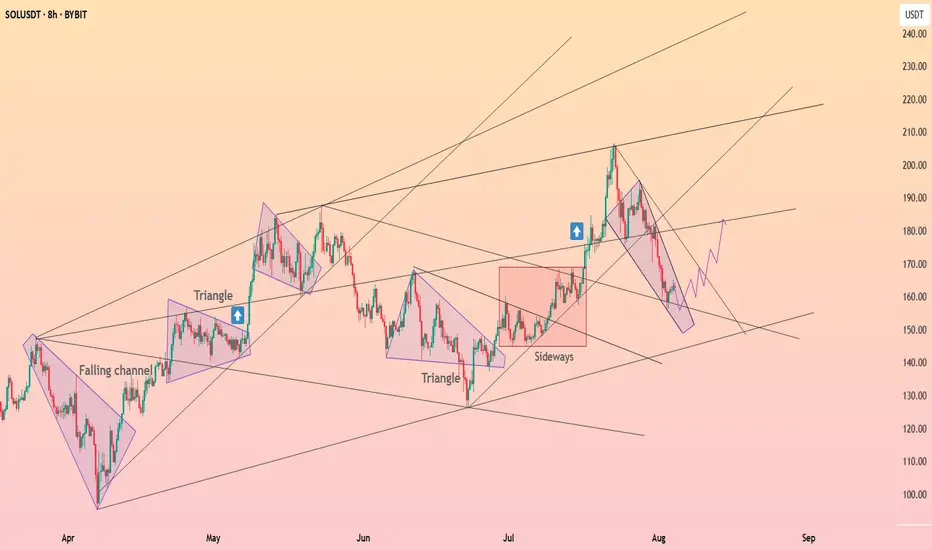
Solana is forming the falling wedge ┆ HolderStatBYBIT:SOLUSDT is moving within a falling channel after the recent drop from $200. Previous triangle breakouts led to rallies, and the current setup resembles earlier accumulation zones. A break above the channel could lead to $180 upside.
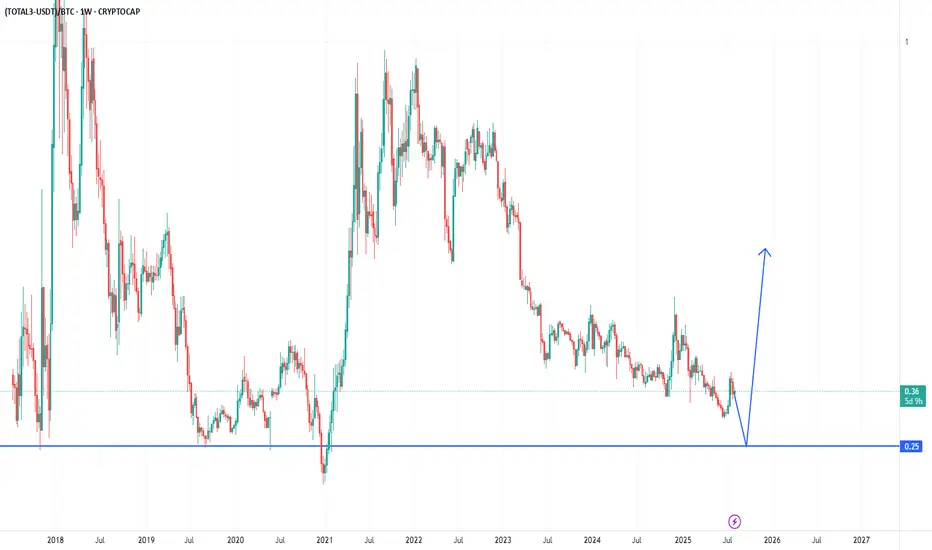
ETH vs BTC, Trend shift?📝 After months of underperformance, we're finally seeing some relative strength from ETH vs BTC.
📍ETH/BTC has bounced off a key historical support zone — a level that previously marked major reversals in the cycle.
📈 While the bounce is still in early stages, it breaks the streak of lower lows and gives hope for a trend shift. If we apply the logic of diminishing returns, even a conservative positive scenario suggests a potential move of +150–200% from the bottom, aligning with previous cycle rebounds.
💡 It’s still too early to call a full rotation, but this is the first sign of real momentum from Ethereum in a long time. Worth keeping an eye on.

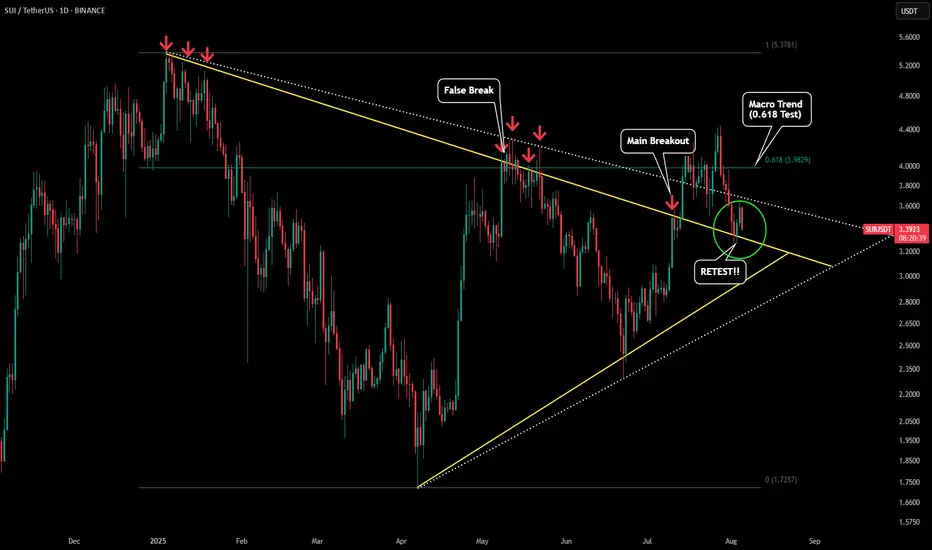
SUI - Retest in ProgressPlease refer to our previous post:
What we stated in this post from over three weeks ago was "If we get a retest and hold of that yellow trendline that will be the confirmation we need for a full blown breakout for SUI."
Current day we just got that retest! As you can see (green circle) both daily candles held the body above the yellow line giving us our first confirmation of a successful retest. If this retest remains successful we should see a continued move to around $5.50.
However due to BTC's current state we cant rule out the bearish scenario. If BTC starts to close below $112k then most likely SUI will fall below our triangle pattern. If SUI falls below and starts closing below the yellow line that would signal a false break. At the moment this is the less likely scenario given the market structure built, but something to watch closely.
btc usd short term down 50 to 70 pips btc usd short term down 50 to 70 pips
fell free contrect me if you have any question

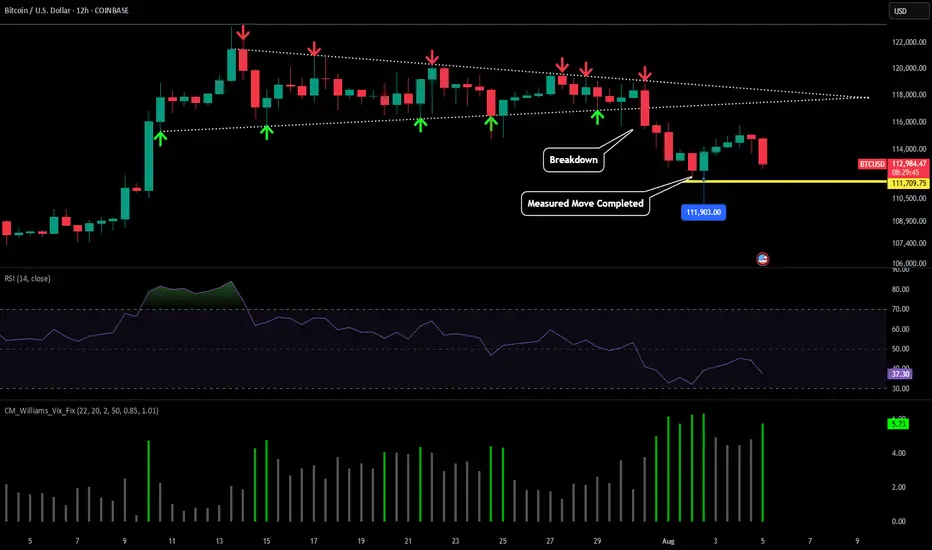
BTC -12H Move CompletedPlease refer to our previous post:
From this post we were watching for scenario 1 or scenario 2 to play out. Scenario 1 ended up playing out and price continued to drop right to our yellow line. We noted the measured move low would be slightly below $112k and our low was established at $111,903 which was an almost perfect prediction!
This comes as no surprise if you refer to our post we made over 3 weeks ago.
In this post we labeled support #2 as $112k. This is looking to turn our last highs into new support.
However if we do end up losing this level $107-$108k is really the last line in the sand to keep this bull market intact before we must start considering the bull market top is in. No confirmations on this yet, but if you have been viewing our macro charts there are a few signs developing pointing towards this as a possible scenario if confirmations happen.
#BTC hits neckline resistance and pulls back📊#BTC hits neckline resistance and pulls back✔️
🧠From a structural perspective, we've retreated after hitting resistance at the neckline, as expected. If the current structure continues to decline rapidly, we could potentially retest support near 112,000, or perhaps break below the previous low to sweep liquidity before rebounding.
➡️The resistance zone remains clear. Only if the neckline resistance zone is broken and stabilizes for a day or so can we maintain a positive bullish stance.
Let's see 👀
🤜If you like my analysis, please like 💖 and share 💬 BITGET:BTCUSDT.P

next important Supportif the support break in 160 price its become resistance and i think next and strong support is 151

Alts capitulate then Alt se3asonAlts need to go home before they pump against btc and we get alt season, as it happened with eth

$FLOKI BUY LIMIT SETUPAfter the previous rally (as predicted in my earlier chart), a correction is now unfolding—likely to sweep the uncleared liquidity below before the next impulsive move.
🔹 POI Entry Zone:
Buy Limit: $0.00006808
Stop Loss: $0.00005789
Target : $0.00028603 (Sell Order Block Zone)
Weekly structure remains bullish. Watching closely for price reaction from the POI demand zone before continuation to the sell-side order block.
And the 1W Chart is just for clarity sake.
#FLOKI #Memcoin

$AI - LONG SETUPBINANCE:AIUSDT.P
NYSE:AI
⚠️ HIGH RISK TRADE
Recommended Leverage: 25x
🟢 LONG
Expecting the price to bounce from the white lines support.
📈 ENTRY: If 4H CC above (0.11880), DCA (0.11752)
🎯 TAKE PROFIT: Yellow Lines
🛑 STOP LOSS: 0.11616 (📊 4H Candle Close Below)
⚠️ High Risk – Manage Your Position Wisely!
📌 NFA – DYOR 🧠

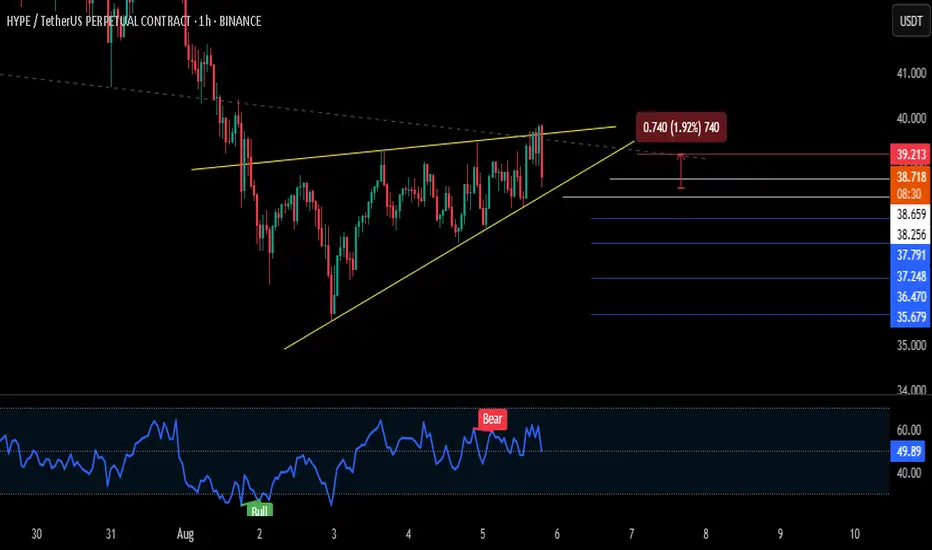
$HYPE - Short SignalBINANCE:HYPEUSDT.P
⚠️ HIGH RISK TRADE
🛑 SHORT
The price is within a rising wedge pattern and exhibits bearish divergence.
📈 Entry if breaks below (38.256), DCA (38.659).
🎯 TAKE PROFIT: Blue Lines
🛑 STOP LOSS: 39.213 (📊 4H Candle Close Above)
⚠️ High Risk – Manage Your Position Wisely!
📌 NFA – DYOR 🧠
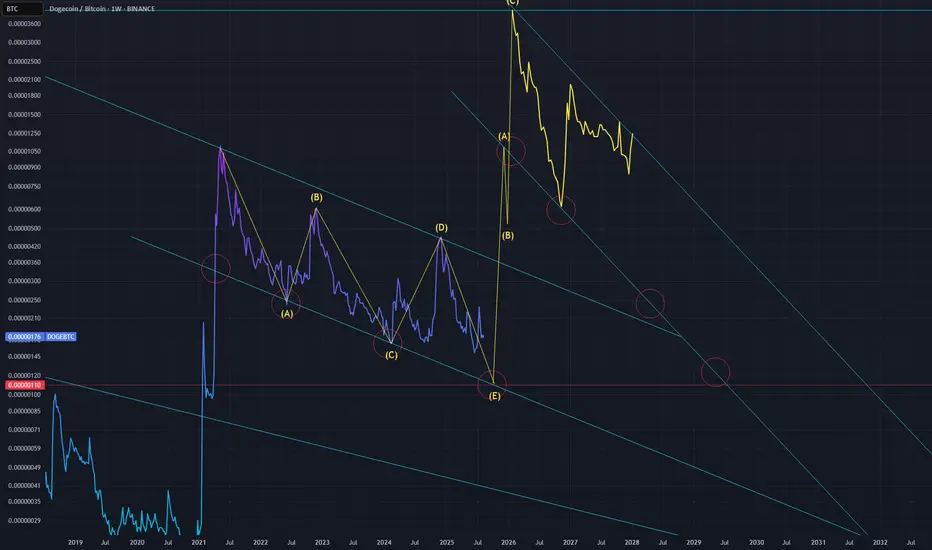
Elon to send DOGE."Elon Musk awarded $30 billion in bid to keep him at Tesla for years." - August 5, 2025.
Make no mistake about it, Elon wants DOGE to hit every headline.
Expect to see DOGEUSD at >$5 or higher. At these valuations, DOGE would be >10% of the total marketcap. 1 trillion marketcap for DOGE is possible in this cycle - yes you heard that right.
DOGEUSD at $6.9. Why not? Just full send.
HBAR - it's time to run away from it Today we dug up a real crypto zombie! HBAR — is it worth touching or better to avoid? Let me explain:
The token was dead for many years after 2021. But suddenly it grew by hundreds of percent after the ETF application was filed.
I will not discuss how useful this project is or not, let's just look at the chart:
➡️ During the last growth impulse, a GAP was formed from below, which has already begun to partially close. At levels of $0.243 - 0.171. In 99% of cases, gaps close sooner or later, continuing to attract price until that moment.
➡️ Volume - divergence in purchase volumes. The price is falling, and sales volumes are also falling. Fewer and fewer people want to sell. But it's too early to rejoice; look at the purchase volumes, they are simply non-existent.
➡️ Money Flow - surprisingly, the picture here is not so bad. Harmony with the price. Liquidity is slowly coming in, but the indicator is already in the neutral zone, even though we are in the midst of a bull market.
➡️ Support/Resistance - the price was unable to overcome even such a weak resistance level as $0.289. This only confirms the complete lack of desire to buy among people.
Yes, of course, no one is selling either, because what is the point of selling in the midst of growth?
➡️ The price is now approaching the support level of $0.235, a level with fairly low interest, and if it cannot hold the price, the next support level will be at the very bottom of the GAP at $0.175.
📌 Conclusion:
It is extremely convenient to trade now, as HBAR is simply flying in both directions like a weather vane. And now, when the correction begins, it will fall sharply.
But don't even think about buying it on the spot. Spare your deposit 😁

BTC - trend lines and liquidity zonesHere is a summary of what I'm looking at:
Price currently struggling to surpass the Weekly low @ 115,650 (Blue line)
The green line is acting as resistance, with a brief break-through mid-July.
Huge liquidity zone 120-121.5K which will be inevitably grabbed (Yellow box)
Liquidity sitting below @ 111K (Yellow box)
0.5 fib currently at @ 110K (which also acted as the Weekly high in Jan 25)
A descending channel formation
Analysis:
I believe that Bitcoin with visit the 110K - 111.5K zone which also coincide with the bottom of the channel, the Weekly high @ 110K and 0.5 fib (ish) and grab what liquidity is currently sat below.
Once done, move up to the higher liquidity zone, which would break once again above the Green line which would hopefully flip into support, and send BTC parabolic with a peak Nov-Dec.

Robert Kiyosaki said WHAT about BTC?According to Cointelegraph Robert Kiyosaki welcomes a BTC dip below $90K... We talked about it before even BTC broke ATH (check related publications), what do you think?
#crypto #cryptomarket #bitcoin #btc #trading #analysis

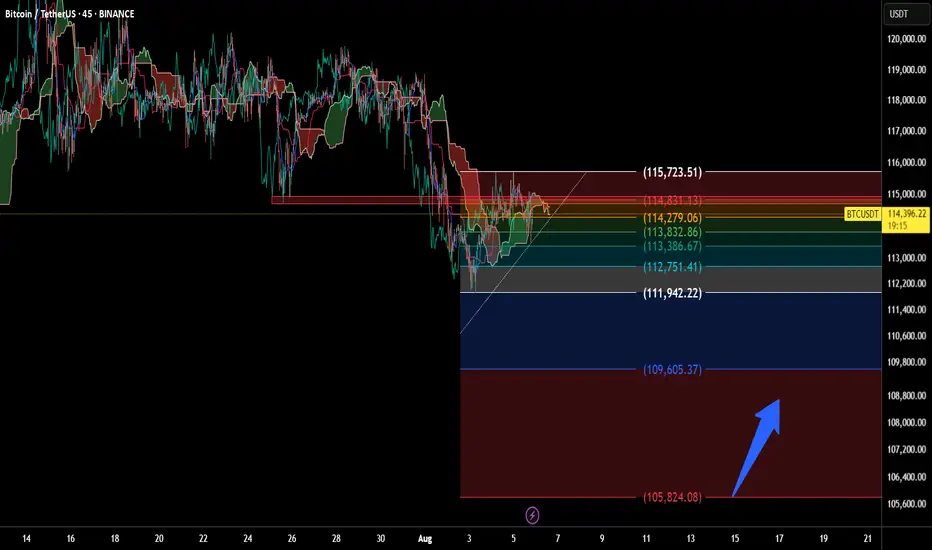
Will BTC Hold the Line? Support Levels TestedBitcoin is currently trading at 114,420 USDT on the 45-minute timeframe. This setup highlights a structured technical analysis using Ichimoku Cloud, Fibonacci retracement, and clearly defined support/resistance levels.
Key price zones:
- Resistance: 115,723.51 / 114,831.13
- Mid-range: 114,279.06 / 113,832.86
- Support: 113,386.67 down to 109,605.37
A downward arrow suggests a potential revisit to lower support zones, possibly around 105,824.08 USDT, indicating a watchlist area for accumulation or bounce confirmation.
💬 “Monitoring BTC’s reaction around key Fibonacci levels. Potential support zone in sight.”
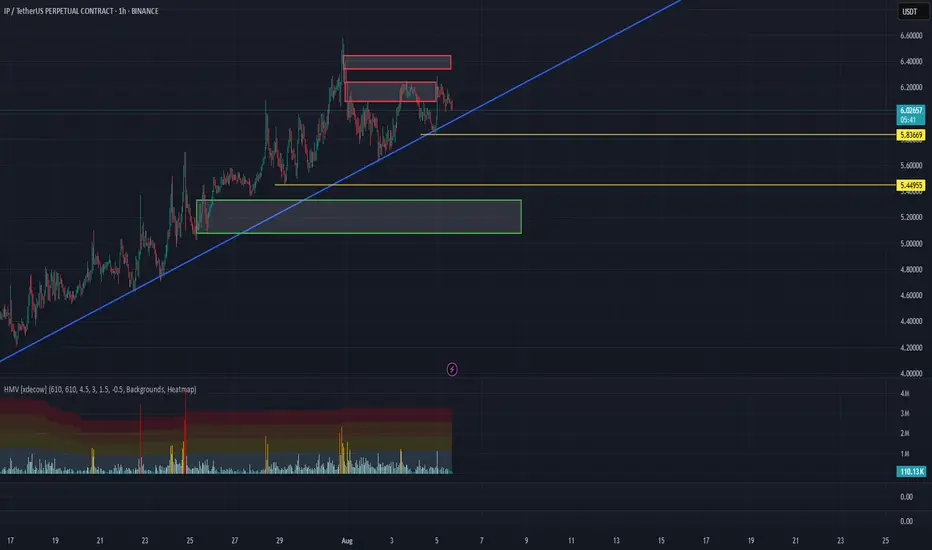
IP/USDT Analysis – High Probability of a Trendline Breakout
Currently, volatility is decreasing. At the same time, a clear imbalance is observed in cumulative delta — delta is dropping while price continues to rise. This could indicate hidden weakness from the buyer’s side. A sharp breakout of the descending trendline is likely in the near future, potentially resulting in a 12–15% move from current levels.
We are now in one of two sell zones — $6.09–$6.23. As long as the price fails to break above, we consider a short position toward support at $5.35–$5.10, either from the current sell zone or from $6.32–$6.44, if a reaction occurs there.
This publication is not financial advice.
A big drop is ahead in the coming weeksBitcoin appears overbought, and in the current global economic climate, cash is king — a dynamic that may prompt investors to lock in profits. I anticipate a pullback to the 0.5 Fibonacci level, which sits around $69,000.

BTC/USDT Analysis – Reached Resistance
Hello everyone! This is the daily analysis from the CryptoRobotics trading analyst.
Yesterday, Bitcoin reached the resistance zone at $115,000–$116,300 (a mirror volume zone), and we are already seeing a reaction from sellers.
Our primary expectations remain unchanged since yesterday — we anticipate a move back down toward the local low. If there’s no reaction at that level, we could see a further decline toward the next support zone at $110,000–$107,000 (accumulated volume). A shift to a bullish scenario is only possible if strong market buying appears, which would be reflected in a sharp spike in volume and upward positioning.
Buy Zones:
$110,000–$107,000 (accumulated volume)
Sell Zones:
$115,000–$116,300 (mirror volume zone)
$117,600–$118,600 (accumulated volume)
This publication is not financial advice.
