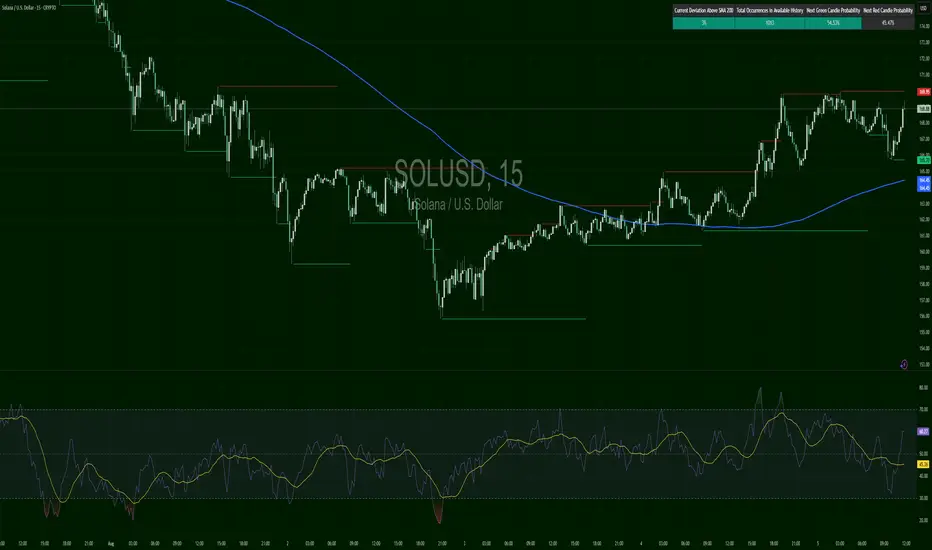
SOLUSD – Volatility Coil UnleashedSOL bounced cleanly from SMA 200 at $164.45 and is now attempting to flip $169.95. Structure favors bulls. If it holds $166–$167 on pullbacks, upside continuation is probable.
Crypto market
BNBUSD – Midway StallBNB is stuck near the 200 SMA, failing to show momentum. RSI is weak. Only aggressive longs on support bounces or shorts on rejections make sense here, but it's currently neutral with unclear flow.

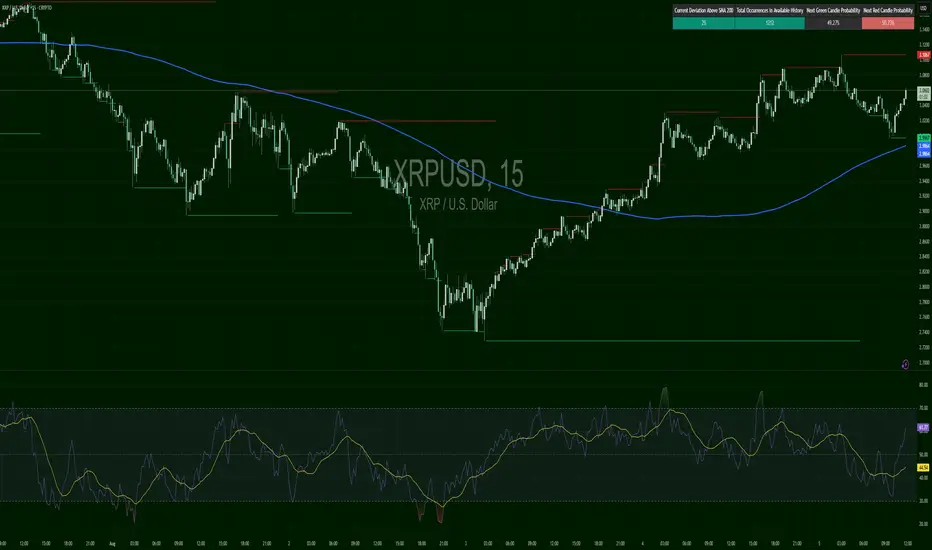
XRPUSD – Fade then HoldXRP saw an early-week fade from the $3.12 zone and is now trying to hold support above the 200 SMA ($2.96). RSI is gradually turning back up (44.27 to 50+ range soon), showing first signs of stabilization.
Long trade
15min TF overview
🟩 Trade Type: Buyside Trade
Pair: ETHUSDT
Date: Sunday, 3rd August 2025
Time: 5:15 PM
Session: London–New York Overlap (LND Session PM)
Timeframe: 15 minutes
🔽 Entry Parameters
Entry Level: 3,455.23
Stop Loss: 3,436.73 (-0.54%)
Take Profit: 3,877.00 (+12.21%)
Risk-to-Reward (RR): 22:8
📉 Market Structure & Technicals
Trend Context:
Price reversed from a steep bearish trend and showed signs of a bullish momentum shift.
EMA/WMA Levels:
EMA (blue) and WMA (yellow) show a bullish crossover at the point of entry
Both MAs began to slope upward, confirming the trend shift.
Liquidity Observations:
Clean sweep of prior lows below 3,500 preceding entry.
Price traded back into a premium zone after reacting from a deep discount.
🧠 Narrative / Rationale
Set up Narrative:
ETH completed a strong downtrend and printed a bullish market structure shift (MSS) on the 15-minute TF. Entry was taken after price reclaimed the (POI) and confirmed a higher low.
Current Status: Trade in progress, profit levels partially hit.
TP aligns with the previous supply zone or relatively equal highs around 3,784.
Additional liquidity above 3,877–3,915 for extended targets if trade continues.

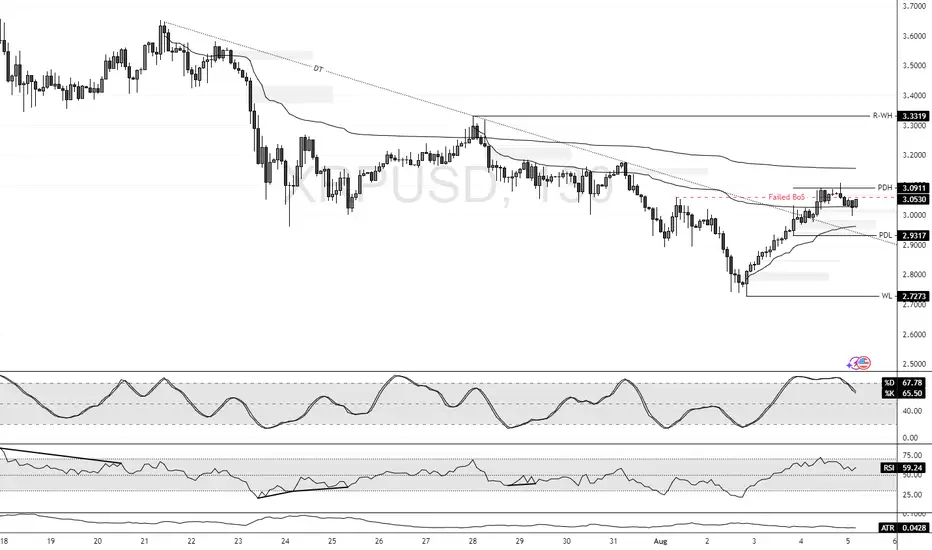
XRP's Failed Structure Break Signals Further ConsolidationFenzoFx—XRP/USD currently trades around $3.045 in a low-momentum market. Stochastic exited the overbought zone and is declining, signaling strengthening bearish momentum. The failed structure break in the New Session suggests a liquidity sweep with weak bullish interest.
Immediate resistance stands at $3.091. Technically, price is expected to decline toward the previous day's low at $2.931, a key liquidity zone. Please note that the bearish outlook is invalidated if price exceeds $3.091.
ETH - next 10 days longHello traders :) My technical analysis according to market sentiment.
~~~ 4000 USD for ETH is crucial to cross and stay above
(ratio for this price is 0.035 BTC/ETH and BTC 115 000k ~~~
BTC.D -> going down 61.66% (we touch PoC 65% and now going slowly down, we need to go down below 60% for real altcoin season )
BTC/ETH is going up (currently we reached PoC - 0.032, targets 0.05-0.08),
USDT.D -> going down (PoC - 4.25 %, should be arround 2.2% when we peak bull market - can be extended to 2026)
BTC.D
ETHUSD
USDT.D
ETHBTC
If ratio for BTC/ETH is arround 0.05 and BTC has value 135000 USD , then ETH can reach 6800USD which is very reasonable price to reach.
BTC goes sideways 110k-118k , ETH need to go up and cross main resistance 4000 USD.
We can continue bull market for next 2-4 months.
Write me if you want what do you think about this progress ?
Best regards
Norbert

#CGPT/USDT#CGPT
The price is moving within an ascending channel on the 1-hour frame, adhering well to it, and is on track to break it strongly upwards and retest it.
We have support from the lower boundary of the ascending channel, at 0.0888.
We have a downtrend on the RSI indicator that is about to break and retest, supporting the upside.
There is a major support area in green at 0.0881, which represents a strong basis for the upside.
Don't forget a simple thing: ease and capital.
When you reach the first target, save some money and then change your stop-loss order to an entry order.
For inquiries, please leave a comment.
We have a trend to hold above the 100 Moving Average.
Entry price: 0.0900.
First target: 0.0909.
Second target: 0.0922.
Third target: 0.0938.
Don't forget a simple thing: ease and capital.
When you reach your first target, save some money and then change your stop-loss order to an entry order.
For inquiries, please leave a comment.
Thank you.

Crypto: BNBUSDT to hit 800 this weekLike I told on ETHUSDT in my last trade which hit TP level exactly with no drawdown:
, this is same trade like ETH on BNBUSDT, with my back testing of this strategy, BNBUSDT need to touch 800 this week or next monday.
This is good trade.
Don't overload your risk like Greedy gambler!!!
Be Disciplined Trader, what what you can afford.
Use proper risk management
Disclaimer: only idea, not advice

#CAKE/USDT : Trying to break horizontal resistance#CAKE
The price is moving within an ascending channel on the 1-hour frame, adhering well to it, and is on track to break it strongly upwards and retest it.
We have support from the lower boundary of the ascending channel, at 2.58.
We have a downtrend on the RSI indicator that is about to break and retest, supporting the upside.
There is a major support area in green at 2.55, which represents a strong basis for the upside.
Don't forget a simple thing: ease and capital.
When you reach the first target, save some money and then change your stop-loss order to an entry order.
For inquiries, please leave a comment.
We have a trend to hold above the 100 Moving Average.
Entry price: 2.61
First target: 2.63
Second target: 2.66
Third target: 2.71
Don't forget a simple thing: ease and capital.
When you reach your first target, save some money and then change your stop-loss order to an entry order.
For inquiries, please leave a comment.
Thank you.

127000 USD on BTC? Analysis of the Bitcoin (BTC/USD) chart on the TradingView platform reveals several key observations. The current price is hovering around $114,249.14, suggesting a short-term decline following a previous significant rise, evident as a high peak on the chart. The two moving average lines—green (shorter period) and red (longer period)—indicate an upward trend, as the green line is above the red, signaling bullish strength in the broader perspective. However, recent red candles point to selling pressure, with the price approaching a support zone around $113,000–$114,000, which could serve as an area of consolidation or a potential rebound.
In the lower part of the chart, the oscillator (e.g., RSI or another momentum indicator) remains in a neutral zone, suggesting no significant overbought conditions but also a lack of strong momentum for further declines. It’s worth noting that the price is currently testing a critical support level, and a break below this could lead to further downside, while a bounce could target higher levels. Based on the current trend and historical price action, a suggested target price of $127,000 USD appears achievable if the support holds and bullish momentum resumes, potentially driven by a breakout above the recent high.
Potential TP: 127 000 $

PENGUUSDTIf confirmed with your personal setups, it makes sense to take a risk to fall to the specified range, given the current conditions.

BTC?Hi
Don't miss 114000-114500 range
I think it's a value area for now.
Risking 1000$ points only
Potential Upside as per previous analysis, AI etc
All the best
Not a guru

XRP ?
Hi
Don't miss 3-3.05 range
I think it's a value area for now.
Risking 0.05c only
Potential Upside as per previous analysis, AI etc
All the best
Not a guru

B3/USDT BREAKOUT ALERTB3 is showing strong bullish momentum with a confirmed breakout above resistance, signaling a potential trend shift.
📈 Breakout Level:
$0.00388 – Key resistance flipped into support on high volume ✅
🔑 Key Levels to Watch:
Immediate Support: $0.00388(former resistance)
Next Resistance: $0.0050 – psychological & technical barrier
📊 Volume Surge:
+150% volume increase = strong buyer interest
RSI approaching overbought – watch for consolidation or retest
🔁 Retest Zone:
If price pulls back, look for a bounce around $0.003187 to confirm continuation
🚀 Bias: Bullish above $0.0033
Keep an eye on market sentiment and BTC correlation
BINANCE:B3USDT.P

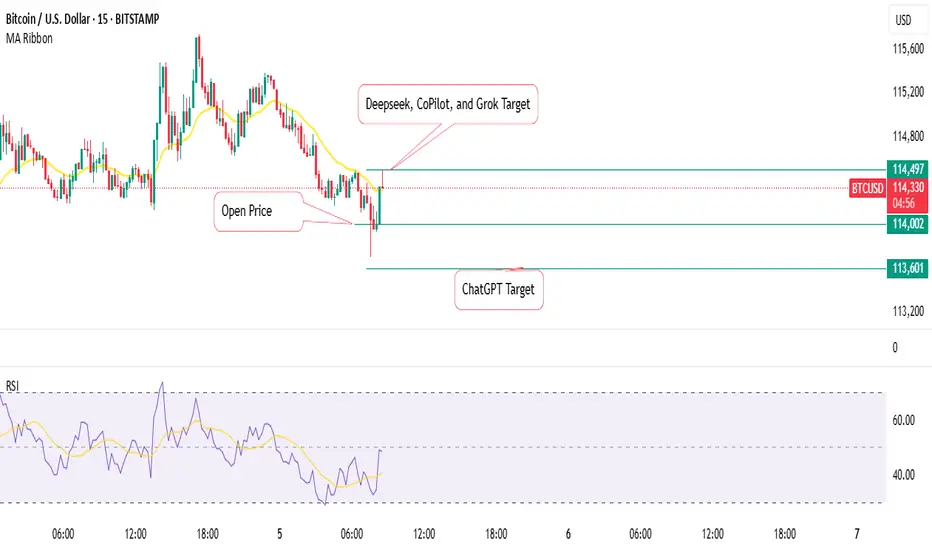
We have the Winner: AI Predicting Bitcoin PricesI asked Grok, CoPilot, ChatGPT, and Deepseek to predict the Bitcoin price with the indicators of their choice.
Only ChatGPT ended up losing.
BITSTAMP:BTCUSD
#VET/USDT Ascending Broadening Wedge #VET
The price is moving within an ascending channel on the 1-hour frame, adhering well to it, and is poised to break it strongly upwards and retest it.
We have support from the lower boundary of the ascending channel, at 0.02290.
We have a downtrend on the RSI indicator that is about to break and retest, supporting the upward move.
There is a key support area (in green) at 0.02278, which represents a strong basis for the upward move.
Don't forget one simple thing: ease and capital.
When you reach the first target, save some money and then change your stop-loss order to an entry order.
For inquiries, please leave a comment.
We have a trend of stability above the Moving Average 100.
Entry price: 0.02306
First target: 0.02339
Second target: 0.02378
Third target: 0.02423
Don't forget one simple thing: ease and capital.
When you reach the first target, save some money and then change your stop-loss order to an entry order.
For inquiries, please leave a comment.
Thank you.

Sell BTC at 114236After the price took the buy-side liquidity of the weekend range, the price chifte the structure to bearish for this reason, it's a good opportunity to sell at this level

It is a time for FISUSDT? 30% profit - 0.15 USDThe analysis of the FIS/USDT chart on Mexc shows that the current price is around 0.11534 USD, close to a local low after a recent decline. A clear downtrend is visible since the July peak, but recent days suggest a potential rebound, which could mark the start of an upward movement. A suggested rise to 0.15 USD (approximately 30% from the current level) is possible if the price breaks through the resistance around 0.12 USD and stays above the 50-day moving average, currently acting as dynamic support. This move could be supported by increasing volume and positive signals from the oscillator at the bottom of the chart, if it indicates an exit from the oversold zone. A key support level is at 0.11 USD – a drop below this could invalidate the bullish scenario. It is recommended to monitor the breakout above resistance and confirm the trend in the upcoming sessions.
Potential TP: 0.15 $

DPET - bounced, what now?DPET finally bounced up but is now near overbought zone (no bearish divergences yet). When looking at pattern we see similarity to HBAR which had same tpye of bounce was also overbought but still managed to push further up till it wicked above flag formation to invalidate new ATL scenario. Only then it went into correction. We might see same thing play out also for DPET which would open path to fibb 0.886 range test.

BTC sounded the alarm, 115,000 became the key point#BTCUSD
Last week, as global risk sentiment deteriorated, the cryptocurrency market came under pressure, pushing BTC back from its recent highs. This correction was significant, and while BTC has subsequently rebounded, technically, the bearish divergence signaled by the daily MACD indicates weakening short-term rebound momentum. The Bollinger Bands on the 4-hour chart are trending downward, indicating that the market remains in a period of volatile correction.
If BTC cannot effectively break through the upper resistance of 115,000 in the short term, the bears may continue to exert their strength. You can consider shorting with the target at 114,000-113,000.
🚀 SELL 115,000-116,000
🚀 TP 114,000-113,000

Ethereum pumpingA breakthrough is coming for Ethereum after testing $3800 for the fourth time, with $8000 as the target.

DEGO - now or never....DEGO is oversold, bouncing from longterm RSI support line and has pattern similar to XRP - just that accumulation range is more horizontal. We are at the point where no further dips are allowed or we get invalidation! Expecting bounce up and push toward fibb 0.886 range (conservative move) with possible scam wick to new ATH (extended, speculative move).

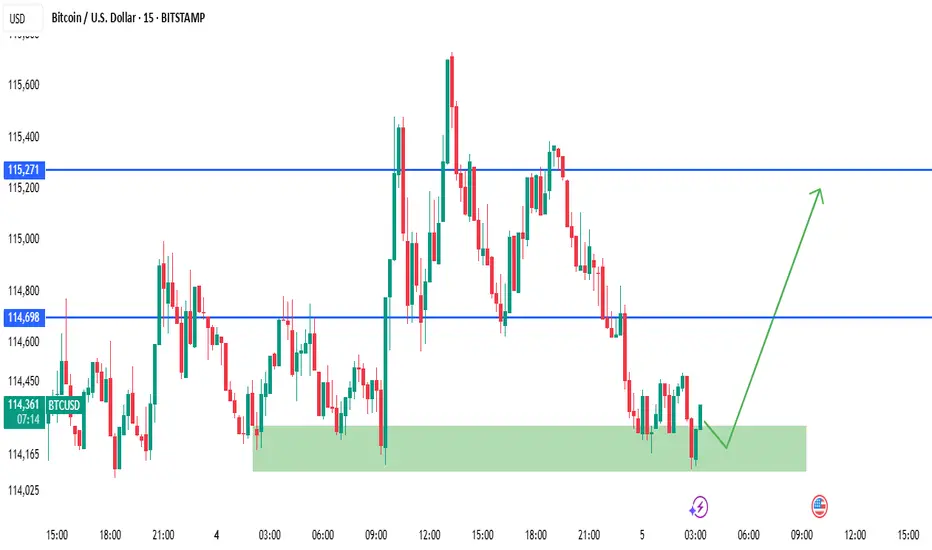
BTCUSD Rejection from Demand Zone – Bullish Play Ahead?Bitcoin just tapped into a strong intraday demand zone (green zone) after a clean selloff. This area has previously acted as a reaction point and is showing signs of holding again.
🔰 Key Levels:
🟩 Demand Zone (Buy Zone): $114,050 – $114,200
🔵 Intraday Resistance: $114,698
🔵 Final Target (Liquidity Pool): $115,271
💡 Bullish Plan:
Entry: Inside demand zone ($114,050 – $114,200)
SL: Below $114,000 (structure invalidation)
TP1: $114,698
TP2: $115,271
The green arrow shows a potential bullish move towards liquidity resting above recent highs if price shows rejection or bullish candle confirmation (e.g., engulfing, pin bar).
📊 SMC Notes (Optional for Advanced Traders):
This is a possible mitigation of a bullish order block from earlier structure.
Price may be completing a liquidity sweep before internal structure break and rally.
Watch for a Change of Character (CHOCH) on lower timeframes for refined entry.
⚠️ Disclaimer:
This is not financial advice. Always use proper risk management and confirm your entries. This is for educational and analysis purposes only.
🔖 Tags:
#BTCUSD #Bitcoin #SmartMoney #PriceAction #OrderBlock #CryptoSignals #RejectionTrade #FrankFx14 #TradingView