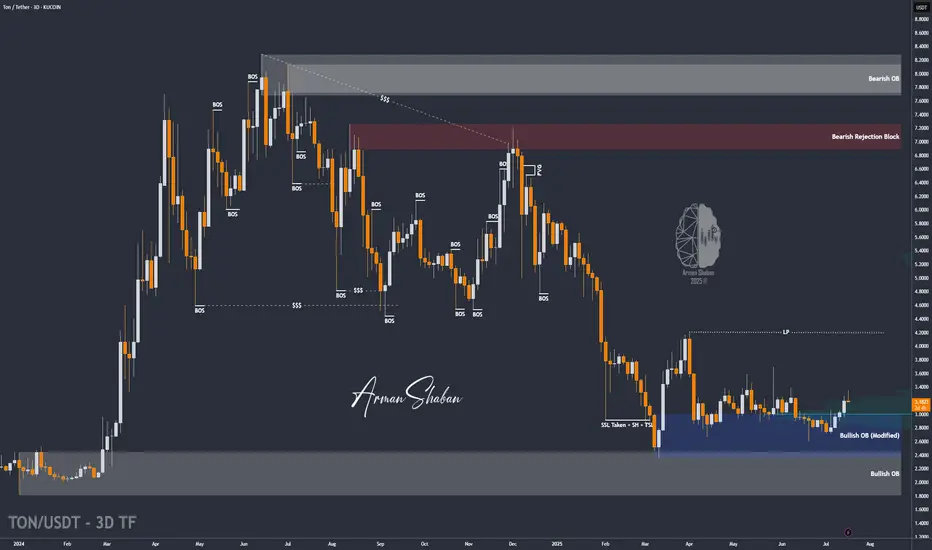
TON/USDT | Another Bullish Move Ahead? (READ THE CAPTION)By analyzing the Toncoin chart on the 3-day timeframe, we can see that, as per yesterday’s analysis, the price climbed to $3.36 before facing a slight correction — which is perfectly normal since every strong bullish trend needs a healthy pullback. The $3.05–$3.20 zone could serve as a good accumulation area for buyers, and we may soon witness another impressive rally from Toncoin! Based on the previous analysis, the next targets are $3.63, $4.20, and $4.68.
Please support me with your likes and comments to motivate me to share more analysis with you and share your opinion about the possible trend of this chart with me !
Best Regards , Arman Shaban
Crypto market
Dirty Little Crypto World: Episode 1 (Update)🚨 Dirty Little Crypto World: Episode 1 (Update)
Short: PUMPUSDT
📉 Entry: 0.006560
📉 Current: 0.004057
🧠 Result: +2861.65% (75x short)
🔥 Status: Exposed.
While the market was celebrating Ethereum, DOGE, XRP, ADA and quality alts breaking out — Pump.fun floated in like a black cloud, perfectly timed to distract, drain, and destroy.
Just as crypto needed clarity and capital, exchanges helped launch a Token designed to suck in liquidity and sentiment like a vacuum.
And guess what?
It gave us the perfect hedge.
🧠 When Many Went Long, we Sniffed the Trap
I shorted the creation-pump setup.
And while many believed the illusion — I saw the structure.
I smelled the bullcrap from far away.
I trusted my chart.
And honestly...
Thank you, Pump team.
You gave the market noise.
We found the edge.
🚩 Quick Recap for the semi-Blind:
PEG18-rated app targeting beginners 🧒
1-click token launches with zero due diligence 🤡
Meme marketing masking extraction mechanics 📉
Massive overnight CEX listings (coordinated?) 🏦
No docs, no doxxed team, no KYC, no accountability ❌
Fake decentralization layered with stealth fees 🕳️
Bots + latency = built-in slippage trap 🐍
🧼 Let’s Call It What It Is
This isn’t innovation.
This isn’t memefication.
This isn’t even fun.
It’s exploitation — wrapped in emojis and FOMO.
We’re building this 10-part series not out of anger, but duty.
Because crypto must evolve — or it will collapse under its own distractions.
🐾 Elon Knew.
You see this dog?
He didn’t chase candles.
He sniffed the smoke — and sat short. 💨👃
🦴 No bones were harmed.
But a lot of overleveraged longs were.
📖 Missed the first post?
👉 Go read Episode 1 — this is just the update.
📈 This isn’t a thread. It’s a track record.
Next episode soon.
We’re just getting started over here.
The FXPROFESSOR 💙
Fighting for the good side of crypto – with truth, trades, and a sniffing dog.

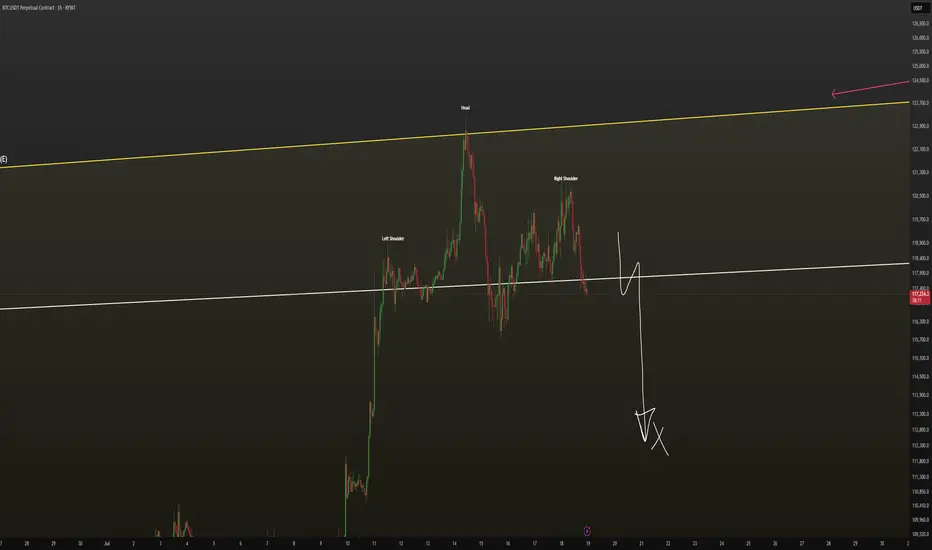
BTC - local situation (1h) SHORT🔻 Breaking down from a bearish pattern.
I expect a local decline to $114,000 - $112,000 on the 1h timeframe.
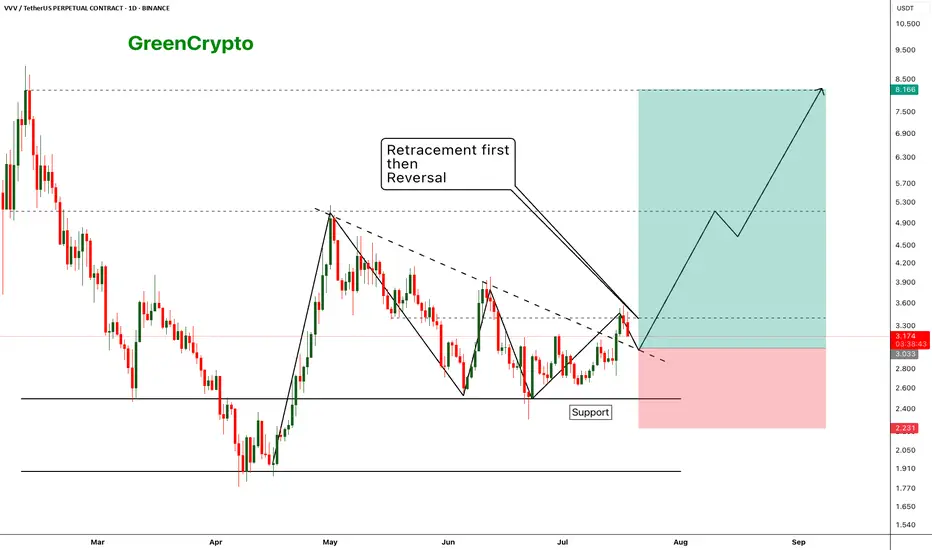
VVV - Expecting perfect reversal after the retracement- price has broken out from the resistance trendline and now we are seeing a retracement as expecting
- Price should hold the support (previous resistance) and reverse from the suppport zone.
- we can enter our trade once the retracement completed
Entry Price: 3.033
Stop Loss: 2.231
TP1: 3.411
TP2: 4.037
TP3: 4.851
TP4: 6.360
TP5: 8.028
Max Leverage 5x.
Don't forget to keep stoploss.
Cheers!
GreenCrypto
ADA/USDT | BIG Bullish Move Ahead! (READ THE CAPTION)By analyzing the Cardano chart on the 3-day timeframe, we can see that, as expected, the price continued its rally, reaching $0.89 before collecting liquidity above the $0.86 level and then facing a correction. Currently trading around $0.81, we expect the bullish trend to continue after this minor pullback. Key demand zones are at $0.78, $0.69, and $0.61. Based on the previous analysis, the next short- to mid-term bullish targets are $0.93, $1.05, and $1.33.
Please support me with your likes and comments to motivate me to share more analysis with you and share your opinion about the possible trend of this chart with me !
Best Regards , Arman Shaban

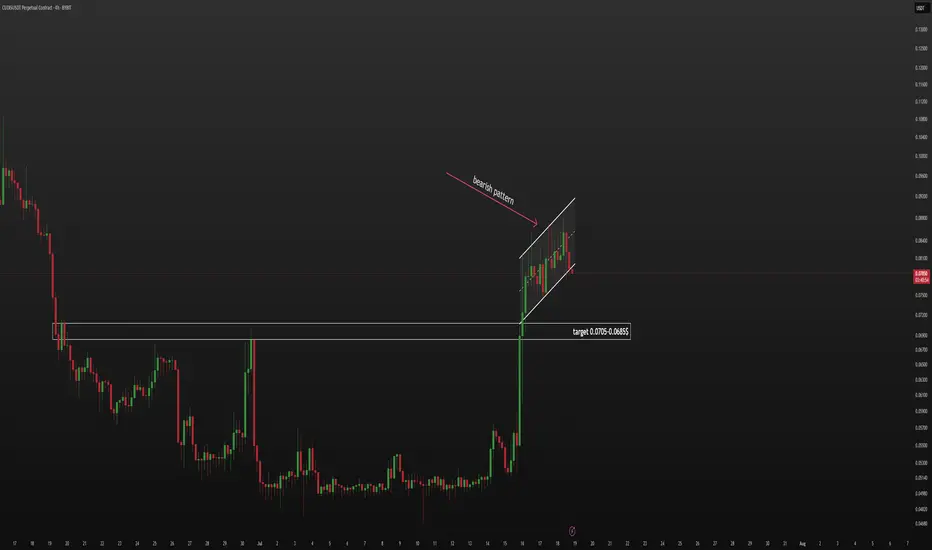
CUDIS - bearish pattern (short)🔻 Breaking down from a bearish pattern.
I’m opening a short position. Expecting a move down to the $0.0705–0.0685 range.
HYPE - bearish pattern (25-27$ soon...)🔻 Currently in a bearish pattern.
I'm expecting a drop to the $25–27 range. Opened a short position, with a stop above the all-time high (ATH).

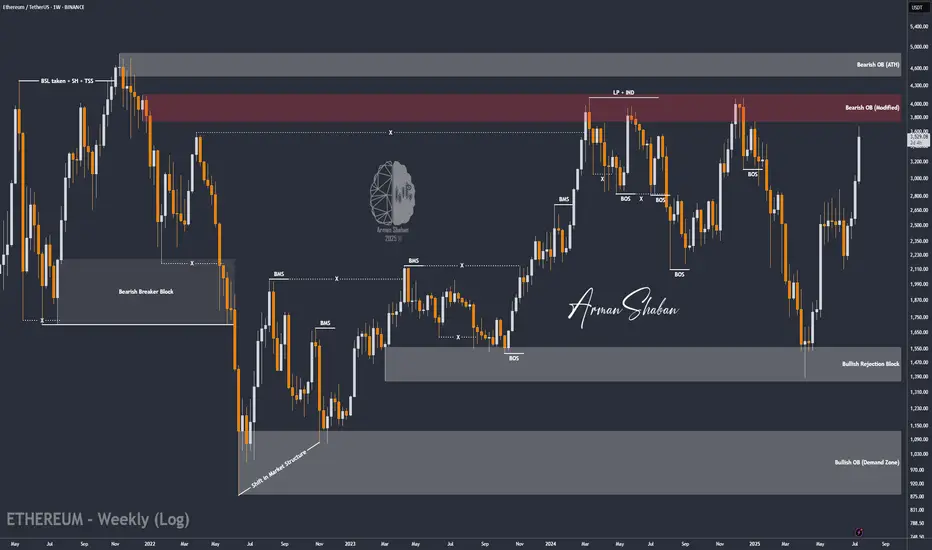
ETH/USDT | The Next Target is $4000 and it's Close! (READ)By analyzing the Ethereum chart on the weekly timeframe, we can see that this cryptocurrency remains one of the strongest major cryptos in the market, continuing its bullish rally despite the overall market correction. It has already hit the next target at $3500, and I believe we might see Ethereum reaching $4000 sooner than expected! Based on previous analyses, if this bullish momentum continues, the next targets will be $3740, $4100, and $4470.
Please support me with your likes and comments to motivate me to share more analysis with you and share your opinion about the possible trend of this chart with me !
Best Regards , Arman Shaban
AGLDUSDT 1DPay attention to the #AGLD daily chart.
It has already broken above the descending resistance and is currently testing the daily SMA100 multiple times.
Consider buying some #AGLD here and near the support levels at $0.747 and $0.687.
If a breakout above the SMA100 occurs, the upside targets are:
🎯 $0.976
🎯 $1.092
🎯 $1.207
🎯 $1.372
🎯 $1.582
⚠️ Always use a tight stop-loss and apply proper risk management.

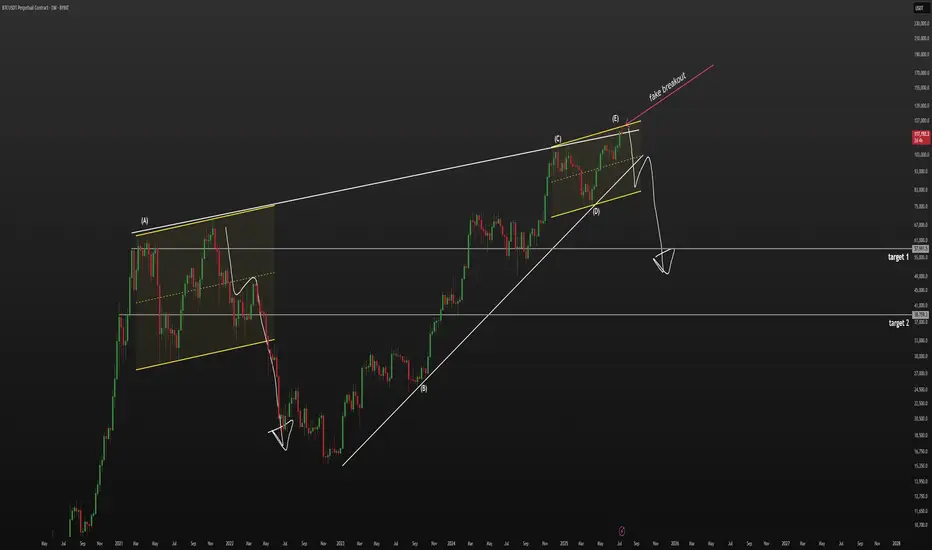
BTC - bearish wedge, 60k$ not a joke🔻 Globally, we are in a bearish wedge.
The price made a fake breakout and currently looks weak. On the 1D timeframe, we’re in an ascending channel similar to what we saw in 2021. Back then, after making a second higher high, the price sharply reversed downward.
📉 I believe the relevant downside targets are $60,000 and $40,000.
🔺 I’m currently in a short position, with a stop at $125,333.
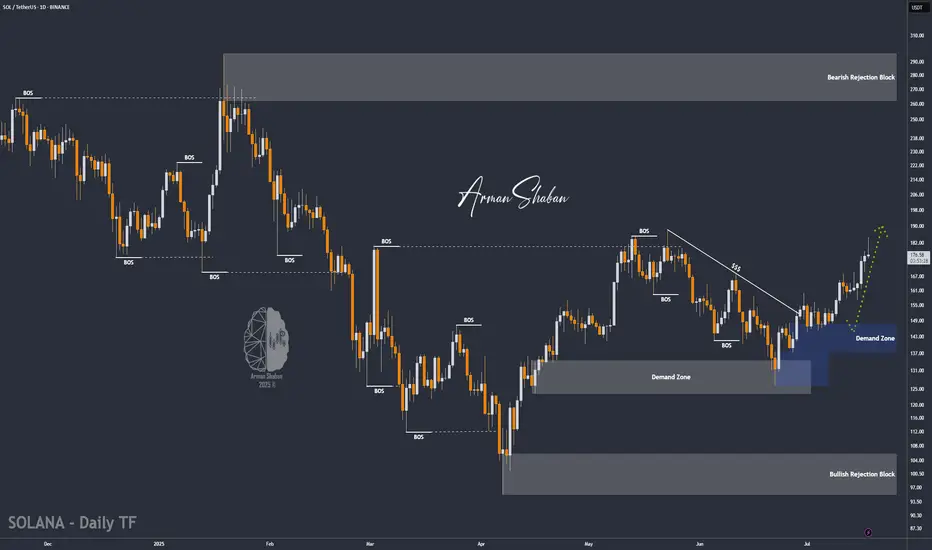
SOL/USDT | Next Bullish Leg Ahead if Key Support (READ)By analyzing the Solana chart on the daily timeframe, we can see that today the price climbed to $184, almost hitting the next target at $187, before facing a correction. It is currently trading around $176. If Solana manages to hold above the key support zone between $168 and $174, we can expect the next bullish leg to start, potentially extending up to $227. The previous analysis remains valid, with the next upside targets at $187, $220, and $263.
Please support me with your likes and comments to motivate me to share more analysis with you and share your opinion about the possible trend of this chart with me !
Best Regards , Arman Shaban
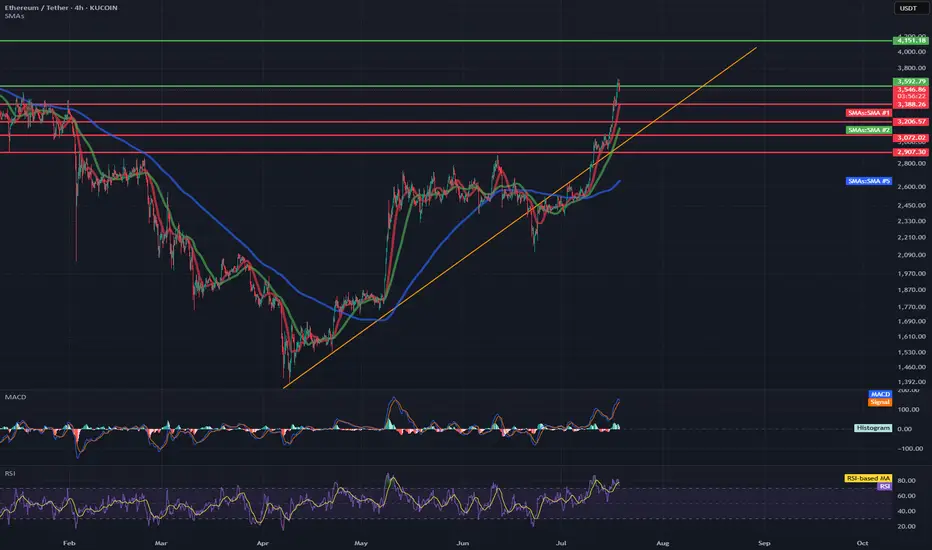
ETH/USDT 4H Chart✅ Market Trend and Structure:
Uptrend: The highlighted orange trend line shows continuous growth since mid-April. The price is trading above the 50- and 200-period moving averages (EMA and SMA), confirming bullish sentiment.
Current price: around 3556 USDT – very close to local highs.
Resistance break in the 3200–3300 USDT area, which now acts as support.
📈 Technical Levels:
Resistance (red horizontal lines):
3600–3650 USDT – local resistance resulting from market reaction.
3888 USDT – next historical resistance level.
4133 USDT – established long-term target (green dashed line at the top).
Support:
3300 USDT – strong support after a previous breakout.
3080 USDT – previous high, now the next support level.
3070 / 2900 USDT – key technical support levels in the event of a larger correction.
📊 Indicators:
MACD:
The MACD is in a strongly bullish zone, but:
The histogram is flattening.
A bearish crossover pattern is possible in the following candles – a signal of weakening momentum.
RSI:
RSI ~74 – is in the overbought zone, which often heralds a correction or at least consolidation.
A value above 70 confirms the bullish trend but may suggest that momentum is overheated.
📌 Conclusions and Scenarios:
🔼 Upside Scenario (trend continuation):
If the price remains above 3300–3350 USDT, it could move towards 3888, and then 4133 USDT.
A break above 3650 USDT on heavy volume will be a strong continuation signal.
🔽 Corrective scenario (short-term pullback):
The RSI and MACD suggest a possible correction.
Potential pullback to:
3300 USDT (retest of previous resistance as support).
SMA 200 (~2600 USDT) with a deeper downward move.
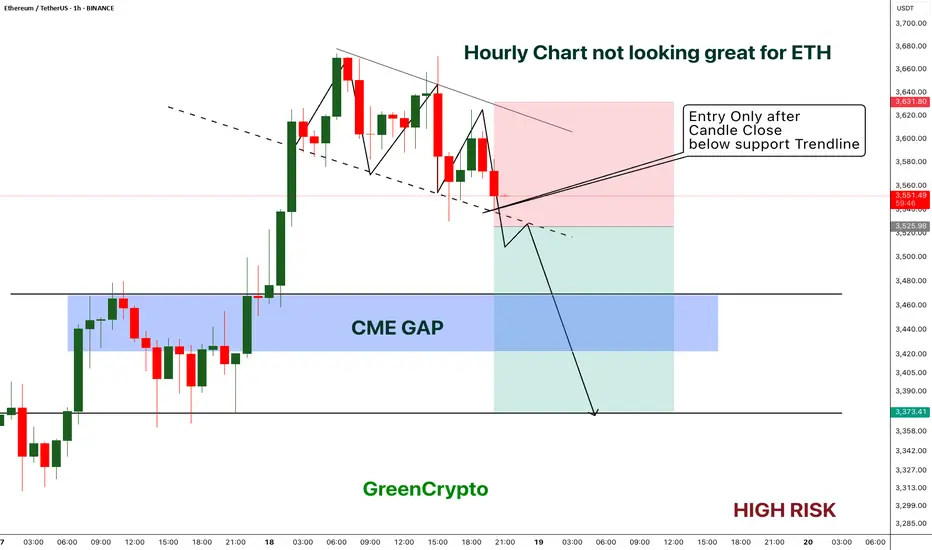
ETH - Short Trade with HIGH RISK- ETH got reject from resistance multiple times on 1H timeframe and now the price is playing near the support.
- I'm expecting overall market to cooldown this weekend, this could push the ETH to break the support
- ETH has CME gap around 3422 - 3467 range, im expecting this CME gap to be filled soon.
Entry Price: Below 3525
Stop Loss: 3631
TP1: 3471.15
TP2: 3381.76
Move SL to breakeven on TP1 hit.
Don't forget to keep stoploss.
Cheers
GreenCrypto
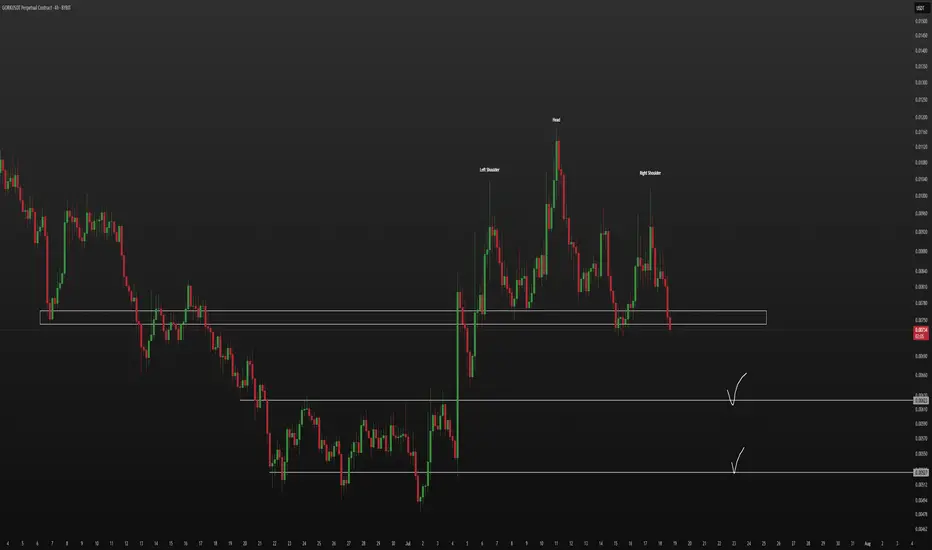
GORK - Bearish pattern (short)🔻 A bearish Head and Shoulders pattern is forming.
I expect a decline towards $0.0062 and $0.0053.
📉 Short position is the priority.
Up to New HighsDO NOT FORGET USING A STOP LOSS
Warning:
This is just a suggestion and we do not guarantee profits. We advise you analyze the chart before opening any position.
I hope you are always profitable

LINK Just Rejected Hard — Is the Rally Already Over?Chainlink exploded straight into multi-month resistance — and instantly got slapped down. First taps often reject, but if price flips this zone into support, it could open the door to $20+. One of the most important levels on the chart.

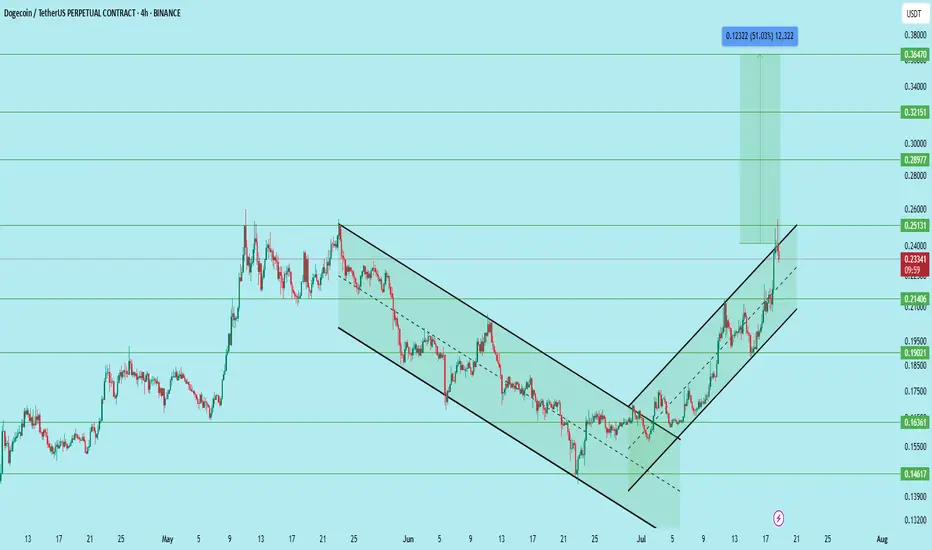
DOGE/USDT – Bullish Setup with Clear Channel BreakoutDogecoin has successfully broken out of a falling wedge and is now trending within a rising channel on the 4H timeframe. The price recently reclaimed the 0.214 support zone and is now showing continuation with strong volume and structure.
After the breakout and multiple retests, the pair offers a compelling long opportunity.
Setup Details:
Entry Zone: 0.208 to 0.214
Stop Loss: 0.186
Targets:
• 0.251 – First major resistance
• 0.289 – Mid-level breakout target
• 0.321 – Psychological round number
• 0.364 – Final target (approx. 51% move)
Technical Structure:
Breakout from falling wedge followed by bullish channel, Higher highs and higher lows clearly forming, Volume supports accumulation near breakout levels, Support holding above 0.214, confirming demand
Support Zones:
0.214 (reclaimed)
0.190 (intermediate)
0.163 (major demand zone)
Resistance Zones:
0.251
0.289
0.321
0.364
This setup offers a clean risk-reward ratio with confirmation on trend continuation. A rejection at 0.251 may present another opportunity to re-enter on a retest.
DYOR. Not financial advice.
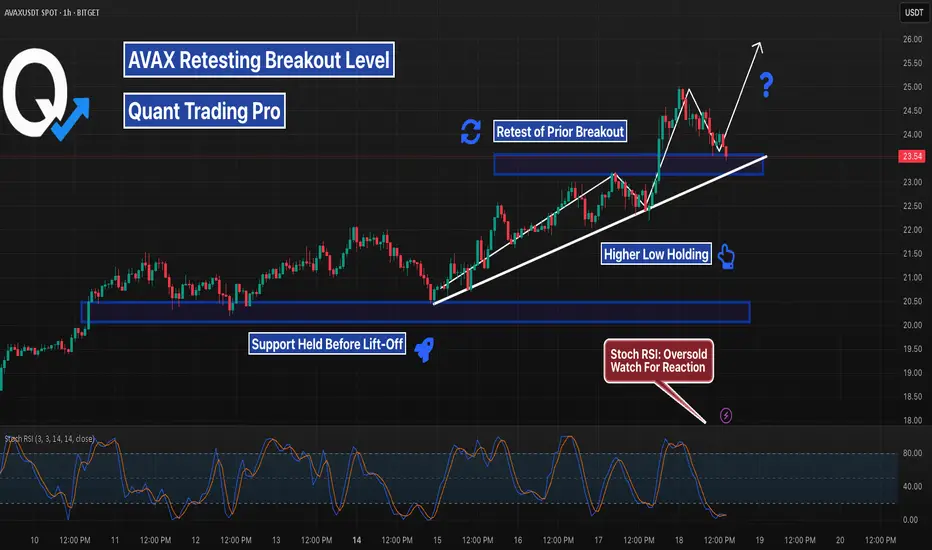
AVAX Backtests Breakout — Bounce Now or Dump Later?AVAX has pulled right back into the same level it broke out from days ago. With Stoch RSI fully oversold, this is a high-probability reaction zone — but if bulls don’t show up, next support sits lower around $21.50. Tight risk, high reward.
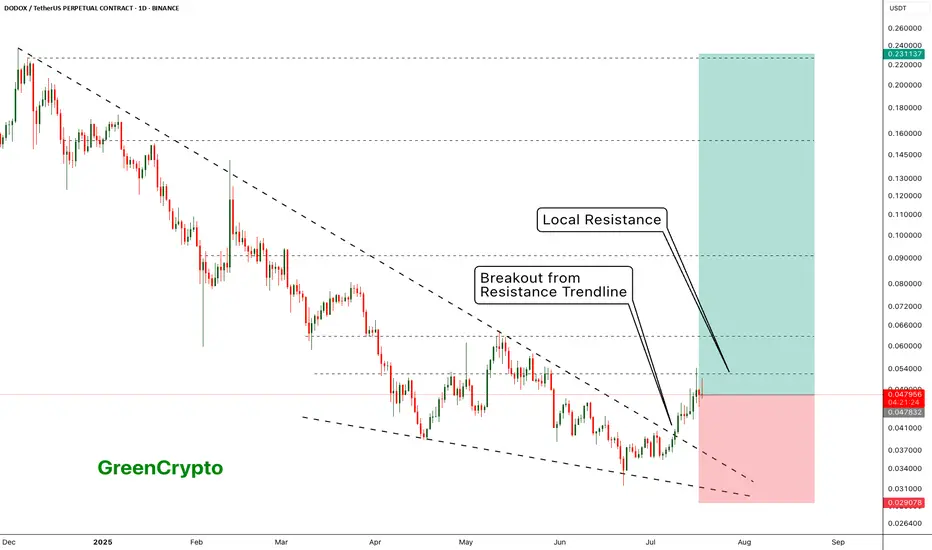
DODOX - Resistance is holding it back - Huge Potential- DODOX has successfully broken out from the resistance trendline
- Now its being pushed back back the weak local resistances
- I see a huge upward potential here.
Entry Price: 0.048271 ( Or you can wait for it breakout from the local resistance of 0.063051)
Stop Loss: 0.029078
TP1: 0.062621
TP2: 0.079766
TP3: 0.103243
TP4: 0.151853
TP5: 0.222332
Max Leverage 5x.
Don't forget to keep stoploss
Cheers!
GreenCrypto
AAVE Bounce or Breakdown — Trendline Test #3AAVE is testing a clean 3-touch trendline that’s held for days. Current confluence with the range low and Stoch RSI reset makes this a textbook long setup — but if the trendline fails, expect quick downside. Risk defined. Eyes on the next candle.

Buy the dip. BullishWhen xrp breaks out of this pattern we can expect much more upside. Entering price discovery.

Stellar Sitting Mid-Range — Patience Before the Pop?XLM has been stuck in a defined range, with both the top and bottom holding multiple times. Stoch RSI is resetting, and price is nearing the midpoint again. Breakouts from ranges like this often come when traders get bored — stay alert.

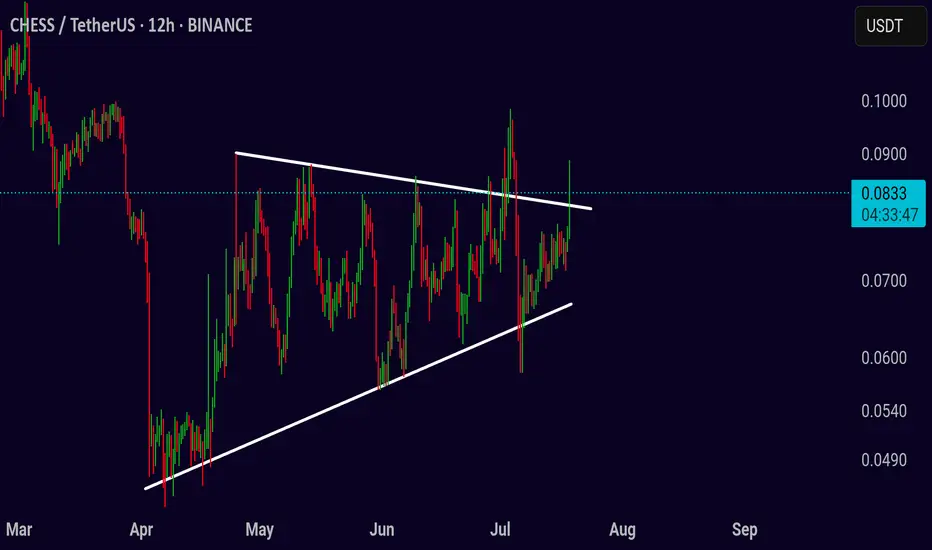
Ultimate Breakout Strategy for CHESS/USDT
The CHESS/USDT chart is currently consolidating in a symmetrical triangle pattern, signaling that a breakout could be imminent. As the price squeezes within converging trendlines, the next move is critical. Will the price push higher or drop lower? Let’s take a closer look at the potential setups.
Bullish Breakout Opportunity
If the price breaks above the upper resistance at 0.085, this could signal a bullish breakout. A strong move above this level could lead to further upward momentum, targeting levels at 0.095, 0.105, and even 0.115. Placing a stop loss at 0.075 ensures you’re protected if the price fails to maintain the breakout and reverses. Keep an eye on volume—this will be a key indicator to confirm the breakout’s strength.
Bearish Breakdown Risk
If the price fails to break above the resistance and drops below 0.075, it could signal a bearish breakdown. In this case, consider shorting the market with targets at 0.070 and 0.060. A stop loss just above 0.082 can be used to limit risks. Be sure to monitor volume closely to confirm the move, as low volume can lead to false breakdowns.
Pro Tip:
Volume plays a crucial role in validating breakouts and breakdowns. Look for a significant increase in volume when the price breaks key levels. A well-executed risk management plan with proper stop losses will help you stay in control no matter which direction the price moves.
Stay disciplined and follow the price action closely to make the most out of the upcoming move in CHESS/USDT. Whether it’s an upside breakout or a downside breakdown, this strategy prepares you for both scenarios.