Crypto market

BTC IDEAConfluence of Weekly FVG and Daily EBP (Engulfing Bar Play), entry on 4 hour when order block formed (defined by series of red down candles on 4 hour time-frame). Target 1:3 risk reward.

BBTCUSD long setupBTCUSD long setup
Entry - 111900.0
Stop Loss - 110670.0
Target - 123120.0
Risk Reward - 1:9.12

BTCUSDT Expanded Flat Correction may be overBear with me (pun intended). I know I'll probably get some slack from the 5 wave correction counting of wave C. Most people would place the 3rd wave in June instead of May, but a few things suggest me that the 3rd wave down was actually in May:
This C wave lies at the 123.6% extension of wave A which is a common area for the Expanded Flat correction.
Volume and RSI printing a divergence
2M RSI just broke out of its falling wedge
BTCUSDT resiliance at the 19k level, in contrast with the current equity price action & general sentiment, which goes against the previous sell offs of April and June
All of the above considered, there's still something missing : that the C wave should hold RSI divergence between wave 3 and 5 at completion, which did not happen with this counting. Also BTC would not only have be above the 19.3k resistance of the 123.6% extension of wave A (which is being rejected @ the moment) as it would also need to break & retest that yellow trendline (hands tied with the faster EMA's) that is holding its price down. But where is the fun in posting ideas when all of the cards are on the table? =D
All I'm saying is that this correction is closer to its ending than the other way around, and what I'm suggesting is that I wouldn't be surprised if it would be already over.
DYOR. Not advice

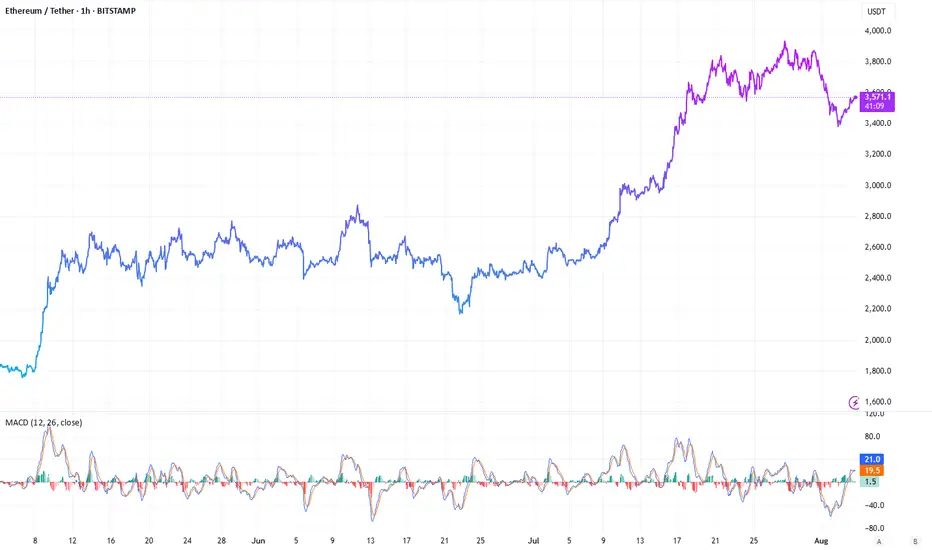
ETH Gears Up Again
ETH on the 4H is confirming the uptrend
MLR > SMA > BB Center — trend structure is bullish
PSAR has flipped bullish
RSI has plenty of room to run
MACD has turned green
Next resistance: 0.236 Fib and the 50MA.
On the macro side:
• Fed chair replacement talks
• Slower job numbers
• CFTC launching “Crypto Sprint”
Momentum is building. We’ll be here to watch it unfold.
Always take profits and manage risk.
Interaction is welcome.

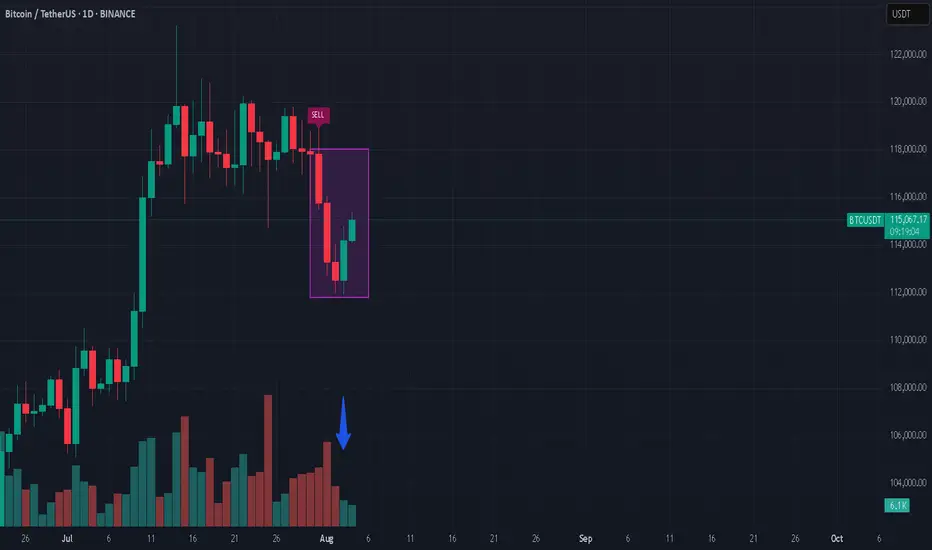
Shorting Bitcoin??Bitcoin had a huge drop, and suddenly shows strength? Well, in my opinion, if you look at the volume, there’s not much strength. I believe it’s going even lower in the short run.
*not investment advice
#bitcoin #crypto #trading
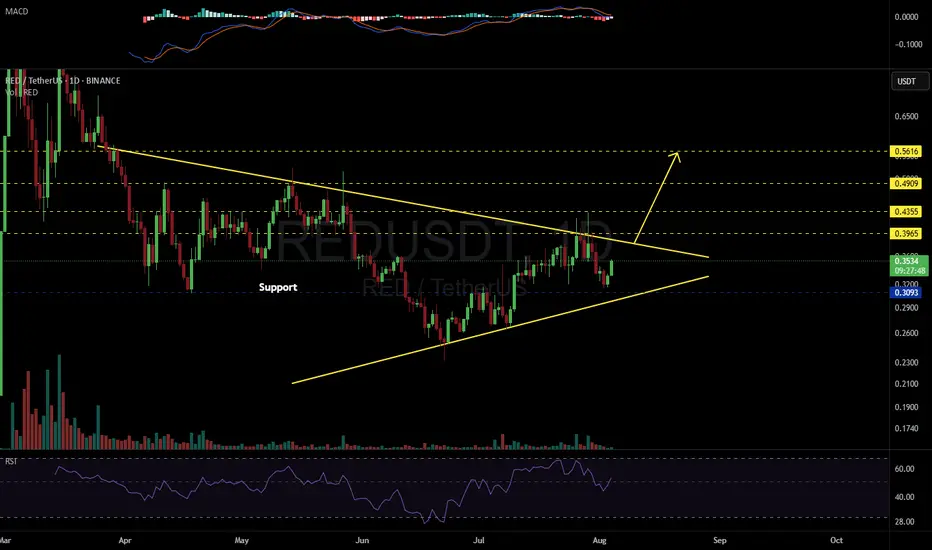
REDUSDT 1D#RED is moving inside a symmetrical triangle on the daily chart.
📌 Consider buying at the current price and near the support level at $0.3093 in case of a dip.
If a breakout occurs above the triangle resistance, the potential upside targets are:
🎯 $0.3965
🎯 $0.4355
🎯 $0.4909
🎯 $0.5616
⚠️ As always, use a tight stop-loss and apply proper risk management.
$BINANCE:BTCUSDT Needs a Clean Break Above $117,000The BINANCE:BTCUSDT pair has shown a mild bounce over the past 24 hours, now trading around $114,000. But zoom out, and the weekly performance still shows a nearly 4% dip, raising the question of whether this bounce has real legs or is just noise.
From a long-term holder perspective, on-chain selling pressure has been easing. Data from spent output bands shows that older wallets, particularly those holding BTC for 7–10 years, were active between July 23 and August 1.
However, the extent of selling was notably lower compared to the earlier July 10–19 stretch, when BINANCE:BTCUSDT dropped from $ 123,000 to $ 117,000. Even during this recent distribution phase, BTC managed to hold above $113,000, indicating strong market absorption and reduced overhead pressure.
Valuation-wise, the MVRV (Market Value to Realized Value) ratio currently sits at 2.19. Historically, this zone has acted as a reliable launchpad for Bitcoin rallies. Back in June, a similar reading of 2.16 preceded a move from $101,000 to $110,000. And in April, a 2.12 print led to a surge toward $119000. Right now, BINANCE:BTCUSDT sits in the same zone, supported by a quiet shift in trader sentiment. The long/short ratio flipped from a bearish 0.89 to 1.02, indicating more traders are finally betting on the upside.
From a price action standpoint, BINANCE:BTCUSDT needs to make a decisive move. It is currently holding above the 0.382 Fibonacci retracement level at $113,600. This level is derived from the June low of $ 98,000 to the all-time high of $ 123,000.
The next visible support levels sit at $111,900 and $110,000, while $107,000 remains the invalidation zone for any bullish thesis. However, the true pivot remains $ 117,000; a level marked by historical significance, volume clusters, and failed breakouts. Unless BINANCE:BTCUSDT clears and holds above $117,000, the broader uptrend remains vulnerable to yet another failed rally attempt.

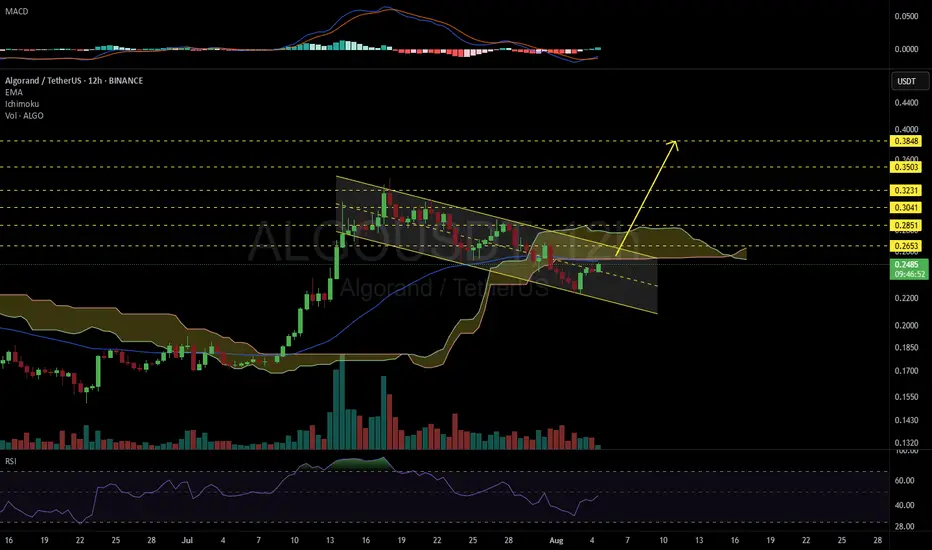
ALGOUSDT 12H#ALGO is moving inside a bullish flag on the 12H timeframe. It is currently facing resistance from both the Ichimoku Cloud and the 12H EMA50.
📌 In case of a breakout above these levels, the potential upside targets are:
🎯 $0.2653
🎯 $0.2851
🎯 $0.3041
🎯 $0.3231
🎯 $0.3503
🎯 $0.3848
⚠️ As always, use a tight stop-loss and apply proper risk management.
By virtual of StrengthBtc has reached its peak. Wave 5 has already been completed and it seems an Expanded flat or a running flat is in the making. If the analysis remains true, btc may run towards 140,000 before fall towards 80k to 60k regions. Long positions are currently favored on lower tfs.

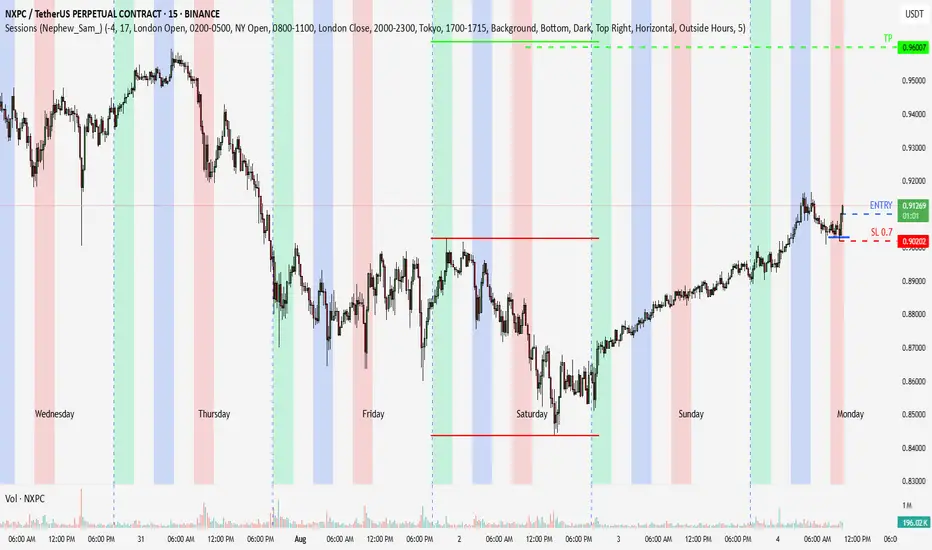
inside day + day 3second hour opened up and triggered the low of the session, engulf the high of the low bear for our entry.looking the hold till hit tp or closing time. if it make a higher low above my entry point i will break even. could be a big trade and a very quick one
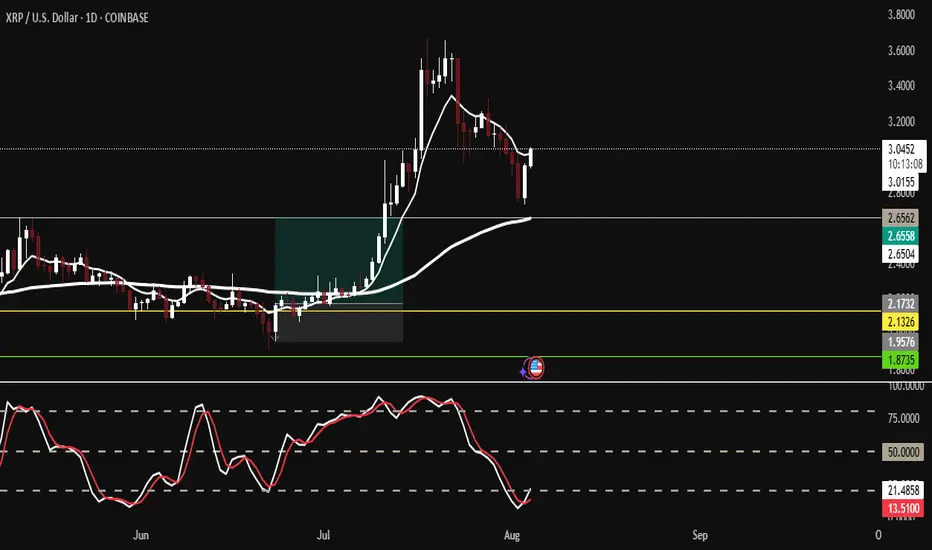
Vague idea of purchaseXRP after this sideways we had a median breakout if prices remain like this and there is a pullback to the next support.
It would be a huge trigger to buy until the next resistance region.
HBAR Triangle Tightens: Can Bulls Break $0.27?BINANCE:HBARUSDT continues to form a classic ascending triangle on the daily chart; an overall bullish continuation pattern. While the rising trendline from June shows steady higher lows, the key resistance at $0.27 has capped multiple breakout attempts.
A clean breakout above $0.27 would confirm the pattern, but the real battleground lies at $0.29, which aligns with the Fibonacci extension resistance drawn from BINANCE:HBARUSDT 's prior rally and retracement. If bulls clear this level, the path toward $0.31 and above opens up quickly.
On the downside, the rising support sits near $0.23. A breakdown below that level would invalidate the pattern and weaken the near-term outlook.
Zooming into lower timeframes, the 4-hour RSI shows a clear hidden bullish divergence, where the price made slightly lower highs but RSI climbed from 42 to 52. This often suggests momentum is building beneath the surface, supporting a continuation of the existing uptrend rather than a reversal.
While the BINANCE:HBARUSDT chart setup itself is strong, broader sentiment also supports this bullish lean. On-chain data shows sustained exchange outflows, reflecting investor confidence, and a majority of traders on Binance continue to hold long positions, pointing to a bullish bias in positioning.
Combined, the triangle structure, RSI divergence, and Fib level confluence suggest HBAR could be gearing up for a breakout; if outflows (rising bullish volume) confirm the move.

ConsenSys: Powering the Future of Cryptocurrency InfrastructureCryptocurrency ecosystem is actively maturing and investors are increasingly drawn to infrastructure providers that underpin the decentralized economy. Consensys is a leading blockchain software company, stands out with its flagship MetaMask wallet and a suite of Ethereum-focused solutions. With a robust business model and global adoption, Consensys offers a pretty interesting case for those, who are eyeing the backbone of Web3.
MetaMask: The Leading Crypto Wallet
Consensys’s flagship product, MetaMask, is one of the most widely used cryptocurrency wallets globally, competing closely with Trust Wallet for market dominance. Unlike centralized exchange storage, MetaMask is a decentralized, self-custodial wallet—essentially software that allows users to manage digital assets independently. With an estimated 30 million monthly active users, MetaMask facilitates billions in transactions, verifiable on the Ethereum blockchain.
MetaMask generates revenue through a 0.875% fee on token swaps, contributing to a reported $60 million in net profit for 2024. Its user base is spread across various markets, including Nigeria, Indonesia, the United States, South Korea, and Germany. In regions like Nigeria, where banking systems charge high fees, MetaMask transforms cash flow by enabling low-cost transactions. In developed markets like the U.S. and Germany, it serves as a gateway for asset storage and decentralized app (dApp) interactions.
A key growth catalyst for MetaMask is the potential launch of its own governance token. Unlike competitors Trust Wallet and Gnosis, MetaMask lacks a native token, which could streamline transactions and boost revenue by reducing reliance on third-party staking providers. Market speculation suggests a token launch could enhance MetaMask’s valuation and make it by this a hot topic for discussions.
Infura: Ethereum’s Infrastructure Backbone
Beyond MetaMask, Consensys’s Infura provides critical infrastructure for Ethereum COINBASE:ETHUSD , the world’s second-largest blockchain. Infura’s API services enable developers to build and scale dApps without running their own nodes, supporting over 430,000 developers and processing transactions worth over $1 trillion annually. Infrastructure is integral to Ethereum’s ecosystem, powering everything from DeFi platforms to NFT marketplaces.
Infura’s revenue model, based on usage fees ($40–$50 per 200,000 API requests), capitalizes on Ethereum’s growth. As transaction volumes rise—up 83% since 2017—Infura’s role as a reliable backend for MetaMask and other dApps positions it as a critical part of Consensys’s business.
Sharplink: Smart Contracts for Enterprises
Consensys’s Sharplink division develops software for smart contracts, serving high-profile clients like Ernst & Young , Airbus EURONEXT:AIR , JPMorgan NYSE:JPM , Microsoft NASDAQ:MSFT , and Amazon $NASDAQ:AMZN. Solutions enable secure and automated agreements on Ethereum, with applications ranging from supply chain management to digital identity. Central banks in countries like Norway and Israel are also exploring Sharplink’s technology for digital currency initiatives.
Staking and Asset Management
Consensys owns approximately $500 million in Ethereum and other cryptocurrencies, generating income from staking and other revenue-generating operations, thereby complementing the company's software offerings, ensuring financial stability, and providing access to the growth of the cryptocurrency market.
Why Consensys Stands Out
Lets take Kraken or Bybit, for example. Their reported trading volumes are quite difficult to verify, but at the same time, Consensys' decentralized products provide transparency. Every MetaMask transaction and Infura API call is recorded on Ethereum’s public ledger, allowing investors to validate activity. Such openness mitigates the exaggeration common in crypto, where claims of user bases or turnovers can be inflated.
Consensys’s diversified portfolio—spanning wallets, infrastructure, smart contracts, and staking, as we told before—reduces reliance on any single revenue source. Its global reach, from emerging markets like Nigeria to tech hubs like the U.S., further de-risks its business model. Major investors, including BlackRock, JPMorgan, and Microsoft, have already backed Consensys, signaling that way confidence in its long-term potential.
The Road Ahead
Founded by Ethereum co-founder Joseph Lubin, Consensys has raised $1 billion to date, with a reported valuation target of $7 billion for a potential IPO. While the timeline for going public remains uncertain, the company’s focus on Ethereum’s ecosystem positions it to benefit from Web3’s expansion. Challenges, such as regulatory scrutiny and competition from wallets like Trust Wallet or blockchains like Solana, exist, but Consensys’s entrenched role in Ethereum gives it a competitive edge.Cryptocurrency ecosystem is actively maturing and investors are increasingly drawn to infrastructure providers that underpin the decentralized economy. Consensys is a leading blockchain software company, stands out with its flagship MetaMask wallet and a suite of Ethereum-focused solutions. With a robust business model and global adoption, Consensys offers a pretty interesting case for those, who are eyeing the backbone of Web3.
MetaMask: The Leading Crypto Wallet
Consensys’s flagship product, MetaMask, is one of the most widely used cryptocurrency wallets globally, competing closely with Trust Wallet for market dominance. Unlike centralized exchange storage, MetaMask is a decentralized, self-custodial wallet—essentially software that allows users to manage digital assets independently. With an estimated 30 million monthly active users, MetaMask facilitates billions in transactions, verifiable on the Ethereum blockchain.
MetaMask generates revenue through a 0.875% fee on token swaps, contributing to a reported $60 million in net profit for 2024. Its user base is spread across various markets, including Nigeria, Indonesia, the United States, South Korea, and Germany. In regions like Nigeria, where banking systems charge high fees, MetaMask transforms cash flow by enabling low-cost transactions. In developed markets like the U.S. and Germany, it serves as a gateway for asset storage and decentralized app (dApp) interactions.
A key growth catalyst for MetaMask is the potential launch of its own governance token. Unlike competitors Trust Wallet and Gnosis, MetaMask lacks a native token, which could streamline transactions and boost revenue by reducing reliance on third-party staking providers. Market speculation suggests a token launch could enhance MetaMask’s valuation and make it by this a hot topic for discussions.
Infura: Ethereum’s Infrastructure Backbone
Beyond MetaMask, Consensys’s Infura provides critical infrastructure for Ethereum, the world’s second-largest blockchain. Infura’s API services enable developers to build and scale dApps without running their own nodes, supporting over 430,000 developers and processing transactions worth over $1 trillion annually. Infrastructure is integral to Ethereum’s ecosystem, powering everything from DeFi platforms to NFT marketplaces.
Infura’s revenue model, based on usage fees ($40–$50 per 200,000 API requests), capitalizes on Ethereum’s growth. As transaction volumes rise—up 83% since 2017—Infura’s role as a reliable backend for MetaMask and other dApps positions it as a critical part of Consensys’s business.
Sharplink: Smart Contracts for Enterprises
Consensys’s Sharplink division develops software for smart contracts, serving high-profile clients like Ernst & Young, Airbus, JPMorgan, Microsoft, and Amazon. Solutions enable secure and automated agreements on Ethereum, with applications ranging from supply chain management to digital identity. Central banks in countries like Norway and Israel are also exploring Sharplink’s technology for digital currency initiatives.
Staking and Asset Management
Consensys owns approximately $500 million in Ethereum and other cryptocurrencies, generating income from staking and other revenue-generating operations, thereby complementing the company's software offerings, ensuring financial stability, and providing access to the growth of the cryptocurrency market.
Why Consensys Stands Out
Take Kraken or Bybit, for example. Their reported trading volumes are quite difficult to verify, but at the same time, Consensys' decentralized products provide transparency. Every MetaMask transaction and Infura API call is recorded on Ethereum’s public ledger, allowing investors to validate activity. Such openness mitigates the exaggeration common in crypto, where claims of user bases or turnovers can be inflated.
Consensys’s diversified portfolio—spanning wallets, infrastructure, smart contracts, and staking, as we told before—reduces reliance on any single revenue source. Its global reach, from emerging markets like Nigeria to tech hubs like the U.S., further de-risks its business model. Major investors, including BlackRock, JPMorgan, and Microsoft, have already backed Consensys, signaling that way confidence in its long-term potential.
The Road Ahead
Founded by Ethereum co-founder Joseph Lubin, Consensys has raised $1 billion to date, with a reported valuation target of $7 billion for a potential IPO. While the timeline for going public remains uncertain, the company’s focus on Ethereum’s ecosystem positions it to benefit from Web3’s expansion. Challenges, such as regulatory scrutiny and competition from wallets like Trust Wallet or blockchains like Solana, exist, but Consensys’s entrenched role in Ethereum gives it a competitive edge.
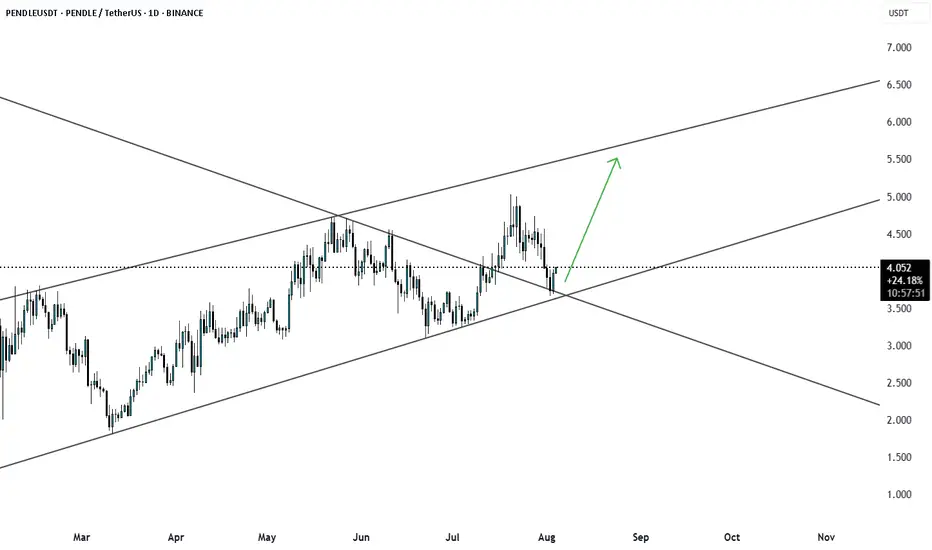
PENDLEUSDT at Channel SupportPENDLEUSDT is currently trading within an upward channel. Yesterday, the price pulled back to the channel support and formed a bullish engulfing candle, indicating potential continuation of the uptrend. A move toward the channel resistance appears likely.
A long trade can be considered with a stop-loss at 3.5.
Ethereum is approaching the key level ┆ HolderStatKUCOIN:ETHUSDT is consolidating between $3,368 and $3,866 following a strong impulse move. Sideways range formation and trendline support hint at bullish continuation. Breakout above $3,866 may resume the upward trend toward new highs.

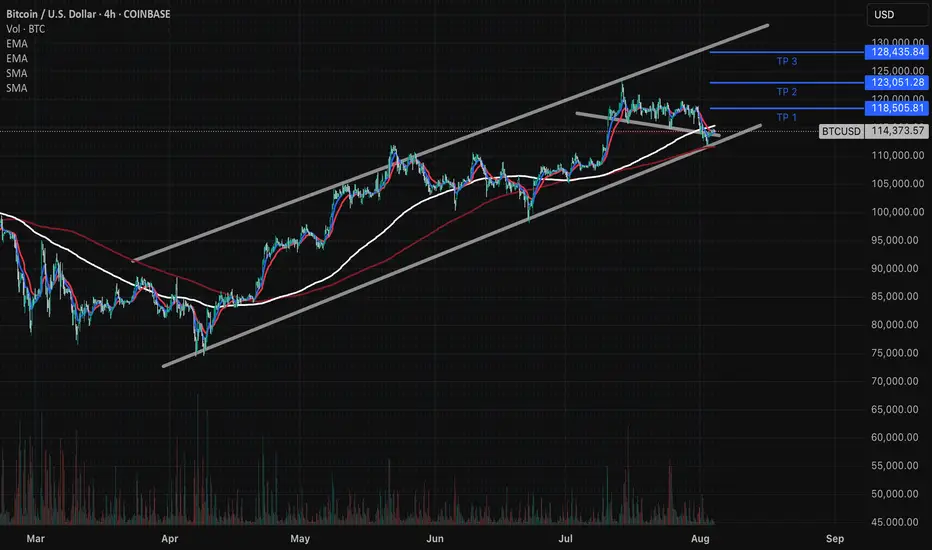
Bitcoin Ascending Channel Analysis - WAIT FOR CONFIRMATIONS!Bitcoin continues its methodical progression within a well-defined ascending channel, currently trading at $114,393. The price action demonstrates textbook technical behavior, respecting both the upper and lower channel boundaries with precision.
Key Technical Observations
Channel Dynamics : The ascending channel pattern remains intact since March lows, with multiple successful tests of support around the lower trendline. Current positioning near channel midpoint suggests balanced momentum.
Moving Average Confluence : Price is trading above all major EMAs (114,262 and 114,521), indicating sustained bullish sentiment. The tight clustering of these averages suggests consolidation before the next directional move.
Volume Profile : Recent volume patterns show institutional accumulation during pullbacks, with lighter volume on advances - typical of healthy uptrends in mature phases.
Strategic Levels
Immediate Resistance: $116,500-$117,000 zone (upper channel boundary)
Key Support: $110,000-$111,000 (lower channel confluence with EMA cluster)
Breakout Target: $125,000+ (measured move projection)
Risk Assessment
The current technical setup presents a favorable risk-reward profile for position traders. However, proximity to channel resistance warrants cautious position sizing. A break below $110,000 would invalidate the ascending channel thesis and signal deeper retracement potential toward $105,000.
Probability Matrix :
Channel continuation: 65%
Upside breakout: 25%
Channel breakdown: 10%
Trade Management Framework
For swing positions, consider scaling approaches near channel extremes. Risk management remains paramount - the crypto market's inherent volatility can quickly invalidate technical patterns despite their statistical reliability.
DISCLAIMER: This analysis is for educational and informational purposes only and does not constitute financial advice. Cryptocurrency trading involves substantial risk of loss and is not suitable for all investors. Past performance does not guarantee future results. Always conduct your own research and consider your risk tolerance before making investment decisions. The author may hold positions in the discussed assets.
#ZIL/USDT#ZIL
The price is moving within an ascending channel on the 1-hour frame, adhering well to it, and is poised to break it strongly upwards and retest it.
We have support from the lower boundary of the ascending channel, at 0.01020.
We have a downtrend on the RSI indicator that is about to break and retest, supporting the upward move.
There is a key support area (in green) at 0.01000, which represents a strong basis for the upward move.
Don't forget one simple thing: ease and capital.
When you reach the first target, save some money and then change your stop-loss order to an entry order.
For inquiries, please leave a comment.
We have a trend of stability above the Moving Average 100.
Entry price: 0.01086
First target: 0.01107
Second target: 0.01137
Third target: 0.01175
Don't forget one simple thing: ease and capital.
When you reach the first target, save some money and then change your stop-loss order to an entry order.
For inquiries, please leave a comment.
Thank you.

ADAUSDT to touch 0.7800COINBASE:ADAUSDT Long trade, with my back testing of this strategy, ADAUSDT need to touch 0.7800
This is good trade, don't overload your risk like Greedy, be disciplined trader.
Use proper risk management
Looks like good trade.
Lets monitor.
Use proper risk management.
Disclaimer: only idea, not advice

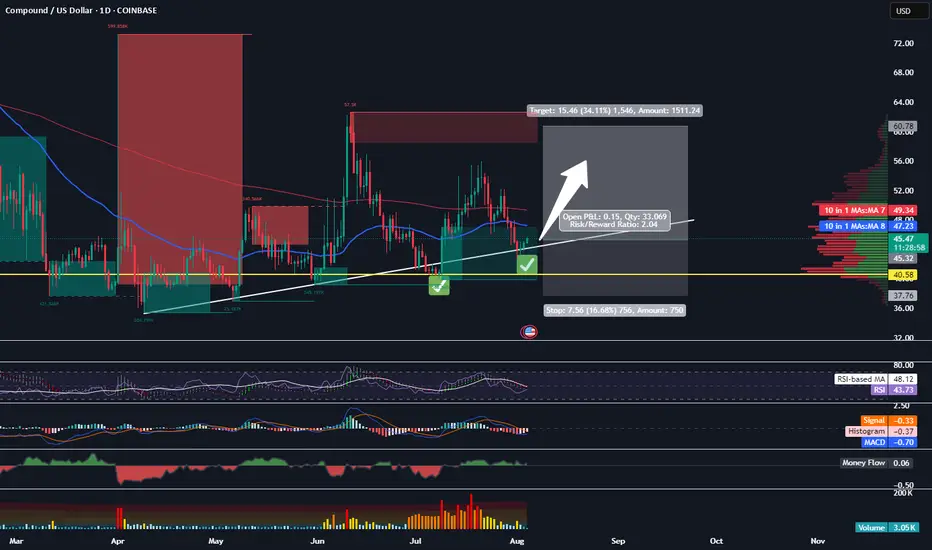
Buying COMP HereMorning Trading Fam,
After a several-week pause, my indicator is starting to light up with BUY signals again on a few alts. You may have noticed the update I gave on my TOTAL chart post. Price has come down to touch that 50-day EMA as expected. There was one more drop possibility (see post), however, I am taking my chance here, being a little more aggressive, and admittedly entering earlier than the crowd. I don't want to miss the run that I expect to come soon.
I received a BUY on FARTCOIN earlier and doubled up once again. Shortly thereafter, I received a signal on COMP here. We look to arrive on good support and are inside a beautiful block of liquidity. That is exactly where I received the signal to BUY, which I was hoping for. I'm jumping on this. Target will be around $60 with my SL set for $37.75 for a 1:2 rrr.
✌️Stew
#ADA/USDT Trading Strategy ( ADAUSDT ) Buy Trade Setup.#ADA
The price is moving within an ascending channel on the 1-hour frame, adhering well to it, and is on track to break it strongly upwards and retest it.
We have support from the lower boundary of the ascending channel, at 0.6712.
We have a downtrend on the RSI indicator that is about to break and retest, supporting the upside.
There is a major support area in green at 0.6736, which represents a strong basis for the upside.
Don't forget a simple thing: ease and capital.
When you reach the first target, save some money and then change your stop-loss order to an entry order.
For inquiries, please leave a comment.
We have a trend to hold above the 100 Moving Average.
Entry price: 0.7395.
First target: 0.7634.
Second target: 0.7943.
Third target: 0.8324.
Don't forget a simple thing: ease and capital.
When you reach the first target, save some money and then change your stop-loss order to an entry order.
For inquiries, please leave a comment.
Thank you.

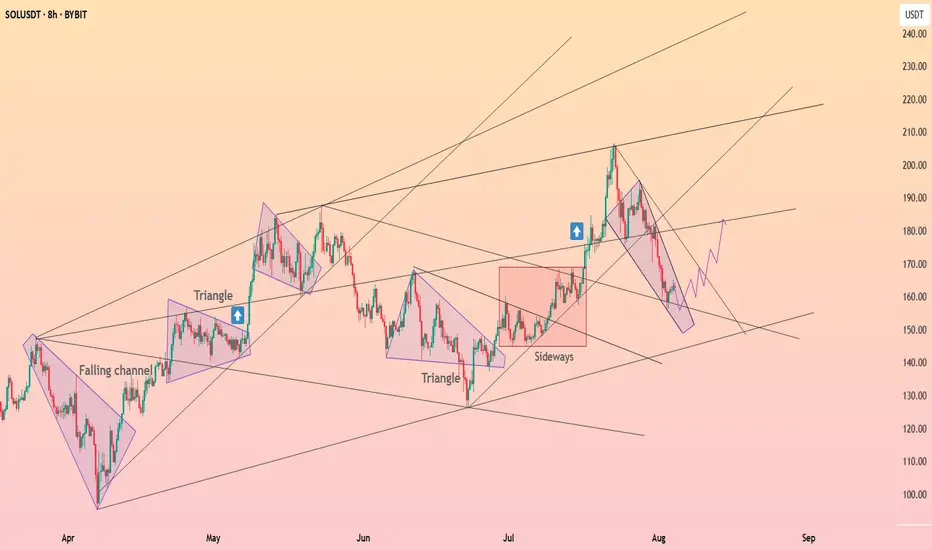
Solana is forming the falling wedge ┆ HolderStatBYBIT:SOLUSDT is moving within a falling channel after the recent drop from $200. Previous triangle breakouts led to rallies, and the current setup resembles earlier accumulation zones. A break above the channel could lead to $180 upside.
Binance coin fixed above the $730 ┆ HolderStatOKX:BNBUSDT is testing ascending trendline support near $740 following a corrective move. The structure is still bullish with earlier breakouts from triangles and sideways zones playing out successfully. If $740 holds, a retest of $800 could unfold quickly.
