Binance coin fixed above the $730 ┆ HolderStatOKX:BNBUSDT is testing ascending trendline support near $740 following a corrective move. The structure is still bullish with earlier breakouts from triangles and sideways zones playing out successfully. If $740 holds, a retest of $800 could unfold quickly.
Crypto market

BNB Price Is Only 13% From Its ATH, This Is When I Could Happen
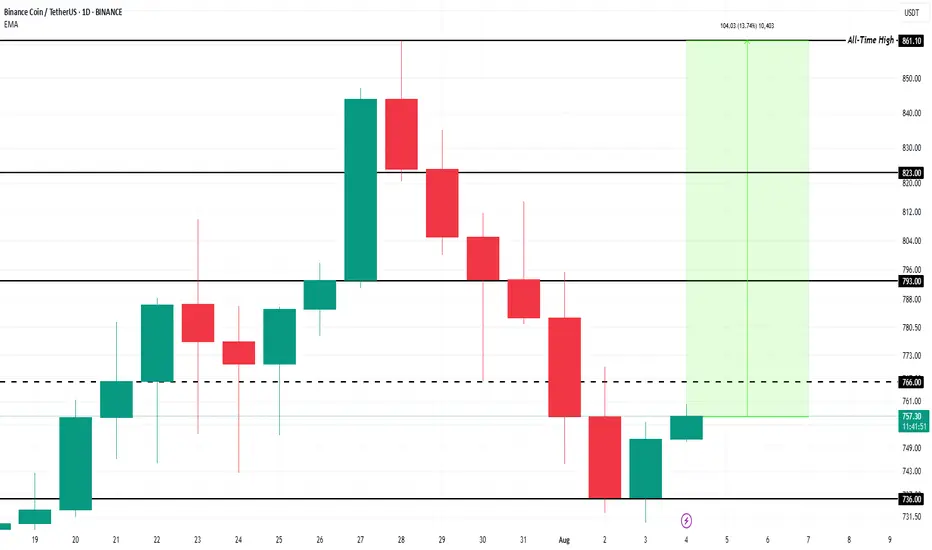
BINANCE:BNBUSDT formed a new all-time high (ATH) in late July, reaching $861 , but has since declined to $736. Despite this setback, bullish market signals suggest that BNB is showing signs of recovery, currently trading at $757. The altcoin remains within reach of previous highs if it maintains momentum and could make it before the end of the week.
Currently, BNB stands 13.7% below its ATH of $816 . If BINANCE:BNBUSDT can break through key resistance levels at $793 and $823, it is likely to approach the ATH again. Securing the $766 support level will be crucial for sustaining upward momentum and achieving further gains in the near term.
However, if BNB fails to hold the $766 level , it could experience further downside. A drop below this support could push BINANCE:BNBUSDT back down to $736 or even lower. Such a move would invalidate the current bullish outlook and suggest a potential bearish reversal.
Stellar (XLM) Shoot Up 11%, Aims To Cross This Barrier
BINANCE:XLMUSDT price has increased by 11% over the last 24 hours , positioning it among the top-performing altcoins. Trading at $0.4077 , the altcoin remains under the resistance of $0.4245. This indicates potential for a breakout if broader market conditions stay favorable and support the bullish trend.
The 50-day exponential moving average (EMA) provides strong support, signaling that the broader market momentum is bullish. This support could propel BINANCE:XLMUSDT towards $0.4450 , with further gains potentially pushing it to $0.4701, confirming the continuation of its positive trajectory in the market if conditions remain favorable.
However, if market conditions worsen , especially with the upcoming August 7 announcements, XLM might fail to breach $0.4245 . In this case, the price could fall to $0.3597 , and losing this support would invalidate the bullish outlook for BINANCE:XLMUSDT , signaling potential downside risks in the coming days.

Hyperliquid held the support at $36 ┆ HolderStatOKX:HYPEUSDT.P has pulled back to a critical support zone near $36.00 while staying inside a falling channel. Previous triangle and sideways zones preceded major breakouts, and the current setup could be a repeat. A breakout above $40.00 would shift structure bullish again.

Btc analysis by majidbabaeiasl #Bitcoin #Btc wave c You are responsible for the content, be careful. Btc short
...50/000 or 62000 dollar

04/08/25 Weekly OutlookLast weeks high: $119,809.82
Last weeks low: $111,917.76
Midpoint: $115,863.79
First net outflow for BTC in seven weeks (-$643m) following the FOMC data release and also month end. Yet again no change by the FED but the chances of Septembers FOMC giving us a rate cut has drastically increased, currently at a 78.5% chance of a 25Bps cut.
Month end usually gives us a pullback/sell-off as larger institutions window dress which often includes de-risking somewhat. We saw this last Thursday combined with the weekends typical lower volume has resulted in quite a significant correction for BTC. Altcoins have down the same as many assets reject from HTF resistance areas, the correction has been on the cards and isn't too worrying on the face of it.
What I would say is August seasonality is generally not a bullish month and so expecting price to rebound and extend the rally would go against historical trends. I could see more of a ranging environment taking place for several weeks before any next leg up is possible.
This week I would like to see where altcoins find support and establish a trading range where some rotational setups tend to present themselves.

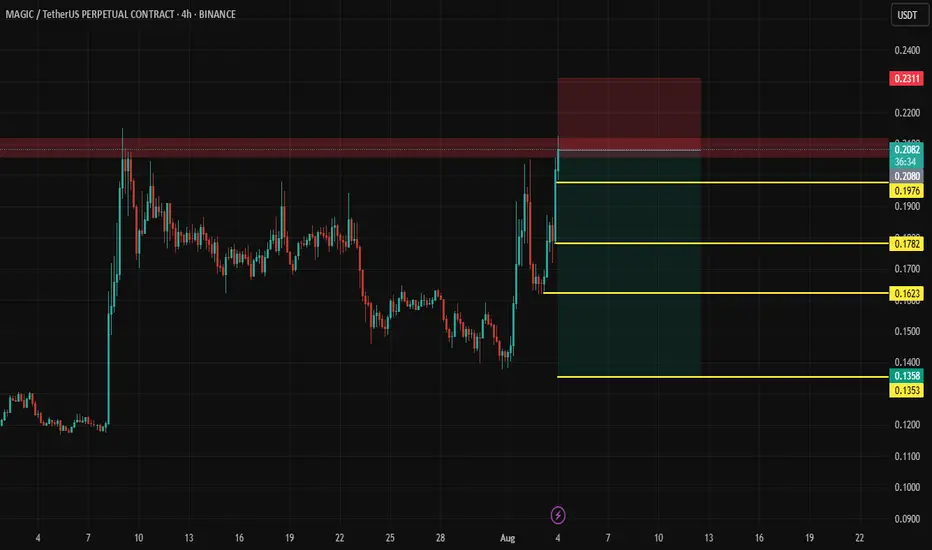
magic short Long upper wicks (like inverted hammers or shooting stars)
Multiple candles failing to close above $0.21–0.215
Bearish volume spike with price stalling = aggressive sellers
Low volume stall = buyers exhausted
Dropping from above 70
Bearish divergence vs price
You can consider a short with a tight stop just above $0.215–0.22
Targets: $0.1980 → $0.1880 → $0.1780
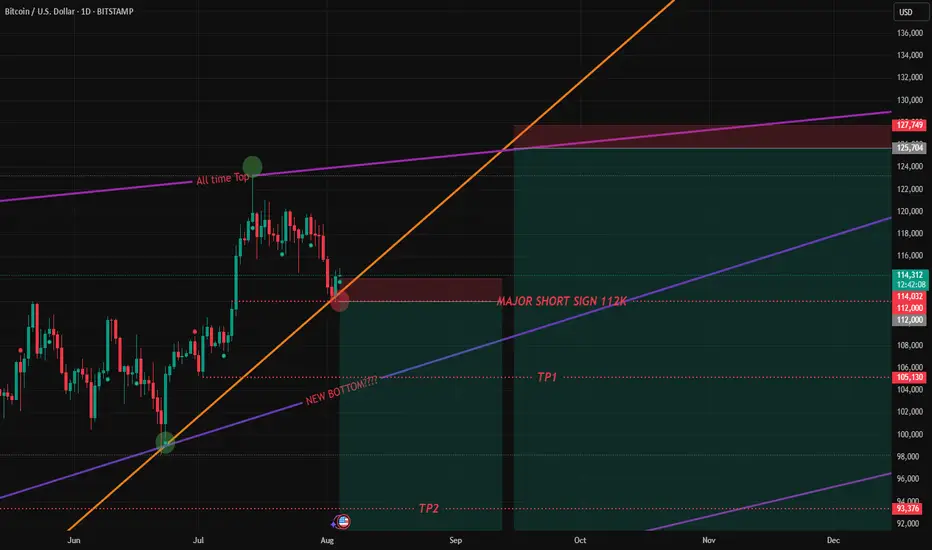
BTC over viewOn BTC 1D chart, we can easily see things started when WW3 news related hovering around. Shows on chart is the most likely SHORT scenario with all major marks. If Btc keep pumping up to 116k, I'll wait it until 125k (at the All time Top mark) to hit another Short on the list.
FARTCOIN | Out of SteamFARTCOIN appears to be running out of steam after its impressive rally from the March lows. The chart shows a clear breakdown from the ascending trendline support that had been holding since early 2025.
Key Technical Signals:
Price has broken below the major ascending trendline
RSI shows declining momentum, failing to maintain bullish territory
Recent price action suggests exhaustion after the parabolic move
Bearish Setup:
A potential decline toward the green support zone around $0.40-$0.50. This represents the previous consolidation area that could act as strong support.
Risk Considerations:
Meme coins can be highly volatile and unpredictable
Any sudden narrative shift could invalidate the bearish thesis
Stop loss above the broken trendline would be prudent

GUNUSDT.P LONGThe setup has been marked.. i will suggest to buy it and hold. It might explode.
The price broke out with strong momentum to upside.
Always book 50% profit at 50% level and bring s.l to the entry.
Keep following and support me please to keep posting like that.
Thanks

#APT/USDT Buyers Need To Establish Support Zone#APT
The price is moving within an ascending channel on the 1-hour frame, adhering well to it, and is on its way to break strongly upwards and retest it.
We have support from the lower boundary of the ascending channel, at 4.10.
We have a downtrend on the RSI indicator that is about to break and retest, supporting the upside.
There is a major support area in green at 4.05, which represents a strong basis for the upside.
Don't forget a simple thing: ease and capital.
When you reach the first target, save some money and then change your stop-loss order to an entry order.
For inquiries, please leave a comment.
We have a trend to hold above the Moving Average 100.
Entry price: 4.25.
First target: 4.35.
Second target: 4.46.
Third target: 4.05.
Don't forget a simple thing: ease and capital.
When you reach the first target, save some money and then change your stop-loss order to an entry order.
For inquiries, please leave a comment.
Thank you.

EPIC Battles Key Trendline After Dual Structure Shift⏱️ On the 2H chart, CSE:EPIC recently broke out of a descending channel ✅—a bullish signal in the short term.
However, momentum stalled right at the lower boundary of a larger symmetrical triangle ❌, where price is now facing rejection.
This zone is pivotal — reclaiming the triangle could spark another leg up, while continued rejection might drag price lower once again.
👀 A tight setup with conflicting signals — watching this one closely.
Will the bulls regain control or does downside pressure take over?
Not financial advice. BINANCE:EPICUSDT

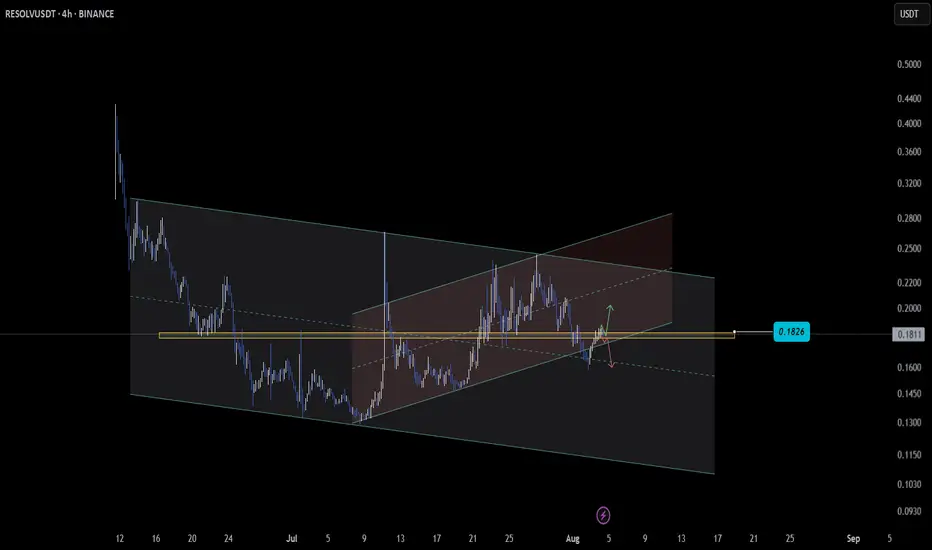
RESOLV Testing Channel Resistance With Breakout Potential📉 $RESOLV is trading inside a descending channel on the 4H chart — a structure that often builds toward breakout pressure over time.
The immediate resistance sits around 0.1850 🔍 — a key level to watch. A strong move and hold above this zone could ignite a bullish leg higher 🚀
However, failure to break through may invite more downside pressure ⚠️
👀 This setup is loaded with potential — breakout or rejection could come fast.
Are you tracking this structure?
Not financial advice.
BINANCE:RESOLVUSDT
Testing $3,500 Support, Rebound Ahead?Instrument: ETHUSD
Timeframe: Daily
Date: August 4, 2025
Analysis:
ETH fell 7.9% to $3,500 from $3,800, testing support after failing to break its high. The hawkish FOMC and rising BTC.D (62%) pressured altcoins. I entered the dip on $3,500, as shared on X and my previous report
Chart Setup:
Support: $3,500
Resistance: $3,600, $3,800

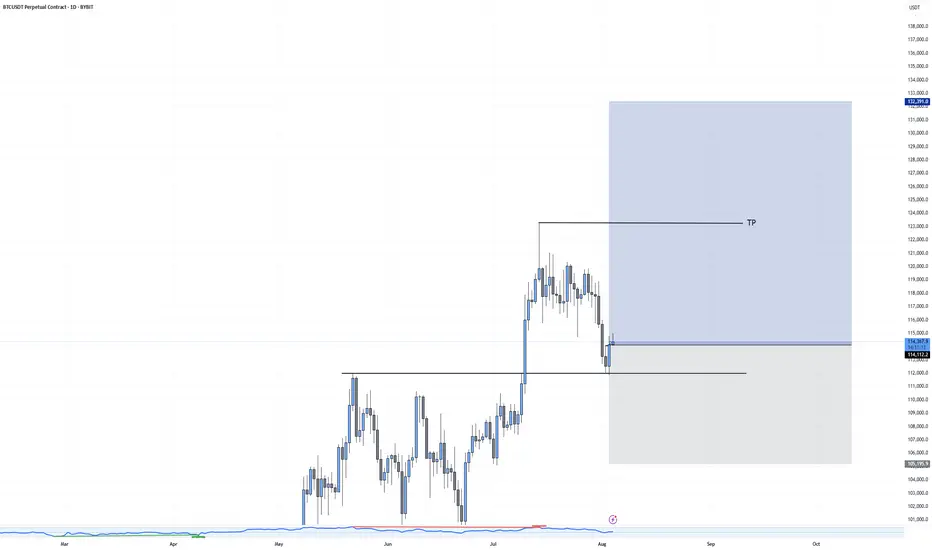
BTCUSD: Consolidating at $112K, Watching $120KInstrument: BTCUSD
Timeframe: Daily
Date: August 4, 2025
Analysis:
BTC dropped to $112,000, down 5.1% from $118,000, holding above the $112,000 support. The hawkish FOMC triggered this pullback, but $112K is a key level. I scaled in on the dip as seen in my previous BTC idea and X
Chart Setup:
Support: $112,000, $100,000
Resistance: $115,000, $120,000

Bullish engulfing flex on the weeklyWhat’s up Candle Fam,
Ethereum just pulled a bullish engulfing flex on the weekly — and it’s not here to play. The recent correction shook out late longs, but structure remains beautifully intact.
🎯 LONG Setup
📍 Entry: $3,430–$3,340
🩸 Stop Loss: $3,190
🎯 Targets:
TP1: $3,750
TP2: $3,980
TP3: $4,200
📊 Strategy: Weekly OB + FVG Reclaim
– Weekly: Clean engulfing candle reclaiming the $3.2k–3.4k order block
– Daily: Structure holding higher lows — bullish market structure intact
– LTF: Watch for CHoCH + volume spike around $3.4k (12H/1H footprint shows absorption)
🧠 Footprint Flow:
– Aggressive shorts caught below $3.4k
– Buyers stepping in with clear delta divergence
– POC shifting higher = reclaim attempt underway
⚠️ Invalidation below $3,200 — breaks HTF structure
⛓️ Stick to low leverage or spot to manage broader macro risks.
No hopium, just structure.
Stick to the craft. Trade the plan.
Candle Craft | Signal. Structure. Execution.

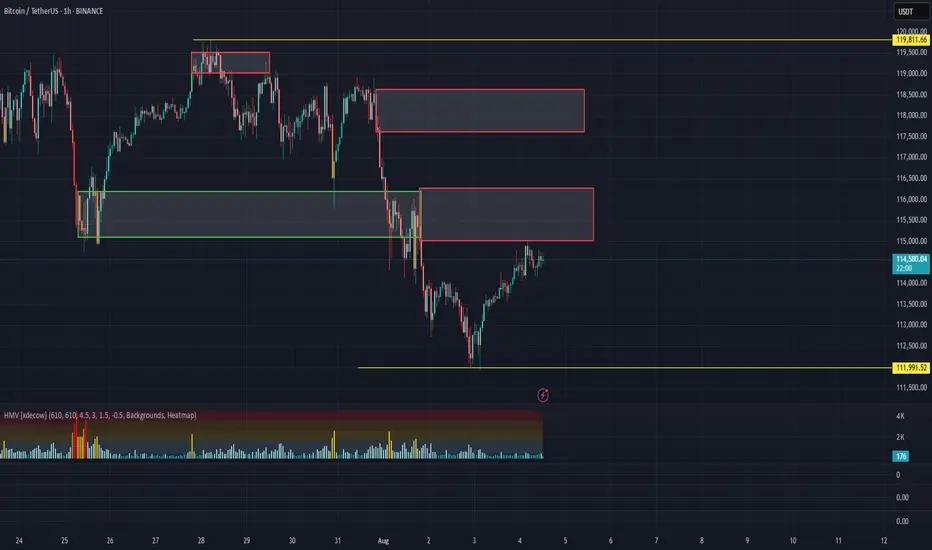
Analytics: Market Outlook and Predictions
📈 WHAT HAPPENED?
Last week, US President Donald Trump once again "shook up" the financial markets.
The report published by the White House was received positively and contributed to the recovery of the Bitcoin price. But soon after, new import duties were introduced, which changed the short-term trend of the first cryptocurrency to a downward one. Unfortunately, no one is immune to FUD.
The local minimum was recorded at $112,000, after which the price rebounded slightly, but didn’t reach the key zone of $110,000-$107,000 (accumulated volumes).
💼 WHAT WILL HAPPEN: OR NOT?
Currently, buyer activity remains weak, with significant volumes concentrated above the current price, and no active demand at the local lows. Another wave of sales is likely from the $115,000-$116,300 zone to the formed low of $112,000.
On the other hand, wave analysis shows the weakening of sellers. The market has already absorbed the last wave of sales, and there was a break on the hourly timeframe. With the growth of buying volumes, a rebound to the nearest volume resistance is possible. However, we’ll most likely not be able to do without strong sales, and we’re highly likely to see Bitcoin at $110,000.
Buy Zones:
$110,000–$107,000 (accumulated volume)
Sell Zones:
$117,600–$118,600 (accumulated volume)
$115,000–$116,300 (mirror volume zone)
📰 IMPORTANT DATES
Macroeconomic events that we’re following this week:
• Tuesday, August 5, 13:45 (UTC) — publication of the business activity index (PMI) in the US services sector for July;
• Tuesday, August 5, 14:00 (UTC) — publication of the US Non-Manufacturing Purchasing Managers' Index (ISM) for July;
• Thursday, August 7, 11:00 (UTC) — announcement of the UK interest rate decision for August;
• August 7, Thursday, 11:30 (UTC) — publication of the Bank of England's letter on UK inflation;
• August 7, Thursday, 12:30 (UTC) — publication of the number of initial jobless claims in the United States for August.
*This post is not a financial recommendation. Make decisions based on your own experience.
#analytics
SUI | Sui Network - Swing Long Idea - Altcoin
📊 Market Sentiment
Market sentiment remains bullish, supported by expectations of a 0.25% rate cut at the upcoming FOMC meeting. The weakening USD and rising risk appetite across global markets are favoring crypto assets in particular.
📈 Technical Analysis
SUI recently gained bullish momentum, largely following Bitcoin's strength.
We’re now seeing a healthy retracement, which is expected after a strong move.
The break of the LTF bullish trendline suggests potential for a deeper pullback toward HTF confluence zones.
📌 Game Plan
I'm eyeing the HTF demand zone around $3.06, which aligns with the 0.5 Fibonacci retracement—a key discount zone.
Just below this, we also have a higher time frame bullish trendline, which could offer dynamic support.
These overlapping levels provide a strong confluence for a swing long idea.
🎯 Setup Trigger
I’ll wait for a 4H bullish break of structure and the formation of an LTF demand zone before entering.
📋 Trade Management
Stoploss: Below 4H demand swing low
Target: Up to $4.44
I’ll trail my stop to lock in profits aggressively along the way.
💬 Like, follow, and comment if this breakdown supports your trading!
More setups and market insights coming soon — stay connected!

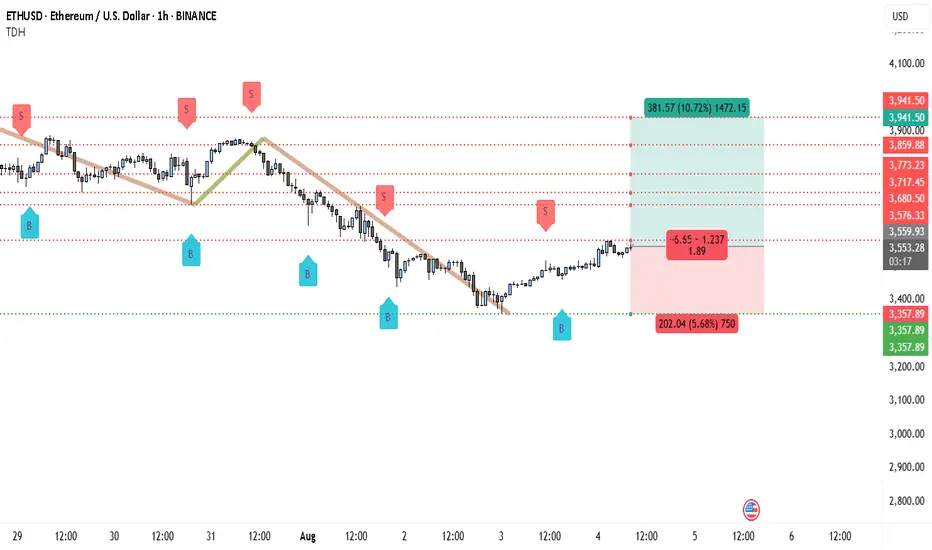
Ethereum’s 1H Chart Screams Breakout — Next Stop $3,941?Ethereum has recently broken above a short-term descending trendline that had been guiding the market lower over the past sessions. This breakout occurred after price formed a strong base around the $3,357 support zone, indicating that sellers were losing momentum. The “B” buy signals printed near these lows further strengthen the bullish outlook.
The immediate resistance lies around $3,559, which is the level price is currently approaching. If buyers can maintain momentum above this area, the next upside targets are $3,576, $3,680, $3,717, and $3,773. The major resistance and projected take-profit area is near $3,941.
From a structural standpoint, the shift from lower lows to higher lows suggests that the short-term trend may be reversing in favor of buyers. This aligns with the increased buying volume observed after the breakout, hinting at potential follow-through in the next London or New York session.
Trading Setup
• Entry: Around $3,553 after breakout confirmation
• Stop-loss: Below $3,357
• Take-profit 1: $3,680
• Take-profit 2: $3,773
• Final Target: $3,941
• Risk-Reward: Approximately 1.89:1
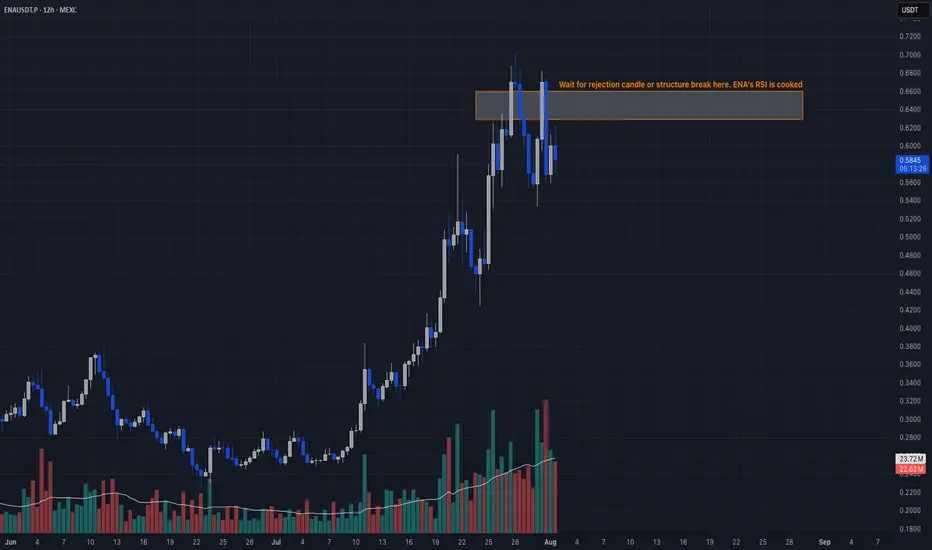
Overbought + Reversal Signal📣 Yo legends!
ENA got jacked on steroids lately, exploding in TVL and open interest like it’s headed to $10. But RSI at 82? Declining OI? That’s not strength, that’s a leverage hangover waiting to happen. Time to fade the party. 🥴
🔥 TRADE SETUP
Bias: Short
Strategy: Overbought + Reversal Signal
Entry: $0.63 – $0.66
SL: $0.71
TPs: $0.5446, $0.50, $0.42
Why?
– RSI 82 on daily = overheated
– Open interest dropping fast after topping $1.35B
– Funding collapsing → longs unwinding
– HTF sweep + LTF CHoCH confirmed.
Candle Craft | Signal. Structure. Execution.
Bitcoin hits $135K before a 33% correction.Firstly... I'd like to comment we have officially just had our first daily close above "Minor Resistance" trend-line I have put in, additionally... a daily close above the 50SMA.
All trend-lines have flipped into bullish posture as well as my indicators and SMA / EMA ribbons!
📈 Price & Fibonacci Levels
Holding above key support: $104,751 (0.888 Fib)
Eyeing 1.618 Fib extension target: $139,094
Former resistance from 2021 has flipped into support, confirming breakout structure
🌊 M2 Global Liquidity Index = The Engine Behind BTC
BTC price is highly correlated with the M2 Global Liquidity Index (now at 98.91) and has been following since JAN 2024.
What is M2? It's a measure of global money supply growth. Rising M2 = more liquidity in the system = bullish for risk assets like BTC
This macro liquidity uptrend continues to support the Bitcoin rally
📉 RSI Reset, Momentum Reloading
RSI (14) is at 47.82, a neutral level historically followed by bullish continuation in uptrends
Momentum is resetting, not breaking — the trend is still intact
🧵 SMA Ribbon & Golden Cross Setup
Multi-timeframe SMA ribbon (10–500) fully supports a bullish trend
A Golden Cross (SMA 50 > 200) is already confirmed
Historically, the last 4 Golden Crosses (after a Death Cross) led to an average gain of 89% into the next local ATH
This points directly toward a $135K–$145K scenario
🌑 Lunar Timing (Historically speaking)
Most Bitcoin all-time highs occurred within ±5 days of a new moon
The next critical date: September 7, 2025 – Strong Lunar Eclipse
Historically, lunar eclipses have resulted in 30% average corrections
⚠️ This is the second eclipse in a 4-eclipse cycle — potentially stronger impact (maybe 40%, 80K territory)
Expected dip target: $90K, aligning with macro support and Fibonacci confluence
😐 Sentiment Check: Fear & Greed Index
Current reading: 52 (Neutral)
Market is not overheated
Still plenty of room before peak greed or blow-off top behavior
🔮 Final Take:
All indicators — liquidity, momentum, cycle timing, and historical averages — suggest Bitcoin is not done yet. After a possible eclipse-driven correction into the $90K region, we likely enter the final euphoric push of this macro leg toward $135K–$145K.
📅 Key Dates:
23rd August new moon top out $135K (please consider a 5 day window 18th -28th August)
Next New Moon & Lunar Eclipse: September 7, 2025
Watch for volatility, alt rotation, BTC.D
💬 Agree or disagree? Drop a comment.
🔔 Follow for lunar/RSI/fib cycle updates!
Disclaimer:
The content provided in this post is for informational and educational purposes only and should not be considered financial or investment advice. I am not a financial advisor, and this is not a recommendation to buy, sell, or hold any cryptocurrency, asset, or security. Always do your own research and consult with a qualified financial advisor before making any investment decisions. Trading and investing involve risk, and past performance does not guarantee future results.

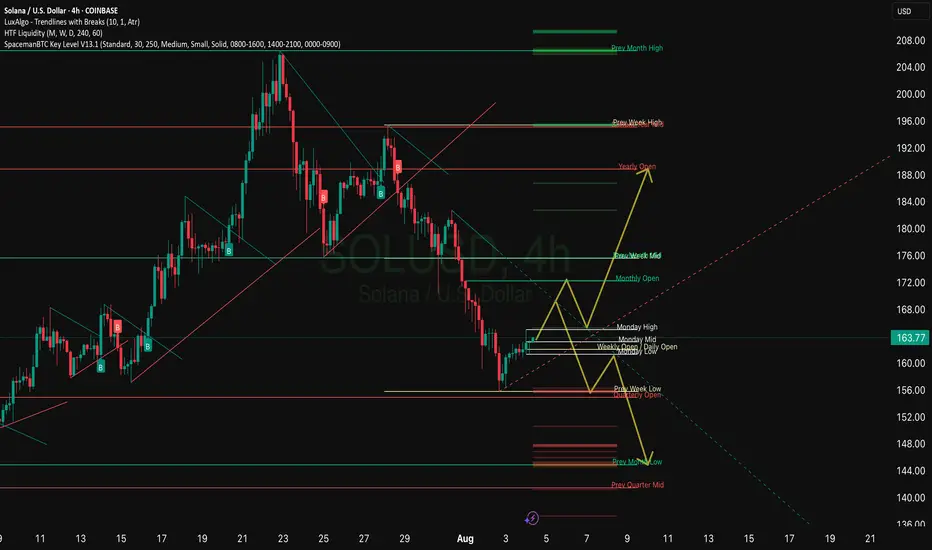
Solana definition of movementSOL is in a squeeze phase: the price is holding above $163, but meets resistance around $183-186. Indicators show neutral, slightly weak momentum. A break above $186 with increasing volumes will open up potential at $190+; a break below $178 will lead to a deeper correction to $171-170. Until then, it is worth watching the 20-d EMA hold and reactions to it.