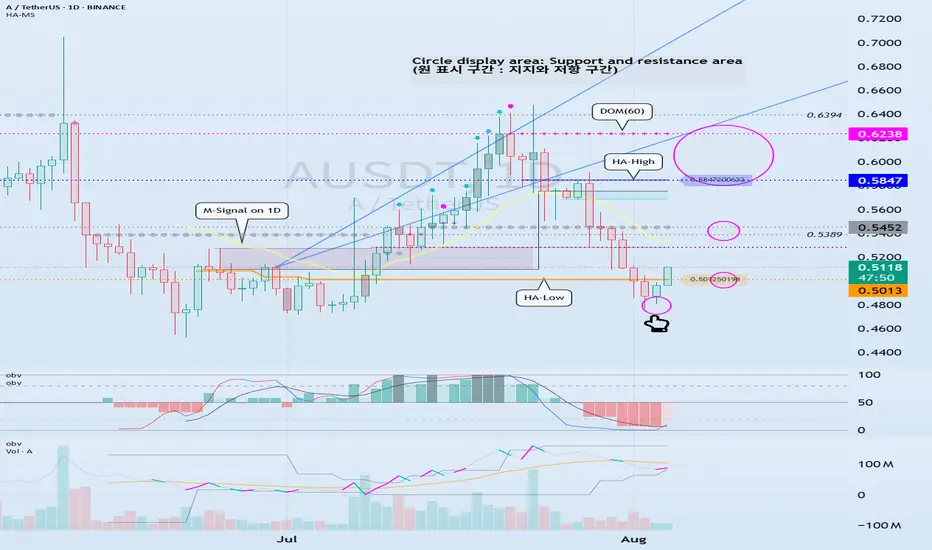
Check if it can rise to around 0.5452
Hello, traders. Nice to meet you.
If you "Follow" us, you'll always get the latest information quickly.
Have a great day.
-------------------------------------
(AUSDT 1D chart)
It hasn't been long since EOS changed to A.
Nevertheless, the formation of the HA-Low and HA-High indicators suggests that a wave has begun to form.
However, since the DOM (-60) indicator hasn't yet formed, if it fails to find support from the HA-Low indicator, further declines could occur, so we need to consider countermeasures.
With the HA-Low and HA-High indicators in place, we can now trade in line with our basic trading strategy.
In other words, this refers to a trade where you buy in the DOM(-60) ~ HA-Low range and sell in the HA-High ~ DOM(60) range.
This ultimately refers to a trading strategy within a box range.
Trend trading strategies proceed by either rising in the HA-High ~ DOM(60) range or falling in the DOM(-60) ~ HA-Low range.
In other words, a rise in the HA-High ~ DOM(60) range is likely to lead to a stepwise uptrend, while a decline in the DOM(-60) ~ HA-Low range is likely to lead to a stepwise downtrend.
In this sense, key support and resistance levels are the 0.5013 point and the 0.5847-0.6238 range.
Currently, the price is rising above 0.5013, so if support is found around 0.5013, it would be a good time to buy.
The first sell zone is around 0.5452, where a volume profile zone has formed.
If the price rises above this level and maintains, it is expected to continue upward, likely reaching the 0.5847-0.6238 range.
-
The low trendline has not yet been formed.
The low of the candlestick indicated by the finger is the first selection point for drawing the low trendline.
Since a high trendline has been formed, we should also examine whether the price can rise along the high trendline.
-
Thank you for reading to the end.
I wish you successful trading.
--------------------------------------------------
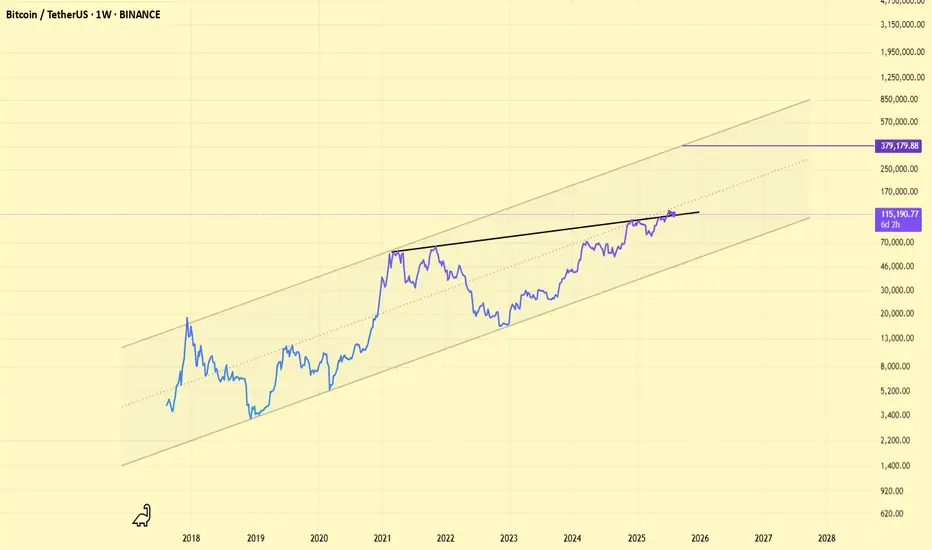
- This is an explanation of the big picture.
(3-year bull market, 1-year bear market pattern)
I will explain in more detail when the bear market begins.
------------------------------------------------------
Crypto market
ETHEREUM SEASON LOADING!Ethereum appears to be literally following bitcoin's pattern ahead of its 2021 bull run

GRT. USDTTake Graph seriously.
This project is the backbone of data indexing in the Web 3 world.
Although Graph has a market cap of $10.4 billion, its current price is only $0.093.
Graph organizes complex data for both Aave and Uniswap.
So it will be very easy for Graph to break through the channel and hit $0.11.
" The next targets of the graph will be determined after crossing the price of $0.12 "

BTC/USDT.dIt looks like BTC is establishing support above this trendline if you study the line chart on a daily timeframe. A bounce here could mean serious growth... a fake out to go lower.. can be catastrophic. So far we are solid on track to go higher. Lets see
Ethereum - Finally new all time highs!🔬Ethereum ( CRYPTO:ETHUSD ) will break out now:
🔎Analysis summary:
For more than four years, Ethereum has overall been moving sideways. However now Ethereum is once again retesting previous all time highs and preparing a bullish breakout. Multiple retests are generally considered bullish so the breakout is very likely to happen any time soon.
📝Levels to watch:
$4.000
🙏🏻#LONGTERMVISION
SwingTraderPhil

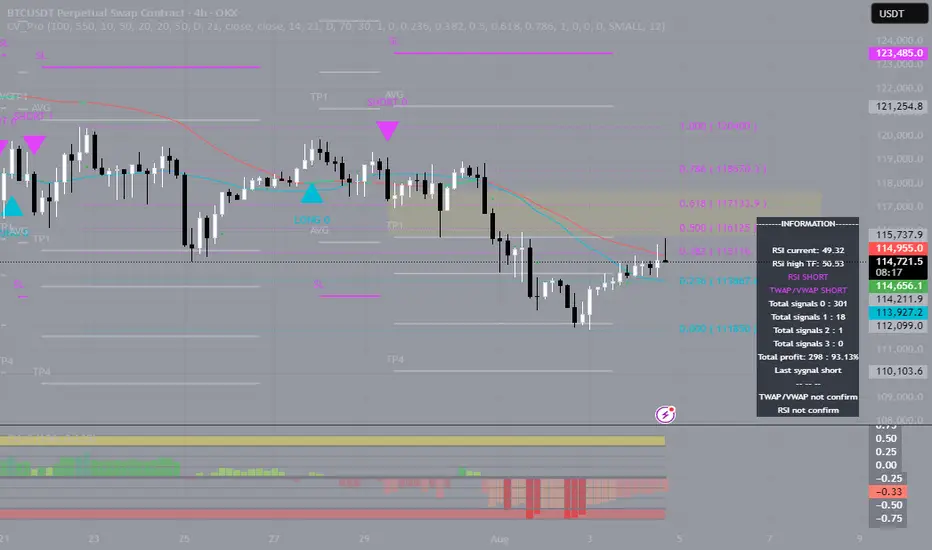
Bitcoin Turned Down — It Was Only a Matter of TimeBitcoin Turned Down — It Was Only a Matter of Time
When the price gets stuck at the top and can’t move higher, it’s always a reason to stop and think. BTC got stuck around $118,000, started to form long upper wicks, and the volume started to decline. All of this pointed to a classic case of fading bullish momentum.
At this point, my indicator gave several key signals: weakening buying power, a change in momentum, and the formation of a potential reversal zone. I refrained from opening long positions — and this decision turned out to be the right one. The price went down and is now trading around $114,000.
Next, I will wait for a retest of the imbalance zone and work from the reaction from this zone.
It is important to understand: this correction is not something unusual. This is a technically sound phase after a strong rally. The market gets rid of speculative positions, gets rid of excessive leverage and prepares for either a reset or a deeper correction.
The market has weakened predictably, and that's actually a good thing. When the structure becomes clear, we can trade with a plan rather than just following our gut instinct.
TaousdtThe volume profile on this chart along with other macro factors suggest we extend to the 1.618 at some point
(Probably q4)
~171%
There would be potential for price acceptance at these levels aswell and eventual continuation given the fundamentals of this one.. could easily be a multi cycle coin...


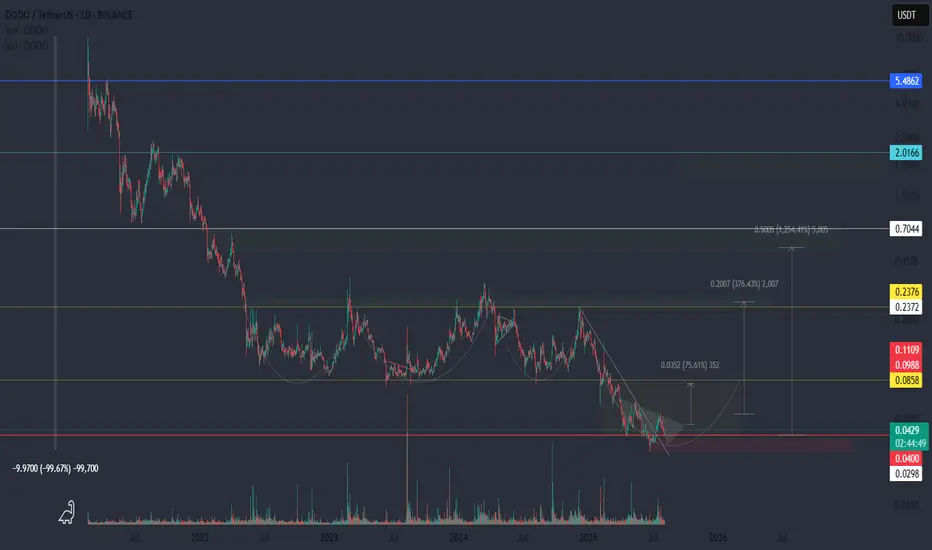
High-Risk Crypto Bet – DODO AnalysisDODO is a decentralized finance (#DeFi) protocol that has seen a brutal 99% drawdown from its peak — making it one of the most devalued tokens in the market.
📉 Structure:
The chart shows a “channel within a channel” structure — a signal of prolonged capitulation. DODO is currently in a range where most have written it off. But history shows that such zones often precede major reversals.
🌀 Formation:
A potential inverse head and shoulders pattern is developing — a classic reversal setup. The minimal target from this structure is around $0.08.
📈 Early Signal:
Price has already bounced +75% from the bottom — a possible sign of early accumulation.
☕ Bigger Picture:
This zone might be forming the right side of a long-term cup pattern — hinting at a potential macro reversal if the market supports.
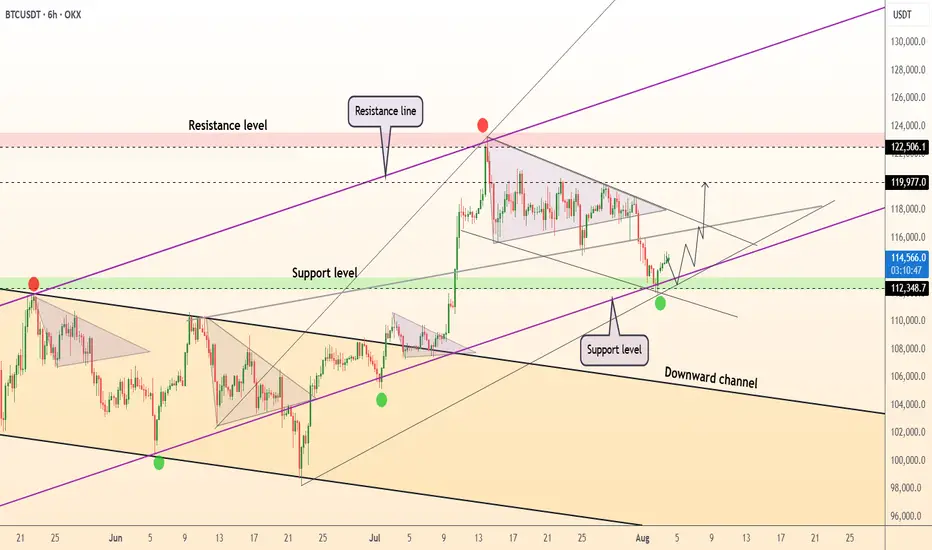
DeGRAM | BTCUSD reached the support level📊 Technical Analysis
● BTCUSD has bounced from confluence support at 112.3k–114.8k, reclaiming the ascending support line and validating the lower boundary of the rising triangle.
● Price action suggests a bullish continuation setup with targets at 119.9k and extension to the upper resistance near 122.5k–125k.
💡 Fundamental Analysis
● US labor data slowdown and dovish Fed commentary have pulled real yields lower, boosting crypto demand.
● Glassnode reports ongoing whale accumulation and rising stablecoin inflows, signaling positive capital rotation into BTC.
✨ Summary
Long above 114.8k. Targets 119.9k → 122.5k+. Setup invalidated on a break below 112.3k support.
-------------------
Share your opinion in the comments and support the idea with a like. Thanks for your support!
15-minute analysisThe price went up to 3717 and got rejected. It’s currently sitting around the 3666 level with low volume, and for now, the market seems calm.
It’s clear that a significant level has formed here, which looks reliable.
We also have another key level around 3580.
Based on my analysis, I expect the price to react to one of these two levels and then potentially start a move toward the 38,000 mark.

ARB – Critical Support ZonePrice is retesting a major support at $0.363. This level has acted as a strong pivot multiple times in the past, providing both support and resistance. Bulls need to hold this zone to avoid a deeper retrace. Below it, next support is down at $0.264.
Plan:
• Hold above $0.363 – could see a local bounce and retest of $0.44–0.50 resistance
• Lose $0.363 – opens the way for a larger flush down toward $0.26
• No setup for longs if we close below support — would flip bias to short on breakdown

Bitcoin - The cycles are playing out!⚔️Bitcoin ( CRYPTO:BTCUSD ) just repeats another cycle:
🔎Analysis summary:
Following all of the previous all time high breakouts, Bitcoin will now further extend the rally. After some simple calculation, we can see that Bitcoin will rally another +50% in order to reach the overall price target. However there will be volatility along the way so make sure to remain calm.
📝Levels to watch:
$200.000
SwingTraderPhil
SwingTrading.Simplified. | Investing.Simplified. | #LONGTERMVISION

BTC – Still looking heavy below key resistanceDespite a short-term relief bounce after Monday’s drop, BTC remains below the critical 1D MSS + S/R (red box). Structure is weak until this level is reclaimed. Bears remain in control as long as price can’t close above 115.7k.
Plan:
Maintain bearish bias while below the red box — expecting new lows, targeting the green demand/OB cluster around 108.3k.
Flip the red box (close above 115.7k) and the outlook shifts to neutral or bullish.

BITCOIN TRADING IS 100% PROBABILITY,ANY KEY LEVEL IN THIS CHART CAN FAIL,pls manage your risk and build a strong mindset.
bitcoin is showing a bullish drive. If i retest the 123k level again and gets rejected we are selling down ,the structure has given us a clue on 135k and above possible upswing on sentiment ,this level represents the ascending trendline and a supply roof.
#btc #bitcoin #crypto #eth #sol

BTC - THIS IS THE END !?I didn’t want to jump to conclusions, so I waited for the NY open to see how the market would react — and so far, things don’t look bad at all. 🤔
Yeah, that previous-week correction wasn’t fun, but honestly, it’s perfectly healthy price action.
Thanks to that sharp drop, #Bitcoin managed to:
✅ Fully close the CME gap ;
✅ Fill a pretty large FVG ;
✅ Cleanly retest the previous high ;
✅ Perfectly touch the 50-day MA — which has historically sparked solid moves.
Sure, it was unpleasant. Sure, things didn’t go exactly as planned. 🤷♂️
But is this the end? Absolutely not. We haven’t even reached any of the typical panic points yet.
I think on the LTF we’ll dip once more to shake out early longers — then we’ll continue upward. 🐋

is trend bullish or bearish?look at this canal we are in lower low and lower high trend is bearish !!but know i think trend is still bearish why becuase we havnt reach the upper band the canal it must break the upper band
to sure bullish trend is start again its take a time maybe 1 or 2 month but now we are in another Lower low again in 170 price after touch it and reject it maybe market goes down just remmember this post for now i think a long and exit in 170 maybe good .ijust wana trust myself again i wait for its will be happen

XRP 4H – Double Bottom… or Just Another Lower High?
XRP bounced cleanly from major support — the same zone that sparked its last leg up.
This could mark the early stages of a double bottom or just another bear market rally before continuation.
🔹 Previous top = strong supply rejection
🔹 Current support = high-volume bounce zone
🔹 Stoch RSI turning up from oversold
Key confirmation would be:
– Break of $3.15
– Retest + continuation
Otherwise? Another fakeout lower high could trap longs.

ETC 4H Analysis : V-Pattern Breakout , $23M Buy & Key Fib LevelsHey , how's it going? Come over here — Satoshi's got something for you !
⏱ We are analyzing Ethereum Classic (ETC) on the 4-hour timeframe .
👀 After breaking above the $19.1 level, Ethereum Classic started a strong and high-momentum bullish move and reached the $25.28 resistance, where it was rejected and entered a deep correction .
A V-pattern support has now formed, and a breakout of this pattern could serve as a signal for the end of the correction .
🎮 We're observing the key Fibonacci zones , drawn from the breakout level and its pullback area .
The 0 level is considered our support base , while the other Fibonacci levels act as resistances and potential long-entry triggers .
The most important upcoming resistance is at $21.16 , which serves as the main trigger for our long position .
We will now monitor whether ETC forms a higher low before reaching this resistance , or reacts to it and then forms a higher low — both scenarios would be valid setups for a long position .
As for the 0.236 Fibonacci level , it's the nearest support, and a pullback to this zone is also possible .
⚙️ The RSI oscillator previously had a key resistance at 57.78 , which has now been broken to the upside , and RSI is currently holding above this level .
🔼 Volume may increase again tomorrow during the New York session .
Today, in the marked candle , $23 million worth of Ethereum Classic was bought , and this market maker buy helped save ETC from a deeper correction .
🖥 Summary :
The breakout of the V-pattern allowed ETC to push upward and form a higher low .
Once the pullback to the identified Fibonacci zone completes , we can open our long position , or alternatively , set a buy stop at that level with a wider stop-loss to manage risk properly .
💡 Disclaimer :))) .

BTC Long Setup (Post-Liquidation Reclaim)Hey Candle Fam,
The weak hands just got flushed harder than a memecoin rug—perfect. While retail panicked on the dip, smart money was quietly filling bags near $114k. Now it’s our turn to strike with precision.
🔥 BTC Long Setup (Post-Liquidation Reclaim)
🎯 Entry: $114,390–$113,800
🛡️ Stop Loss: $111,900
💰 Targets: $121k / $130k / $140k
📊 Strategy: Liquidity Grab + Weekly Demand Tap
– HTF bias: Still bullish, above key $115k zone
– LTF confluence: Sweep of lows + CHoCH forming on 12H/1H
– Footprint data: Volume absorption + delta flip confirm buyer interest
⚠️ Caution:
Breakdown below $110k would invalidate this setup and likely trigger a strong bearish leg. This is not a “to the moon” YOLO.
Stick to your system, manage risk, and remove emotion.
🧠 Final Note:
We don’t chase dreams—we execute plans.
All the hours we spend studying this game? It’s not for fun. It’s for freedom.
Financial independence is the goal—this is the craft.
Candle Craft | Signal. Structure. Execution.

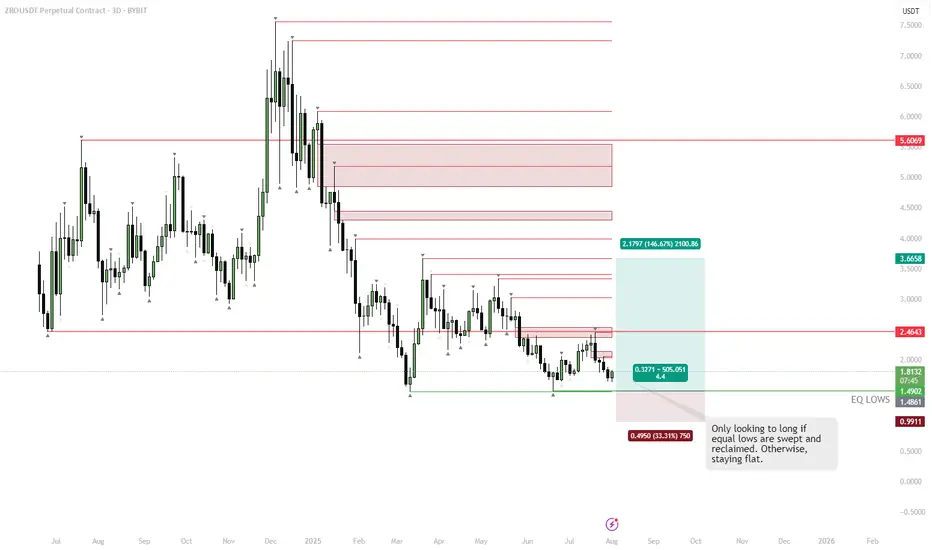
ZRO – Best SetupPrice is consolidating near key equal lows around $1.48–1.50. Liquidity likely sits below these lows, making a sweep into that zone attractive for larger players. Chasing longs here is risky without confirmation.
Plan:
• Wait for a clean sweep below the equal lows
• Look for a strong reclaim of the range back above $1.50 (failed breakdown)
• Entry trigger is confirmation of buyers stepping in after the sweep
If these conditions are met, targeting $2.46 and higher makes sense. No sweep/reclaim = no trade.
LongPengu broke a swing on the daily at equilibrium.
I am interested in a long position if it retraces back to OTE.
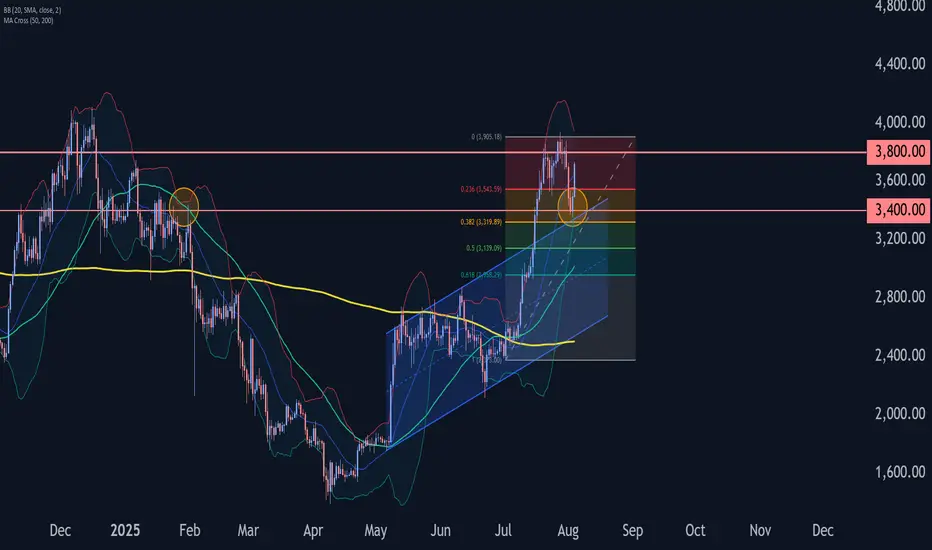
Ethereum Wave Analysis – 4 August 2025- Ethereum reversed from the key support level 3400.00
- Likely to rise to resistance level 3800.00
The Ethereum cryptocurrency recently reversed from the support zone between the key support level of 3400.00 (formerly a resistance level from January) and the upper trendline of the recently broken up channel from May.
This support zone was further strengthened by the 38.2% Fibonacci correction of the previous sharp upward impulse from July.
Given the clear daily uptrend, Ethereum cryptocurrency can be expected to rise to the next resistance level 3800.00.