"BTC Sweeps Liquidity – Eyeing 115K Reclaim?""BTC Sweeps Liquidity – Eyeing 115K Reclaim?"
🔍 Technical Analysis – BTC/USD
On the 1H chart, Bitcoin (BTC) is currently displaying a textbook smart money structure, with price action following key institutional footprints.
🔑 Key Observations:
Liquidity Grab at Weak Low
Price dipped below the local support (~112,500), sweeping sell-side liquidity and tapping into a possible reversal zone.
Rejection from Demand Zone (Support Area)
A strong reaction occurred right at the support level, suggesting buyer interest is still present.
Order Block & Fair Value Gap
A visible Fair Value Gap (FVG) sits above current price action, aligning with an Order Block near the 115,000 level — this is a key magnet for price to rebalance.
Target Zone
Immediate upside target is 115,000, where an order block lies. If price reaches that level, expect potential short-term resistance or reversal.
Break of Structure (BOS) Confirmations
Multiple BOS and CHoCHs indicate bearish-to-bullish attempts, but the current structure still needs confirmation above 113,500+ for bullish continuation.
🧠 Conclusion & Expectation:
BTC has swept liquidity to the downside and may now seek to fill the FVG and revisit the 115K order block. However, confirmation is required — watch for bullish engulfing candles, volume spikes, or a CHoCH above 113,500.
“Smart money doesn’t chase — it waits for liquidity, then repositions. BTC may be following the same script.”
Crypto market

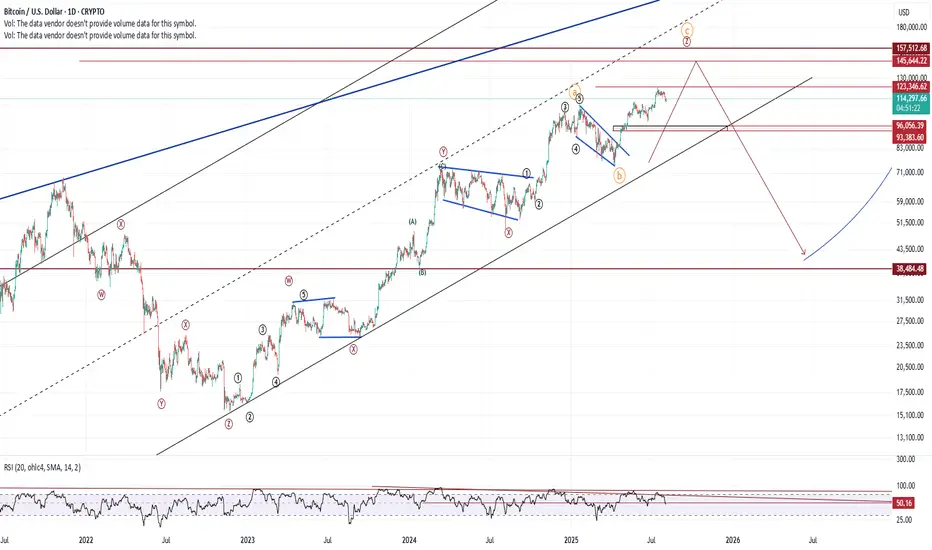
My bullish view on BTCIf we break upwards in this channel we will see 134k and/or 140k depending on the resistance on the trend lines!

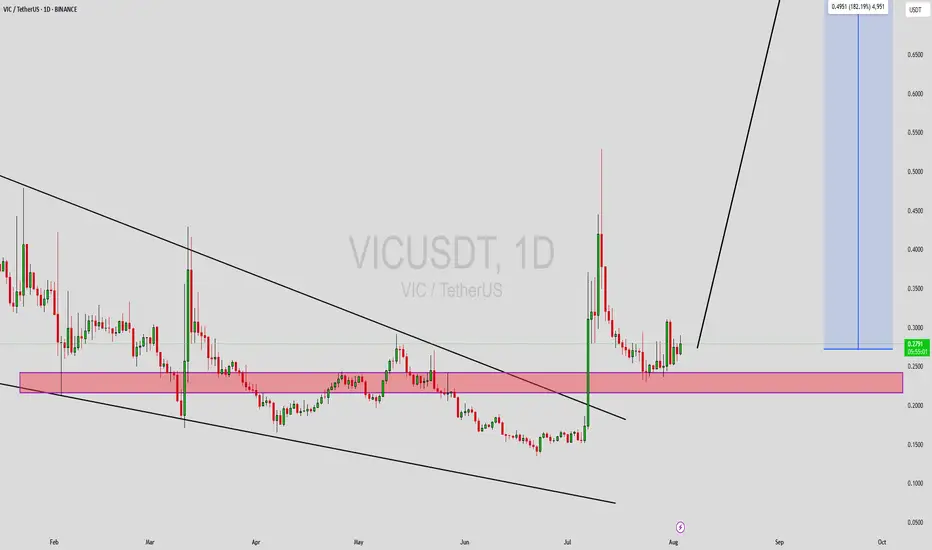
VICUSDT Forming Descending ChannelVICUSDT is currently showing a classic descending channel pattern, which often signals a potential bullish reversal upon breakout. After a sustained downtrend, the price appears to be stabilizing and respecting the lower boundary of the channel, while volume remains healthy. This combination of falling price within a defined channel and consistent volume is often a precursor to an explosive breakout. A breakout above the upper resistance line of this descending structure would validate a trend reversal and trigger a wave of bullish momentum.
What makes VICUSDT particularly compelling is the aggressive profit potential of 140% to 150%+. This high reward expectation aligns with typical breakouts from descending channels, especially when paired with strong investor interest and favorable market conditions. The technical setup suggests that the asset is currently undervalued, and any breakout move could quickly be followed by a sharp rally as buyers rush to capitalize on the momentum.
Recent market sentiment around VICUSDT has turned positive, with increasing attention from retail traders and investors alike. As capital rotates into mid-cap altcoins showing strong breakout formations, VIC is positioned to benefit significantly. Traders should closely watch for confirmation of a breakout with strong candle closes above the upper trendline and rising volume. That would be the green light for entering long with a well-defined risk.
This is a prime candidate for traders who prefer breakout setups and are seeking high-risk, high-reward opportunities. Given the technical indicators, volume support, and increasing investor interest, VICUSDT could be one of the most explosive plays in the coming sessions.
✅ Show your support by hitting the like button and
✅ Leaving a comment below! (What is You opinion about this Coin)
Your feedback and engagement keep me inspired to share more insightful market analysis with you!
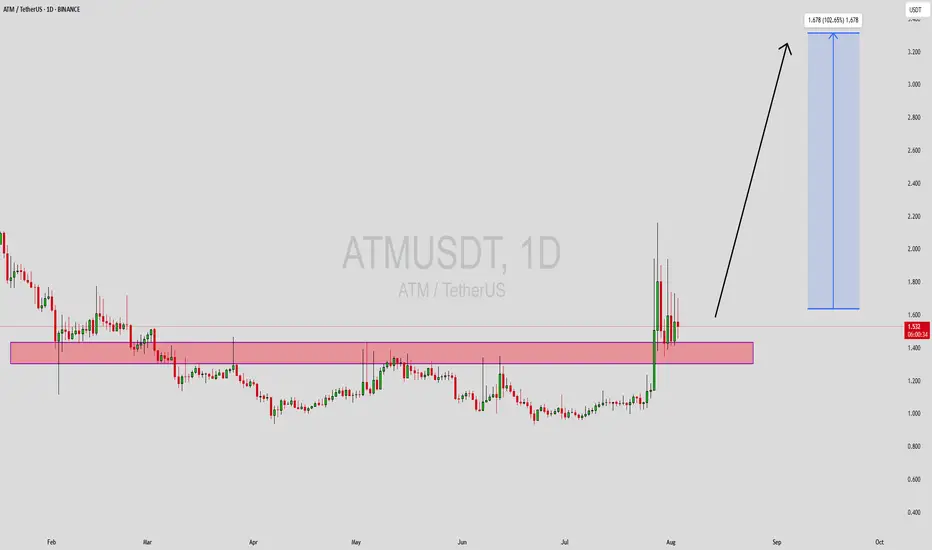
ATMUSDT Forming Bullish ContinuationATMUSDT is displaying a strong bullish continuation signal following its recent breakout from a prolonged consolidation zone. The price has surged above a critical resistance range, now turned into a support zone (highlighted in pink), which held the price down for months. This shift in structure signals renewed bullish sentiment, with price action stabilizing just above the breakout area — a textbook sign of accumulation before the next leg upward.
The trading volume accompanying this breakout is notably strong, reinforcing the legitimacy of the move. With an expected gain of 90% to 100%+, the current market structure suggests there's still substantial upside potential. The projection points to a move towards the $3.20 area, aligning with previous high-volume sell zones. If bulls maintain control and the price remains above the new support zone, this target becomes increasingly realistic in the short-to-mid term.
Investors are beginning to show strong interest in ATM, which is likely due to both technical and fundamental reasons. As the crypto market regains momentum, low-cap or mid-tier altcoins with solid breakout structures tend to outperform. The chart setup on ATMUSDT is appealing to both swing traders and breakout traders who are targeting high-reward scenarios with proper risk control.
ATMUSDT is a coin to watch closely. Any retest of the support zone could be a solid entry opportunity for those who missed the initial breakout. As long as the structure holds, this setup remains bullish and could offer one of the most rewarding trades on Binance’s spot market in the coming weeks.
✅ Show your support by hitting the like button and
✅ Leaving a comment below! (What is You opinion about this Coin)
Your feedback and engagement keep me inspired to share more insightful market analysis with you!
Chainlink updateLooking at chainlink-btc monthly chart and the fibonacci levels I can see a long term bearish move completed and a long term accumulation phase, so I expect a big bounce in the next 2 months

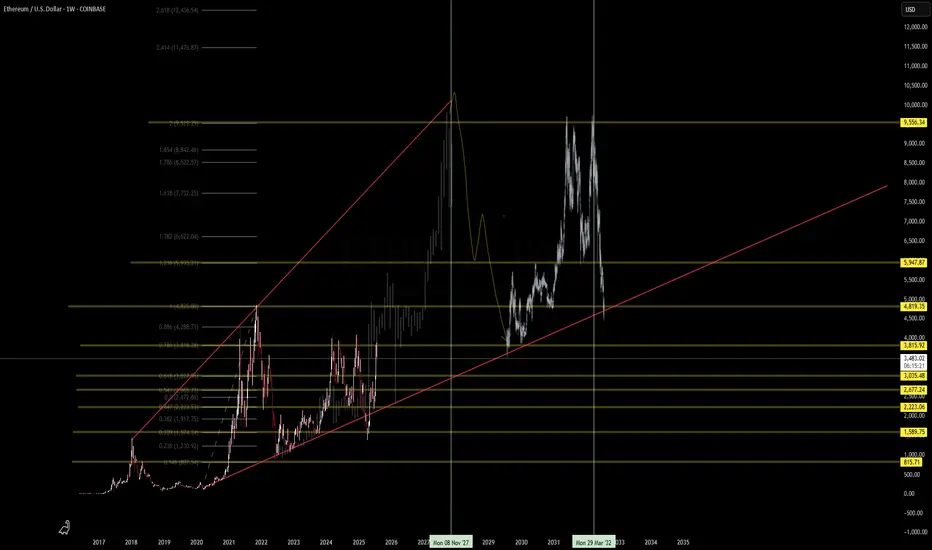
ETH: VOLANX Pattern Projector Predicts 10K by 2030. It's 2025!Notes:
Multi-Timeframe Liquidity Reaction Framework
Define Your Timeframes
Higher-TF (Daily / 4-hour)
Map major liquidity zones (daily highs/lows, order-block clusters).
Note structural breaks and fair-value gaps around $3,200–$3,300 and $3,800–$4,000 (Murphy, 1999).
Mid-TF (1-hour)
Observe zone tests: wick‐rejections, two‐bar reversals, volume spikes.
Tag each test as “acceptance” (close within zone) or “rejection” (long wick through zone) (Bulkowski, 2008).
Lower-TF (15-/5-minute)
Fine-tune entries: look for micro-order-blocks, VWAP pullbacks, or oscillators divergences immediately post-test.
Set Up Your Research Template
Zone (TF) Date/Time Price Level Test Type Volume %Δ Next Move (pips / %) Notes
Daily Highs (D) 2025-08-03 07:00 $3,800 Rejection +45% +2.5% ↑ Bearish wick test
Order Block (4H) 2025-08-02 16:00 $3,250 Acceptance +30% +1.8% ↑ Smooth retest
… … … … … … …
Measure & Analyze
Wick Length vs. Zone Width: Wick ≥ 50% zone width → higher-prob rejection.
Volume Delta: Spike > 30% above 20-period average → institutional activity.
Post-Test Trend: Record 1-bar, 3-bar, and 6-bar returns after zone interaction.
Iterate & Refine
Review which zones yield reliable continuations versus false breaks.
Adjust zone boundaries (expand/contract by ATR) based on statistical edge.
Incorporate into your DSS for automated alerts when high-prob setups appear.
“By systematically logging zone interactions and subsequent moves, you’ll quantify which liquidity tests offer the best risk-reward and tune your entries for optimal efficiency.”
References
Bulkowski, T. N. (2008). Encyclopedia of candlestick charts. John Wiley & Sons.
Murphy, J. J. (1999). Technical analysis of the financial markets. New York Institute of Finance.
binance compression!!Bnb price compression at right has been incredible and rightly so. waited for liquidity increase which will make price explosive to up side, making ath all along now, objectively 1200 tp but crazy price will be seen up around 3000s

ETH/USD: Legacy coin. Let's see what we get in the hrly, I plan to study the move and make my decision.

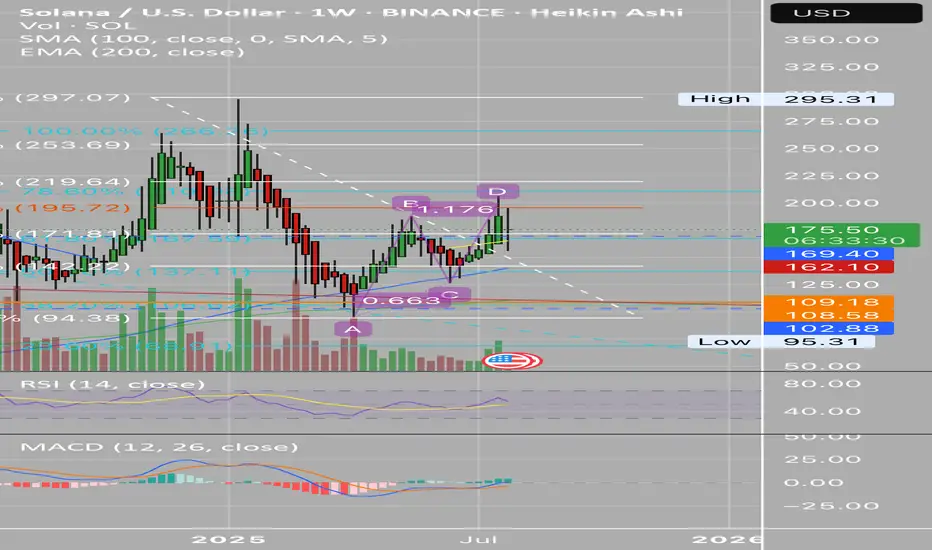
Weekly Chart RejectionRight now I’m seeing a rejection at 50% Fib
It also looks like it’s gonna to confirm it at week close.
I’m concerned this means we continue to drop $109 area as support.
Looks like most of the coins out there can keep dropping so likely the same with SOL
ETH/USD: Now I will architect a strat to run my HFT. Macro Thesis
BTC & ETH “side by side” since 2017–18; both stalled in a multi-year base
Renewed institutional inflows & Fed policy divergence set the stage for a parabolic squeeze
If BTC can trade toward $100 K as a store-of-value, ETH has clear path to $50 K
Technical Setup
Key Resistance: Descending trendline at $3,800–4,000
Confluence Support: $3,200–3,300 (0.618 Fib + rising trendline)
Momentum: Daily close above $3,800 triggers acceleration
Trade Plan
Entry: Break & retest above $3,800
Targets:
T1: $5,000 (round number + regression line)
T2: $10,000 (psychological) ⇨ ultimate stretch T3: $50,000
Stop-Loss: $3,100 (below 0.618 Fib zone)
Risk Management: 1% per trade; adjust with DSS signals
Note: ETH is a new asset class for me; DSS will filter optimal entries and sizing. Always watch macro drivers before committing.
#Ethereum #CryptoMacro #TradingView #SmartMoneyConcepts #VolanX #DSS

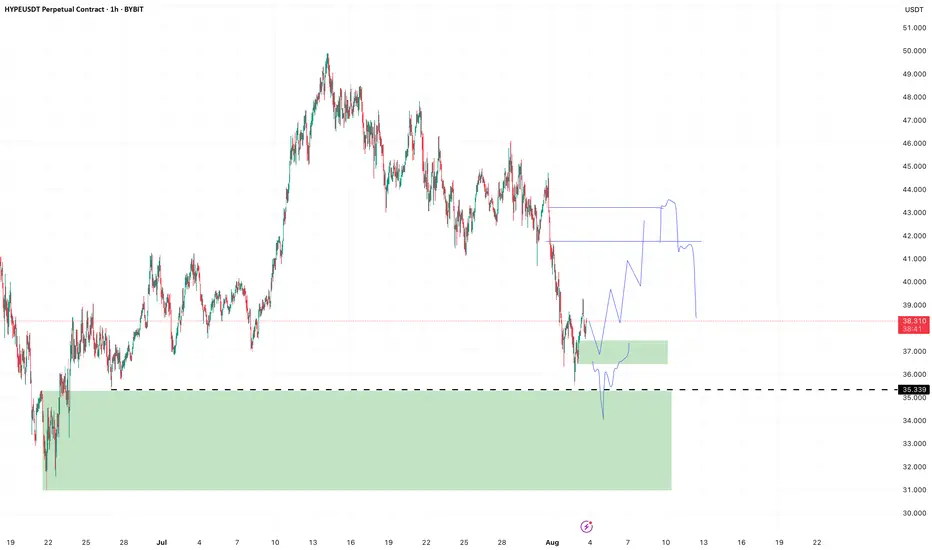
HYPE - Imbalance to be filledVery nice imbalance on HYPE here, I think there are a few different things to keep an eye on, money to be made for sure.
Technically an msb on H1, although again a strong rejection and only a very short time spent above the msb. But we can try a long on the retest in the green box, if we get it. Stop is below the low.
Second long attempt is enter where we just got stopped, but only on a reclaim OR look for ltf entry in the big green box below.
Both tps are in the imbalance shown on the chart, from where we can eye rejection for trend continuation down.
BURGERUSDTThe crypto market unstable right now, Burger Swap have very low supply token 21M.
Its a good for long term investing


Quick Video Updating Previous PENGU Charts SharedI wanted to record a brief video of my thoughts for PENGU and where we may be headed. This is an overall compilation from the previous charts shared and how/why I feel this was a good entry for a run towards ATH on this chart. It looks to me that we have a strong support level that has formed along with a quick wick testing a previous weekly level. Right now we seem to be in a small range and in need of some momentum to begin a strong move as this coin has been recently known to do. With it being a Sunday I am not sure we get it today, but would love to see it! Alerts set for confirmations for both right and wrong scenarios on this trade idea as always. Enjoy your weekend!

KAIA Bullish DivergenceBINANCE:KAIAUSDT
Trade Setup:
Target 1: 0.1472 (0.786 Fibonnaci Golden Zone).
Target 2: 0.1544 (0.618 Fibonnaci Golden Zone).
Target 3: 0.1594 (0.5 Fibonnaci Golden Zone).
Target 4: 0.1808 (0 Fibonnaci).
Stop Loss: 0.1265 (1.272 Fibonnaci).
RSI Analysis: The RSI is showing a bullish divergence, suggesting potential bullish momentum. The current RSI is around 21.23, approaching oversold territory, so caution is advised.

Sequence Analysis on ETH/USD, WE could break out !Sequence Analysis on ETH/USD
Primary Impulse (June 2022–Nov 2023)
Wave 1: Bottom ≈ $989 → top ≈ $2,688
Wave 2: Retrace to ≈ $1,492 (≈ 61.8% Fib of Wave 1)
Wave 3: Advance to ≈ $3,550 (strongest, longest wave)
Wave 4: Pullback to ≈ $2,300 (above Wave 1 high—validates impulse)
Wave 5: Extension to ≈ $5,080 (completes 5-wave structure)
Complex Correction (Dec 2023–June 2025)
W–X–Y Double Zigzag
W: Down from $5,080 → $2,678
X: Relief rally to $3,800
Y: Final decline to $1,155 (below Wave 4 low)
Rule check: Y-wave breaches Wave 4 territory, confirming an expanded correction (Prechter & Frost, 2005).
Current New Impulse (June 2025–ongoing)
Wave (1): Low ≈ $1,155 → $2,400
Wave (2): Shallow retrace to $2,271 (≈ 38.2% Fib)
Wave (3): Strong leg to $3,800+ (exceeds Wave 1 by ratio ≈ 1.61)
Wave (4): Correction to $3,300 (above Wave 1 high, valid)
Wave (5) (projected): Expected to drive above $5,800, targeting regression-line confluence
Key Rules & Ratios
Wave 3 cannot be shortest (here, it is longest)
Wave 4 must not overlap Wave 1 territory (confirmed)
Fibonacci alignments at 38.2–61.8% retracements guide entry zones (Prechter & Frost, 2005)
References
Prechter, R. R., & Frost, A. J. (2005). Elliott wave principle: Key to market behavior (10th ed.). New Classics Library.
Sources

ETH/USD: We in? Not yet!Macro
FOMC held rates at 4.25–4.50% for the fifth consecutive meeting, stressing a data-dependent stance amid mixed economic signals (Reuters, 2025a).
White House to publish a pro-crypto policy report, signaling potential regulatory clarity and institutional inflows ahead (Reuters, 2025b).
Ether has doubled over the past three months and gained 4.5% in the last week, reflecting strong momentum and market breadth (Reuters, 2025c).
Risk Management
Stop-loss: Below key support at 3,237 (0.618 Fib + trendline confluence).
Position sizing: Risk ≤ 1% of account equity per trade.
Risk/Reward:
Target 1: 4,372 (1.236 Fib) → RR ≈ 1.5
Target 2: 5,080 (regression line projection) → RR ≈ 2.5
Trade Setup
Entry: On a daily close above the ascending trendline near 3,400–3,500 with bullish confirmation (e.g., hammer or engulfing candle).
Targets:
Partial profit at 4,372 (1.236 Fib)
Full exit at 5,080 (regression line)
Stop-loss: 3,200–3,230 zone (below 0.618 Fib).
Sentiment Filter: “Here or no trade” — only engage if price respects confluence support.


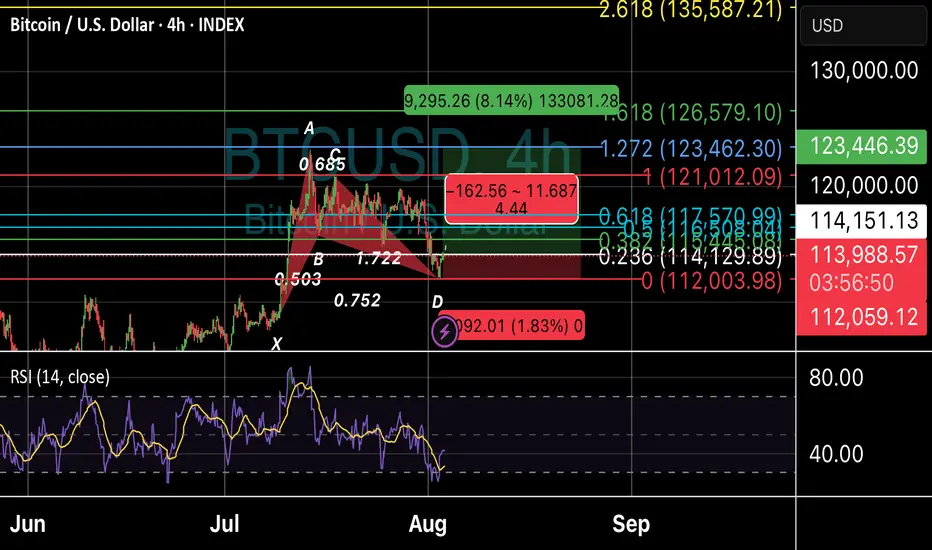
Bullish Bat on $BTC Bullish Bat discovered on 4hr timeframe. Target is 1.272 Fibonacci Extension, measured from point D.
BTCUSD--Short-03-08-25--After last week, expecting price will move down further to monthly support-1 and monthly support-2

Potential 4H Head and shouldersA potential h&s could be shaping, the daily trend is down but the weekly chart is looking for support.
