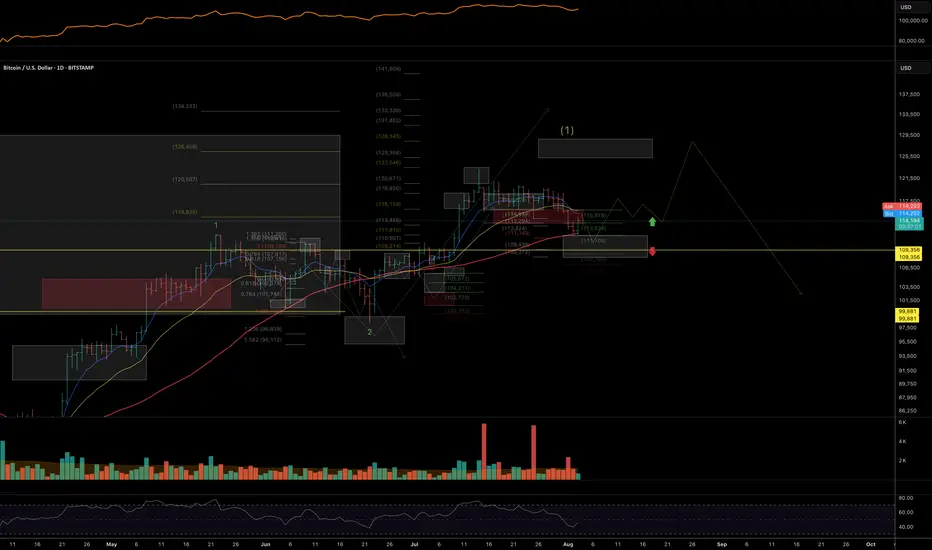
Bitcoin: 113K Support Bounce Buy Signal.Bitcoin has retraced thanks mostly to "unexpected" revisions to labor market statistics. While this move has many making outrageous forecasts, price has simply retraced to the 113K support levels and has generated a swing trade long signal (break of 114K). IF the momentum stays intact, it is within reason to anticipate a test of the low 120K's while a more aggressive expectations would be a break out into the 130K's. Keep in mind if 123K is broken, even by a small amount, that would confirm the current movement as the wave 5 of 5 which means it becomes the most vulnerable to a broader correction.
This NFP report and BLS situation is the perfect example of a catalyst that NO ONE in the financial "expert" space saw coming. Even Chairman Powell on Wednesday was pointing out how stable employment growth has been and emphasized the importance of this statistic for their rate decisions. Which means the Federal Reserve is making decisions based on totally inaccurate data. Which also means the entire market has been priced completely wrong for months. My point is, "official" information that you may be basing your investments on can be totally inaccurate and can be revealed out of nowhere. This risk alone puts every investor at the mercy of the market and why it is so important to recognize the limitations of ANY market information through the lens of RISK management.
I have been writing about a potential bullish range breakout beyond 120K for a test of the 130s OR if the range support breaks instead, to watch for a test of the key support at 113K. There is NO way to know which way the market will choose in advance, it all depends on the outcomes of specific events which act as catalysts for one scenario or the other.
This is why being knowledgeable about wave counts and other forecasting techniques can be very helpful in terms of gauging risk and potential. And based on this, AS LONG AS the 108K area is NOT overlapped, the current price structure is still within the boundaries of a bullish sub wave 4. This is why I am still short term bullish on Bitcoin and why I believe the current buy signal has potential to test at least the low 120's in the coming weeks. IF the 108K area is broken instead, that reduce the chances of a short term bullish break out, and may be the proof that the broader Wave 5 structure is complete.
The risk at this point can be measure from the 112K low area and nearest profit objective 118K which offers an attractive reward/risk. Measure everything from RISK first, and always be prepared to be wrong. If the market pays, consider it a gift.
Thank you for considering my analysis and perspective.
Crypto market

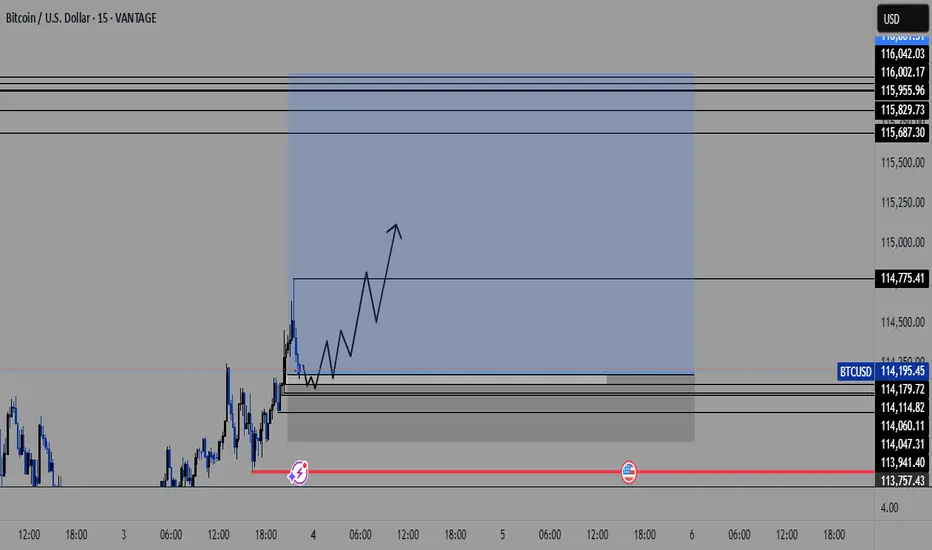
Bitcoin Forming a New Range?After all of the ups and downs over the past few days, I zoom out to a higher time frame to get a grasp of what's really happening. With three hours or so left in the day it looks most likely that the formation of a new range is in the works. I'm looking for two options over the next few hours, one being that it gets right back into the previous range and is all just a wick on the weekly chart which caused three days of panic for absolutely no reason. This would probably be hilarious but also the less likely outcome!

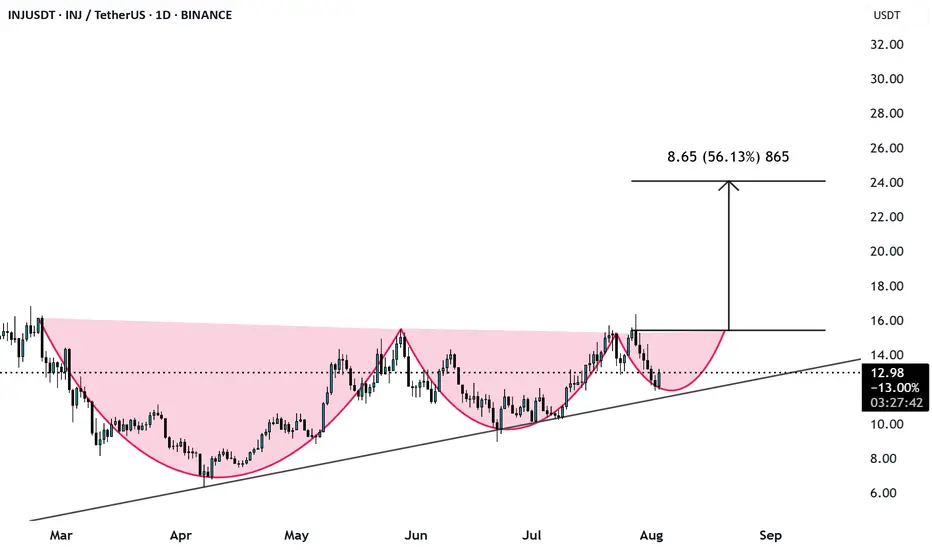
INJUSD Ascending triangle PatternINJUSD has forme a Ascending triangle pattern and looks like double cup and single handle pattern.
Bitcoin to $116K in a Week? Here's the Case Everyone's IgnoringI know it sounds wild — but hear me out.
BTC is primed for something massive, and the ingredients are all on the table:
✅ ETF inflows are quietly stacking
✅ Supply shock post-halving is still underestimated
✅ DXY weakening = flight to hard assets
✅ Global uncertainty = Bitcoin safety bid
✅ Technicals pointing to a breakout above ATH with no resistance until $100K+
We're seeing the early signs of parabolic structure forming — and if volume confirms, this could move fast. Everyone thinks a 2x in a week is impossible... until it isn't.
Not saying it’s guaranteed — but if you've been around long enough, you know BTC doesn’t move linearly.
👀 Watch the $72K breakout zone closely. If it flips with conviction and volume, $116K is not out of the question.
Drop your charts. Agree or disagree?
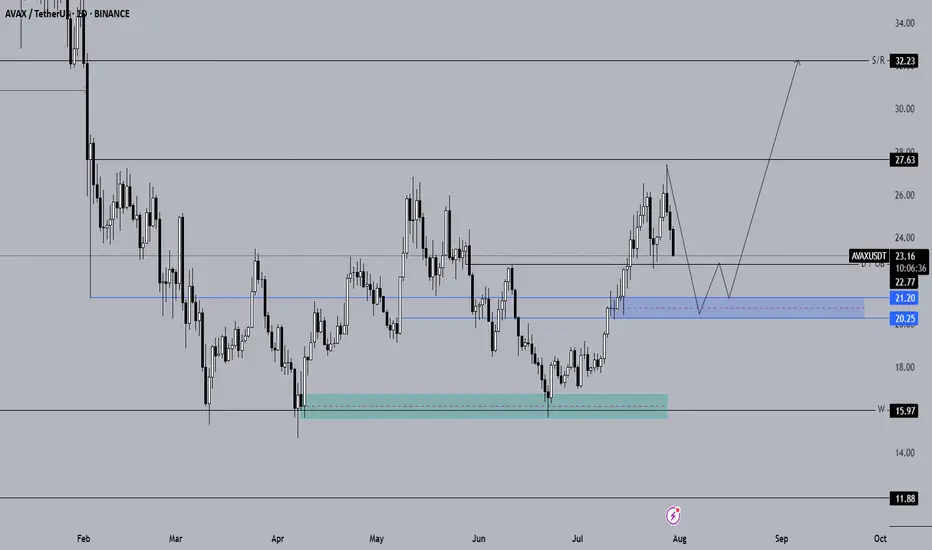
Long-Term Technical Analysis of AVAX CoinWhen evaluating AVAX for long-term investments, the blue support zone highlighted on the chart stands out as the key area to monitor for potential spot entries. If AVAX closes daily candles below the $22.77 level, it is expected to continue its downward trend.
The primary spot buy zone for AVAX is identified between the $21.20 – $20.25 support range. If the price retraces into the blue zone on the chart, we plan to initiate spot positions. Should AVAX show a reversal from this area, our next upside targets are $27.63 and $32, respectively.
If AVAX fails to generate a strong reaction from the blue zone and continues to decline, we will then monitor the $18 support level. As long as AVAX holds above $18, our bullish outlook from this analysis remains valid.
Not Financial Advice (NFA).
Altcoins and BTC: Macro Structures, Key Levels, and What’s NextIn this Sunday's market crypto-market analysis, I'm sharing trend structures and key support zones for the total altcoin market cap (excluding BTC and ETH), as well as for ETH, XRP, BNB, SOL, HYPE, and BTC. I also outline my main scenarios for market movement through the end of August and the rest of the year.
Key takeaways:
- Impulsive structures are shifting to diagonal structures — less stable and growth cycle is likly approaching the final phase of this market cycle.
- As long as prices hold above key macro support zones, the uptrend structure remains intact.
- I don’t rule out another sell-off early this week, deeper into support zones, followed by a potential rebound through late August, then a phase of consolidation (ideally staying above the current correction lows from the July top), and one final rally to new highs starting mid-autumn and continuing toward year-end.
-I expect ETH, XRP, and BNB to be the primary beneficiaries of the next wave of growth.
Total Altcoin Market Cap (Excluding BTC & ETH)
Support zone: 955-913B
Target resistance zone: 1.19-1.26T
BITSTAMP:ETHUSD
Support zone: 3400–3200 (possible extension to 3000)
Target resistance zone: 4300–5100+
BINANCE:XRPUSDT
Support zone: 2.7–2.5
Target resistance zone: 5.2+
BINANCE:SOLUSDT
Support zone: 170–150
Target resistance zone: 250–300
CRYPTO:HYPEHUSD
Support zone: 33–30
Target resistance zone: 60–72
BINANCE:BNBUSD
Support zone: 510–530
Target resistance zone: 960–1000
BTC Dominance
BITSTAMP:BTCUSD
Support zone: 111–109K
Target resistance zone: 125–130/135K
If you’d like me to cover a specific coin, leave a comment — I’ll include it in future updates or prepare a short video breakdown.
Thanks for your attention, and I wish everyone a strong start to the week and well-grounded investment decisions!
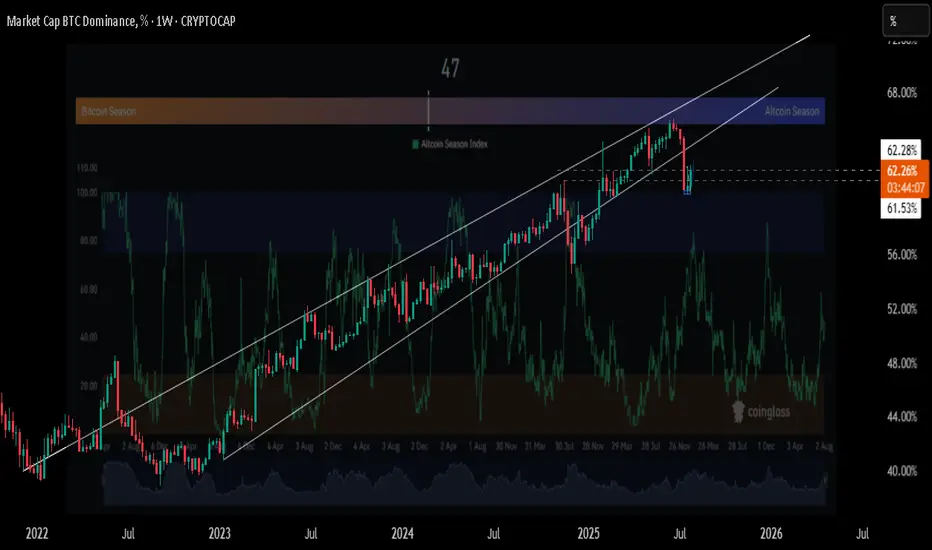
Altseason Countdown: When Will Alts Explode? Hey traders,
✅ Altcoin Season Index
Currently at 47, a neutral zone — not yet favoring altcoins
True altseason usually begins when the index rises above 75, showing consistent altcoin outperformance
Historically, transitions from this level to full altseason take around 1–3 months, assuming BTC dominance declines
✅ Bitcoin Dominance (BTC.D)
BTC dominance is rebounding from strong support near 61%, now around 62.25%
As long as Bitcoin holds dominance, capital remains concentrated, delaying altcoin rallies
If BTC dominance tops out near current levels and begins trending lower, it could trigger broad altcoin strength
✅ Macro Insight: Fed & Liquidity Outlook
Based on current macro conditions, I anticipate that the Federal Reserve may introduce rate cuts as early as September
A rate cut would inject more liquidity into markets, increase risk appetite, and historically benefit altcoins more than BTC
This potential shift in monetary policy aligns well with the technical setup for altseason acceleration
🧠 My Timeline Projection
If BTC dominance reverses within the next few weeks, altseason could begin around September–October 2025
If dominance remains strong or climbs above 63–64%, the shift may be delayed into late Q4 2025
📌 Final Thoughts
Altseason isn’t here yet, but multiple signals are aligning: a mid-level index, a possible BTC dominance top, and a favorable macro window.
Share your thoughts in the comments box.
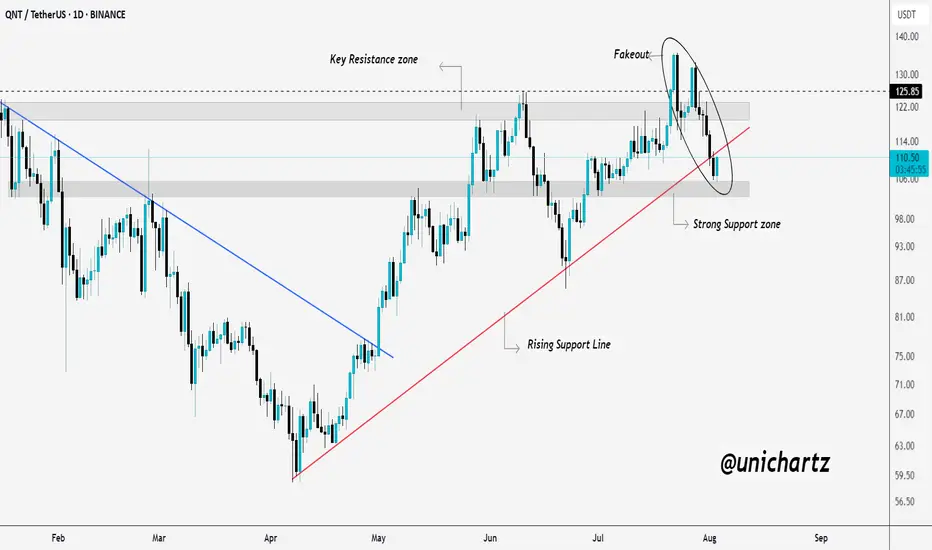
QNT Price Action Heating Up at Critical ZoneGETTEX:QNT attempted to break above its key resistance zone but ended up creating a fakeout, trapping late buyers at the top.
The sharp rejection dragged the price back down toward a strong support zone, which also aligns with the rising trendline.
This area is now a key decision point, if the price holds, a bullish reversal could follow. But if it breaks below, further downside is likely. This level will define QNT’s next major move.
DYOR, NFA
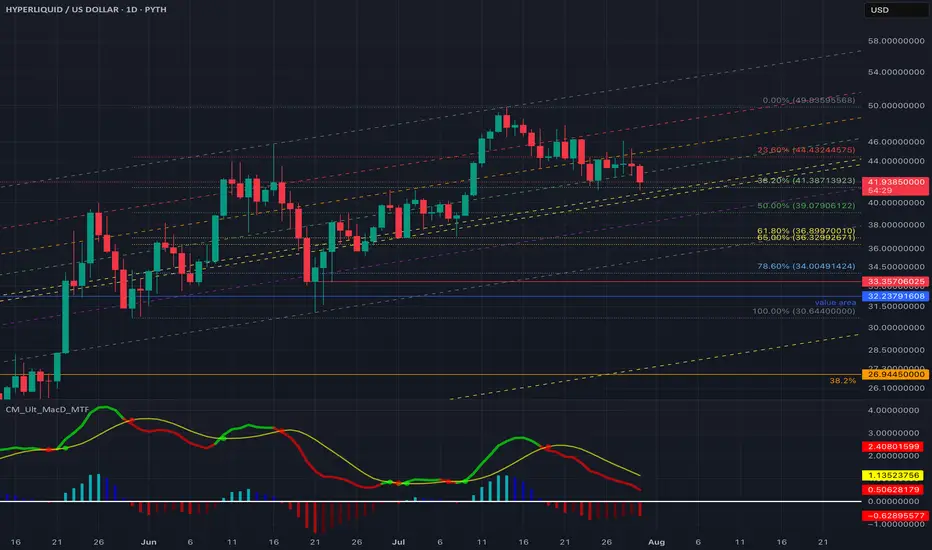
Analyzing Healthy Pullback on $HYPE with Fibs + RSIAfter a strong rally to ~$49.83, PYTH:HYPEUSD is now retracing into a critical Fibonacci confluence zone — a key moment to watch as we position for the next potential leg up.
Key Observations
Price is hovering around Fib 0.382 and nearing the Fib Channel 0.618
RSI is approaching oversold (currently ~32)
MACD remains bearish with momentum still building
If the golden pocket zone (~$39–$40) holds, it could mark the end of this short-term correction.
Trade Setup to Watch
When price taps the $39–$40 level, we will be looking for
✅ MACD crossover on lower timeframes
✅ Bullish RSI divergence
Because this could signal a short-term bounce opportunity.
So, I am expecting the entry zone around $39.0 – $40.0
TP1 - $44.4 (Fib 0.236 – first resistance)
TP2 - $49.8 (Previous swing high)
TP3 - $53–$55++ (Extension target if bullish continuation resumes)
If there is any changes in the macro environment, we also have a contingency plan to buy more lower. If price breaks below the golden pocket, strong support lies in the $30–$33 region. So we will do big accumulation there. It is a huge discounts imo. It is like 5% of probability to actually happen at the current market condition though.
Even a deeper move toward $27 (TOTALLY unlikely at the moment!) would be a mega long opportunity. When it happens, it should not be a breakdown panic.
Final Thoughts
Current price action appears to be a standard pullback.
The confluence of Fib retracement + channel support makes this a high-probability bounce zone.
Watch for bullish divergence or volume spike between $36–$39
Patience now = Better positioning later.
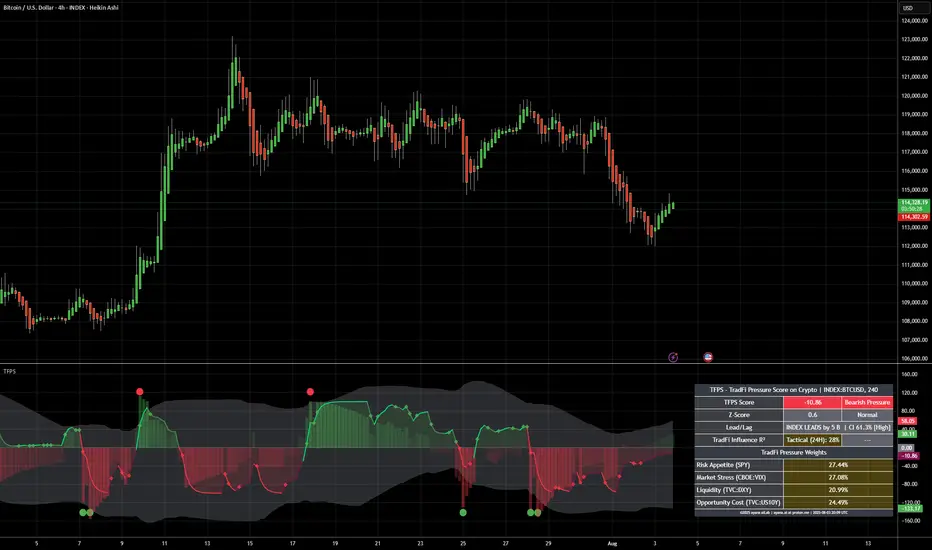
[ayana] Crypto Weather AI - 2nd test - do you like this?TFPS - TradFi Pressure Score on Crypto | INDEX:BTCUSD, 4H
Market Context Timestamp: 2025-08-03 21:50:47 UTC
TradFi Market Status: Closed
Reason (if closed): Weekend
Additional Notes: US futures are also closed. The dashboard reflects market sentiment from Friday's close.
TFPS Analysis: 2025-08-03
CORE RECOMMENDATION & NARRATIVE
The current market narrative is characterized by a shift in leadership: while TradFi markets exert slight bearish pressure, the movement is driven by internal crypto factors. The weak R² signal and the Lead/Lag indicator, which suggests the crypto asset is leading TradFi markets, point to a phase of internal crypto dynamics.
The Story: The TradFi environment shows a balanced bearish bias, with no single component dominating. However, the index (BTCUSD) is leading TradFi markets by 2 bars on the 4H chart. The TradFi correlation to price (R²) is weak at 20%, indicating that internal crypto catalysts are driving the price movement.
The Implication: This is a 'crypto-first' environment. The focus should shift from TradFi macro indicators to on-chain data and crypto-specific news. The TFPS is currently serving as a lagging indicator, confirming crypto action retroactively.
Primary Observation Signal: INDEX LEADS. The leadership of the crypto asset is the key signal. The strength and direction of the next crypto move are not predicted by TradFi but must be derived from internal crypto data.
### DATA SNAPSHOT & DECODING
| Metric | Dashboard Value | Interpretation (Based on TFPS v63 Logic) |
| :--- | :--- | :--- |
| TFPS Score | -12.66 | Bearish pressure originating from TradFi markets. |
| Z-Score | 0.53 | Normal. The current score is not statistically extreme ($$\lvert z \rvert < 2.0$$). An immediate mean reversion is not expected. |
| Lead/Lag | INDEX LEADS by 2 B CI 60.65% | The BTCUSD index is leading TradFi markets by 2 bars on the 4H chart. The high correlation confidence (> 0.50) makes this a very reliable signal. |
| TradFi Influence R² | Tactical (24H): 20% | Weak correlation. Only 20% of the price movement can be tactically explained by the TFPS. The market is currently driven mainly by internal crypto factors. |
| Top Weight: SPY | 27.98% | Non-dominant, but largest weighting factor. Represents market risk appetite. |
| Second Weight: VIX | 27.59% | Non-dominant, but second largest weighting factor. Represents market stress and fear. |
ACTIONABLE STEPS (LOW-EFFORT / HIGH-IMPACT)
🚀 MONITOR THIS FIRST: Focus on the price action of the BTCUSD chart itself. Since the INDEX LEADS signal is active, traditional TradFi charts (SPY, DXY, VIX) are currently lagging indicators. Look for chart formations, volume anomalies, or key support/resistance levels in the crypto market.
⏱️ ANTICIPATE MOVES: The INDEX LEADS indicator gives you a potential window of up to 8 hours (2 bars on the 4H chart) to observe TradFi markets after the Monday open. If the BTCUSD price rises or falls significantly before the US markets open, there is a high probability that the TradFi indices will follow.
🔍 VALIDATE THE THESIS: The weak tactical R² value of 20% confirms that TradFi correlation is low at the moment. Therefore, your trading decisions at this time should be based on approximately 80% crypto-internal data (on-chain, liquidity, news) and only 20% on macro data. If the R² value rises above 40% again, shift your focus back to TradFi.
#Bitcoin #BTC #CryptoTrading #TechnicalAnalysis #MarketAnalysis #TradFi #AITrading #TFPS #MarketNarrative
BTC Hits Premium Zone – Bearish Reversal Loading? BTC Hits Premium Zone – Bearish Reversal Loading?
🧠 Technical Breakdown:
🔹 1. Previous Market Structure & CHoCH
The chart shows a clear shift in structure (CHoCH) on the left, which marked the start of the bearish leg.
Break of Structure (BOS) confirms continuation of lower highs and lower lows until recent liquidity grab near the $112,551 zone.
Equal highs and liquidity above were taken out, making the move into the Premium Order Block zone highly significant.
🔹 2. Liquidity and Fair Value Gap (FVG) Zones
A major Liquidity + FVG zone was left unmitigated between $113,000–$112,000, and price is likely to revisit it.
This aligns with the target zone at $112,890, which is highlighted as a magnet for price to rebalance the inefficiency.
🔹 3. Order Block & Premium Supply Zone
A well-defined Order Block is marked just below the resistance zone near $115,166–$116,021.
Price is currently retracing into this zone, suggesting a potential reaction point for smart money to re-enter shorts.
Volume is expected to pick up here, and a reversal could initiate if price fails to break above this supply.
🔹 4. Volume Profile and Market Imbalance
Volume clusters are heaviest near the $114,000–$114,300 range, indicating high activity and previous accumulation/distribution.
Thin volume near the $112,551 zone further confirms price may drop quickly if rejection happens.
🔹 5. Support & Liquidity Sweep
Support zone around $112,551 is a previous liquidity pool and weak low that has not been fully cleared.
Price is likely to revisit this zone in the short term to clear liquidity and complete market rebalancing.
🔐 Institutional Narrative:
Smart money engineered a liquidity sweep to the downside, then caused a retracement into premium.
Now, BTC/USD is positioned in a high-risk zone where sell-side institutions may enter to push price lower.
If this order block holds, expect a rejection toward $112,890, followed by possible deeper continuation into the liquidity void below.
📌 Key Levels:
Level Price (USD)
Strong Resistance Zone 115,166 – 116,021
Order Block (Sell Area) 114,800 – 116,000 (approx.)
Immediate Support 113,000 – 112,551
Target (Liquidity Zone) 112,890
Weak Low (Final Sweep) 112,000
📉 Trade Outlook & Strategy:
🔺 If price reacts bearishly at Order Block:
Look for lower timeframe BOS/CHoCH confirmation.
Entry: Short on rejection at or near $115,000–$115,500
Target 1: $112,890
Target 2: $112,000 (extended liquidity sweep)
Stop-loss: Above $116,200 (invalidates bearish OB)
🔻 If price breaks and closes above $116,021 with momentum:
Structure flips bullish, and the OB is invalidated.
Look for long setups on retracement to $114,000 zone.
🧭 Conclusion:
BTC/USD is currently trading within a Premium Zone, testing a strong Order Block below key resistance. Price may face a bearish reaction, targeting the liquidity zone at $112,890. Smart money footprints suggest a potential trap for breakout buyers, and if momentum fades, we can expect a downside reversal to sweep remaining liquidity.

SOLUSDT CHART ANALYSİSISTRADING CRYPTO PROFITABLE?
Crypto trading is profitable but only if done correctly. Follow the
steps, strategies, and tips shared throughout our guide, and you will be
in a better position to make profitable trades. And a golden rule:
Plan your trade, trade your plan.
Never Forget: 90/90/90 trading rule.
90% of traders will lose 90% of their account value within 90
days.
1. No matter how much profit you make; what matters is how
much you keep.
2. No matter how much you keep, what matters is how much you
re-invest.
3. No matter how much you re-invested, what matters is your
total return on investment (ROI).

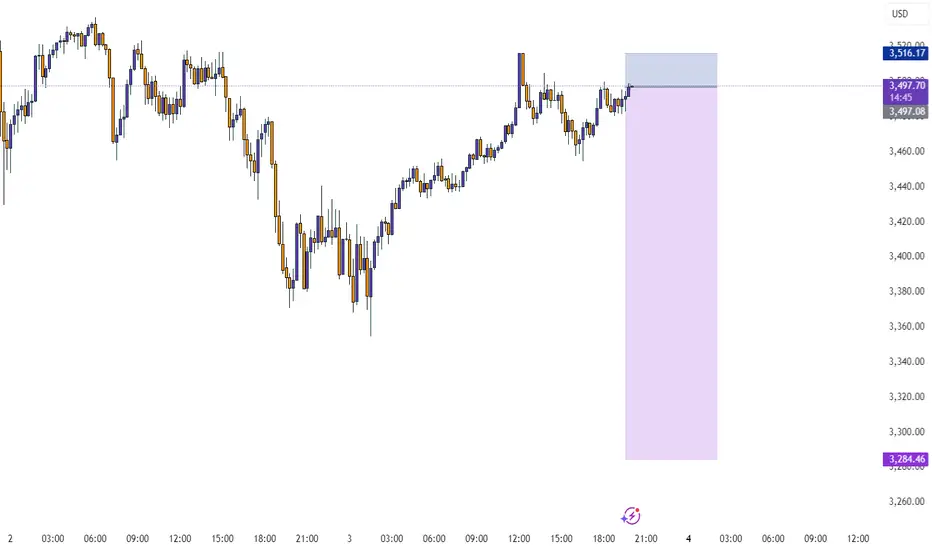
3rd Trade on Fart - 10x with bigger Stop10x
Target $0.892
Confident it will hit the trend line target
Entry $0.932
SL $0.942 above the current high candle
Risk 4/10
August 2025 Monthly ScenariosChartingMyLosses | Monthly Analysis | 1M TF
Speculative structure meets macro zones
🔵 Scenario 1: Direct continuation to the highs (Blue Path)
Price holds above PH June and pushes toward the 0.78 retracement of July, targeting 121,399 USD. This would be a classic bullish continuation fueled by residual momentum and liquidity above recent highs.
🟢 Scenario 2: Support retest before continuation (Green Path)
A sweep of the 109,893–103,009 USD zone (June’s fib cluster and previous breakout range) leads to a rebound. This would validate the zone as a new macro support and could signal institutional reaccumulation before an end-of-month push to the highs.
🔴 Scenario 3: Deep retracement into OB + FVG (Red Path)
Bears attack, dragging price down to the 98,459–96,000 USD range, tapping into a Daily Order Block + FVG inefficiency. A full liquidity sweep in this zone could set up a powerful reversal toward the new max, but would require market-wide risk-on behavior to confirm.
🧠 Speculative Note
In just one month, BTC can traverse thousands of dollars. The real question isn’t "will it drop or pump?" but rather "where is price most efficient to move next?". Keep an eye on volume, reactions at fib levels, and especially how the market behaves near the prior June low (PL).

DOGEUSD – Pressing the RoofDOGE is pressing against the 200 SMA from below, with the price floating at $0.19929 and testing $0.20007 resistance. RSI is holding steady above 54 with a modest positive slope. Reclaiming this zone could trigger intraday momentum.

SHIBUSD – Sneaky ReclaimerSHIB is mirroring DOGE, now breaking slightly above the 200 SMA at $0.000012056. RSI is above 56 and climbing — strength is building, though not explosive. Key test ahead at prior resistance levels.

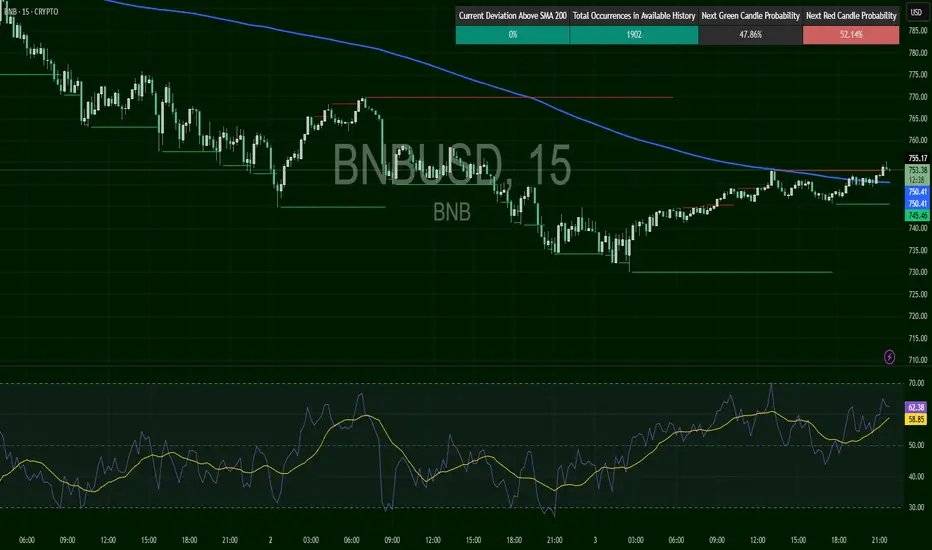
BNBUSD – Breaking Ice LayerBNB is putting in a clean upward burst and just broke the 200 SMA for the first time in this cycle. RSI near 66 suggests rising momentum. If the breakout holds, it could signal a short-term trend shift.
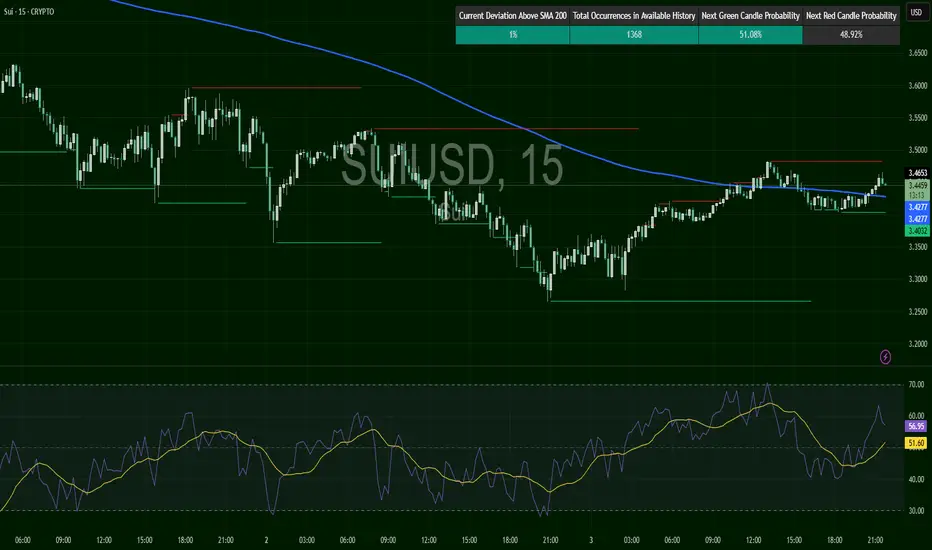
SUIUSD – Flexing MomentumSUI joins the others with a fresh close above the 200 SMA, now aiming at $3.4822 resistance. RSI at 62.95 with a sharp upslope adds confluence to the bullish momentum. This is a high-momentum breakout attempt.
BTCUSD ANNASIS OUTLOOK BULLISH MOVE POSSIBLE 4/8/2025BTCUSD – Bullish Opportunity
Current price holding strong above $114,400
Next target: $117,100
Trend momentum remains bullish
Breakout continuation possible above $115,000
#BTCUSD #BullishSetup #CryptoLive #BreakoutWatch

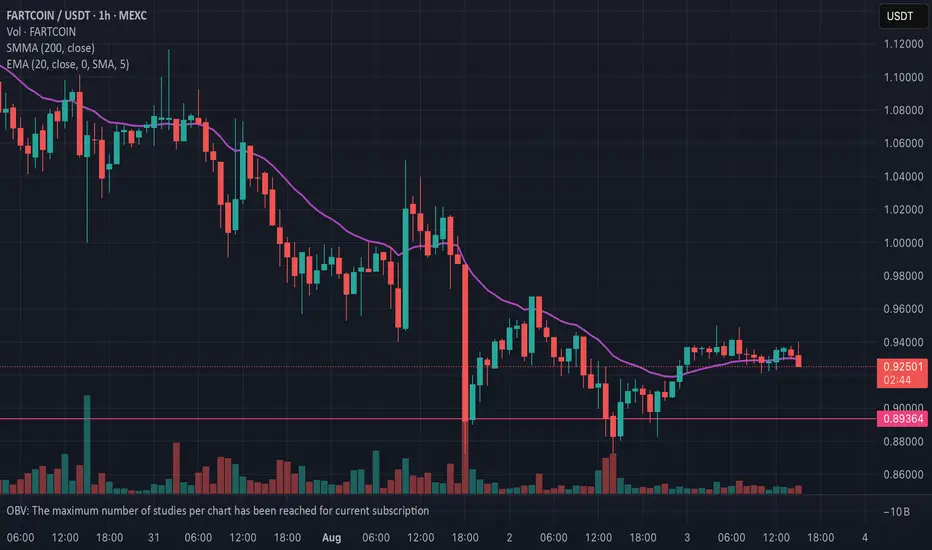
2.0 Short FART x202nd Trade on Fart using same metrics
x20 - Very tight stop
Entry $0.9327 Breaking through 25EMA
Stop $0.937 above the next highest candle close
Target $0.89 which is trend line
Risk 6/10

Market StructureIf we look at the underlying market structure, Bitcoin's structure isn't fully formed yet. There are still unsolved puzzles around 135,000. I believe Bitcoin will finalize its final structure around 135,000, which will be its expansionary structure.
The final candle on this weekly timeframe will determine Bitcoin's direction. This August, Bitcoin will either continue its bullish structure or continue its minor retracement.
Disclamer: Any information provided is for educational and informational purposes only and does not constitute investment advice.
