ETH/USD: Now I will architect a strat to run my HFT. Macro Thesis
BTC & ETH “side by side” since 2017–18; both stalled in a multi-year base
Renewed institutional inflows & Fed policy divergence set the stage for a parabolic squeeze
If BTC can trade toward $100 K as a store-of-value, ETH has clear path to $50 K
Technical Setup
Key Resistance: Descending trendline at $3,800–4,000
Confluence Support: $3,200–3,300 (0.618 Fib + rising trendline)
Momentum: Daily close above $3,800 triggers acceleration
Trade Plan
Entry: Break & retest above $3,800
Targets:
T1: $5,000 (round number + regression line)
T2: $10,000 (psychological) ⇨ ultimate stretch T3: $50,000
Stop-Loss: $3,100 (below 0.618 Fib zone)
Risk Management: 1% per trade; adjust with DSS signals
Note: ETH is a new asset class for me; DSS will filter optimal entries and sizing. Always watch macro drivers before committing.
#Ethereum #CryptoMacro #TradingView #SmartMoneyConcepts #VolanX #DSS
Crypto market

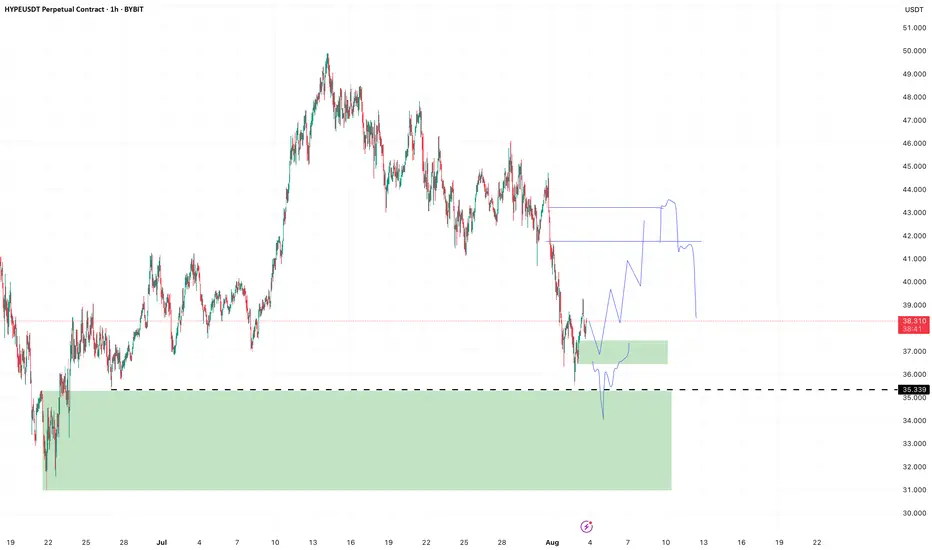
HYPE - Imbalance to be filledVery nice imbalance on HYPE here, I think there are a few different things to keep an eye on, money to be made for sure.
Technically an msb on H1, although again a strong rejection and only a very short time spent above the msb. But we can try a long on the retest in the green box, if we get it. Stop is below the low.
Second long attempt is enter where we just got stopped, but only on a reclaim OR look for ltf entry in the big green box below.
Both tps are in the imbalance shown on the chart, from where we can eye rejection for trend continuation down.
BURGERUSDTThe crypto market unstable right now, Burger Swap have very low supply token 21M.
Its a good for long term investing

BTC/USD) Bullish Analysis Read The captionSMC Trading point update
Technical analysis of Bitcoin (BTC/USDT) on the 4-hour timeframe, with a focus on smart money concepts like FVG (Fair Value Gap) and support/resistance zones.
---
Technical Breakdown:
1. Price Structure & Path Projection:
BTC is currently in a sideways range, but the drawn projection suggests a potential bullish reversal from the key support zone or the FVG level.
Two bullish paths are suggested:
One bounces from the key support zone (~114,725).
The other dips deeper into the FVG level, sweeping liquidity before heading higher.
2. Key Zones:
Key Support Level: Around 114,700–114,800, aligning with the EMA 200 and prior reaction levels.
FVG Level (Fair Value Gap): Just below the support zone — marked as a potential liquidity sweep area before bullish continuation.
Resistance Zone: 123,069.65, where partial profit could be taken.
Final Target Point: 130,312.02, projecting a strong bullish move from the base.
3. EMA 200 (Blue):
EMA sits around 114,685.97, acting as a strong dynamic support, supporting the bullish scenario.
4. RSI (14):
RSI is neutral at 51.10, providing room for bullish momentum without being overbought.
Mr SMC Trading point
---
Trade Idea Summary:
Bias: Bullish
Entry Zone:
Conservative: Near 114,725.18 (key support + EMA 200)
Aggressive: Deeper at FVG level if price sweeps that zone
Targets:
TP1: 123,069.65 (resistance zone)
TP2: 130,312.02 (main target)
Invalidation: Break and close below FVG zone would negate the setup
---
Please support boost 🚀 this analysis)

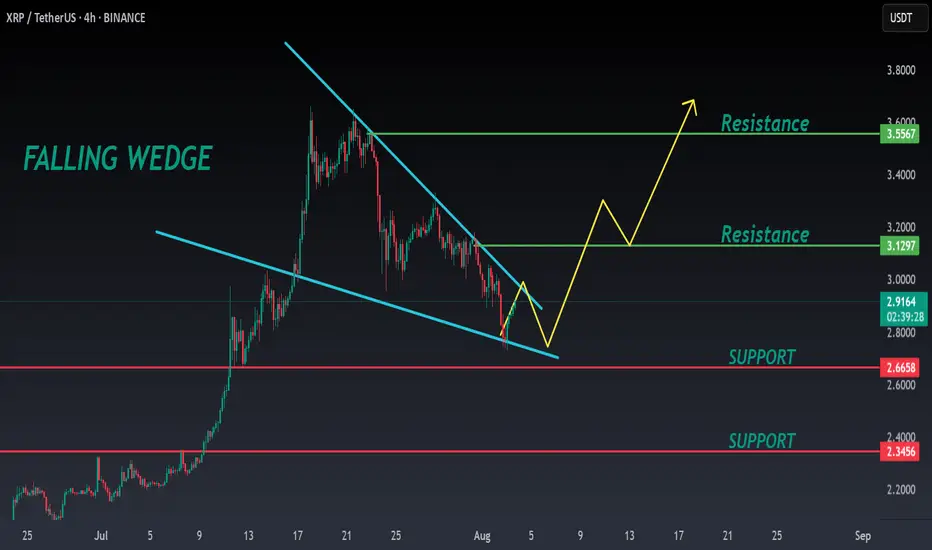
XRP ANALYSIS🔮 #XRP Analysis - Update 🚀🚀
💲 We can see that there is a formation of Falling Wedge Wedge Pattern in #XRP and we can see a bullish movement after a good breakout. Before that we would see a little retest and and then a bullish movement.
💸Current Price -- $2.9130
📈Target Price -- $3.1290
⁉️ What to do?
- We have marked crucial levels in the chart . We can trade according to the chart and make some profits. 🚀💸
#XRP #Cryptocurrency #Breakout #DYOR

Quick Video Updating Previous PENGU Charts SharedI wanted to record a brief video of my thoughts for PENGU and where we may be headed. This is an overall compilation from the previous charts shared and how/why I feel this was a good entry for a run towards ATH on this chart. It looks to me that we have a strong support level that has formed along with a quick wick testing a previous weekly level. Right now we seem to be in a small range and in need of some momentum to begin a strong move as this coin has been recently known to do. With it being a Sunday I am not sure we get it today, but would love to see it! Alerts set for confirmations for both right and wrong scenarios on this trade idea as always. Enjoy your weekend!

KAIA Bullish DivergenceBINANCE:KAIAUSDT
Trade Setup:
Target 1: 0.1472 (0.786 Fibonnaci Golden Zone).
Target 2: 0.1544 (0.618 Fibonnaci Golden Zone).
Target 3: 0.1594 (0.5 Fibonnaci Golden Zone).
Target 4: 0.1808 (0 Fibonnaci).
Stop Loss: 0.1265 (1.272 Fibonnaci).
RSI Analysis: The RSI is showing a bullish divergence, suggesting potential bullish momentum. The current RSI is around 21.23, approaching oversold territory, so caution is advised.

Bitcoin Hits $40,000, It Will Recover —Name Your AltcoinSorry, there is a typo there on the title, I meant to say: Bitcoin hits $114,000, soon to recover.
As you can see from our trading range, Bitcoin just went beyond the lower boundary and hit a new low, the lowest since 10-July but there is good news. There isn't room for prices to move much lower, this is part of the consolidation phase.
The first low happened 25-July and notice the high (bear) volume. The second low happens today and we have lower volume compared to 25-July, but Bitcoin hit a lower low. This reveals that the bearish move is already weak and losing force. It also reveals the fact that Bitcoin is about to recover.
Also notice the RSI, 2H. It hit oversold recently and went the lowest in a long while. Reversals tend to happen when the RSI becomes oversold.
Bitcoin is testing the lower boundary of the trading range, when this happens, the action reverses and moves back up. Prepare to see Bitcoin back above $120,000. It is normal and it will happen... But it is wise to give the market a few days. 5-August was bad last year. It gets bad but it also marks the bottom. Once the bottom is hit, growth long-term.
— Name Your Altcoin
Leave a comment with the altcoins you are holding now and I will do an analysis for you. The altcoins will also recover and we are witnessing just a small retrace. Hold strong as this is the most important part. We will have a very strong new bullish wave develop within days.
As Bitcoin moves to test support, it will reverse to test resistance next. Which one is your top altcoins choice?
Thank you for reading.
Namaste.

BTC whats next ? a reversal in LTF
* **Blue Zone** = Minor bullish support or reaction zone
* **Yellow Zone** = Major bullish order block / demand zone
* **Red Zone** = Bearish supply zone or resistance
---
### 🧠 **Scenario Planning:**
#### ✅ If price **holds above the blue zone**:
* Expect a **bullish continuation**
* Target: **Red zone** (potential resistance or reversal area)
* Could be a scalp long opportunity with SL below blue
#### ❌ If price **breaks below the blue zone**:
* Expect a **drop toward yellow zone**
* Yellow zone could act as **bullish OB** and reversal point
* Possible long opportunity at yellow, targeting red again
---
### ⚠️ Key Considerations:
* Wait for **reaction confirmation** at blue or yellow before entering
* If BTC forms **bullish engulfing or BOS at yellow**, that’s your entry trigger
* Volume and market structure confirmation will strengthen conviction

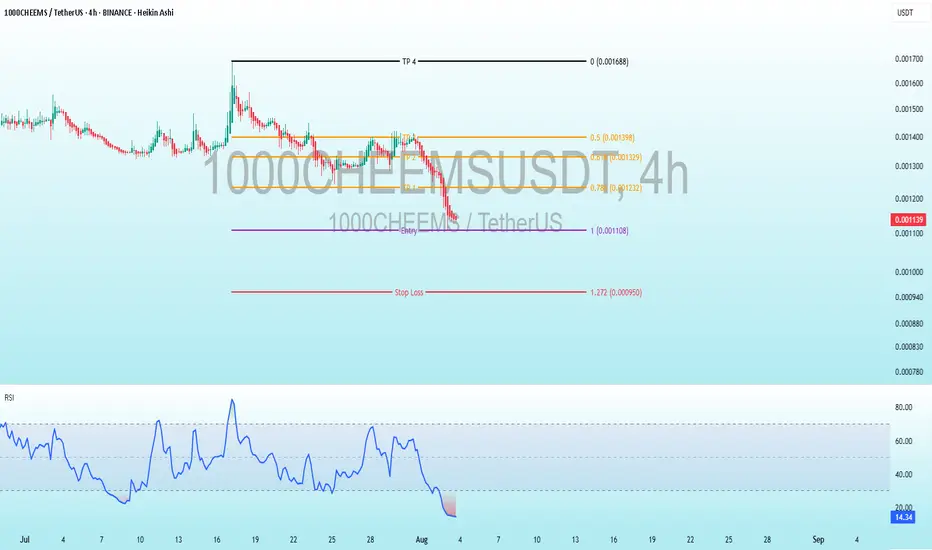
1000CHEEMS Bullish DivergenceBINANCE:1000CHEEMSUSDT
Trade Setup:
Target 1: 0.001232 (0.786 Fibonnaci Golden Zone).
Target 2: 0.001329 (0.618 Fibonnaci Golden Zone).
Target 3: 0.001398 (0.5 Fibonnaci Golden Zone).
Target 4: 0.001688 (0 Fibonnaci).
Stop Loss: 0.000950 (1.272 Fibonnaci).
RSI Analysis: The RSI is showing a bullish divergence, suggesting potential bullish momentum. The current RSI is around 14.36, approaching oversold territory, so caution is advised.
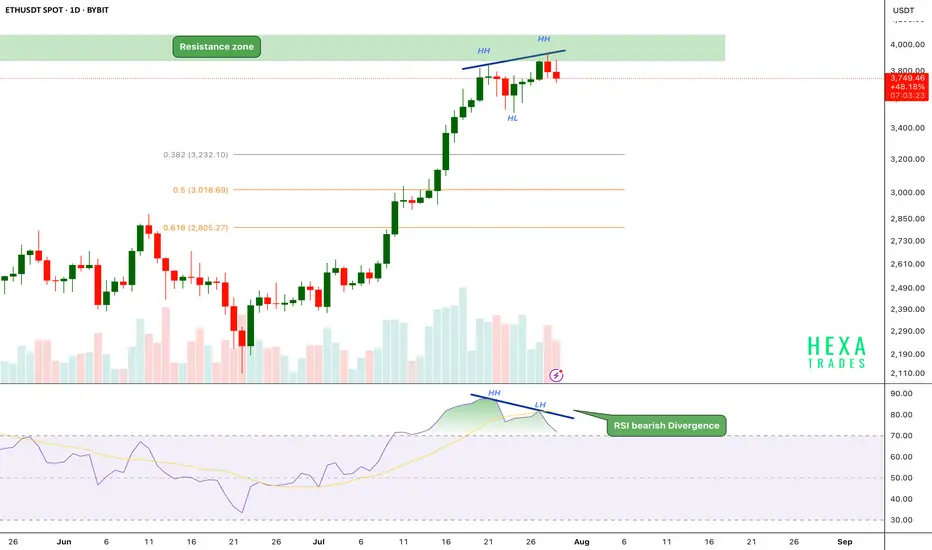
ETH Bearish Divergence!CRYPTOCAP:ETH has been in a strong uptrend, printing consistent higher highs (HH) and higher lows (HL). However, on the daily chart, the price has now reached a critical resistance zone near the $3,800–$4,000 range.
Key Points:
🔸 Bearish RSI Divergence
While price action has formed a new higher high, the RSI has printed a lower high, signaling bearish divergence.
This indicates that upward momentum is weakening even as price attempts to push higher — a common early warning of a possible short-term reversal.
🔸 Fibonacci Retracement Levels
The fib 0.382 at $3240 and 0.5 and 0.618 retracement levels are sitting around $3,000 and $2,800, respectively, potential targets if a correction follows.
🔸 Volume Profile
Volume is gradually declining as price approaches resistance, suggesting buyer exhaustion.
If the price breaks above the $4,000 psychological resistance, we could see a strong bullish move.
ETH is facing strong resistance after a powerful rally, with RSI bearish divergence and weakening momentum hinting at a possible short-term pullback. We should be cautious entering fresh longs here without confirmation.
Support: $3,200, $3,000, and $2,800
Cheers
Hexa
BINANCE:ETHUSDT BITSTAMP:ETHUSD
XRP - IH&SLike I said in my last post, xrp was to hit 2.80. Nailed it. Right on the money!
Now, it seems like we're printing an IH&S. No other real patters are matching up l well. We finally have some liquidity in the market to chart some rough patterns.
I'm seeing a little push up off the bottom BB - to 3.12 ish? But rejection back down to the daily pivot for the right shoulder. And acuminate there prior to any news from the SEC. And then were primed and strapped to a rocket!
But honestly, who really knows what these MM have in store. So stay light on your feet in this area.
Roll them bones for it!

Sequence Analysis on ETH/USD, WE could break out !Sequence Analysis on ETH/USD
Primary Impulse (June 2022–Nov 2023)
Wave 1: Bottom ≈ $989 → top ≈ $2,688
Wave 2: Retrace to ≈ $1,492 (≈ 61.8% Fib of Wave 1)
Wave 3: Advance to ≈ $3,550 (strongest, longest wave)
Wave 4: Pullback to ≈ $2,300 (above Wave 1 high—validates impulse)
Wave 5: Extension to ≈ $5,080 (completes 5-wave structure)
Complex Correction (Dec 2023–June 2025)
W–X–Y Double Zigzag
W: Down from $5,080 → $2,678
X: Relief rally to $3,800
Y: Final decline to $1,155 (below Wave 4 low)
Rule check: Y-wave breaches Wave 4 territory, confirming an expanded correction (Prechter & Frost, 2005).
Current New Impulse (June 2025–ongoing)
Wave (1): Low ≈ $1,155 → $2,400
Wave (2): Shallow retrace to $2,271 (≈ 38.2% Fib)
Wave (3): Strong leg to $3,800+ (exceeds Wave 1 by ratio ≈ 1.61)
Wave (4): Correction to $3,300 (above Wave 1 high, valid)
Wave (5) (projected): Expected to drive above $5,800, targeting regression-line confluence
Key Rules & Ratios
Wave 3 cannot be shortest (here, it is longest)
Wave 4 must not overlap Wave 1 territory (confirmed)
Fibonacci alignments at 38.2–61.8% retracements guide entry zones (Prechter & Frost, 2005)
References
Prechter, R. R., & Frost, A. J. (2005). Elliott wave principle: Key to market behavior (10th ed.). New Classics Library.
Sources

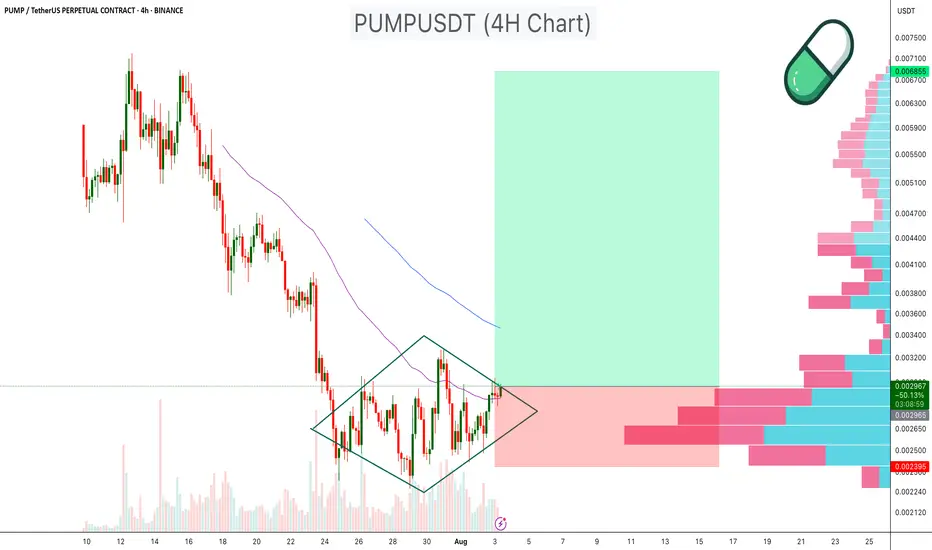
PUMPUSDT Diamond Pattern PUMPUSDT has been consolidating within a diamond chart pattern on the 4 hour timeframe, following a prolonged downtrend. This type of structure signals potential reversal when occurring after a decline.
Diamond Formation: Price is compressing inside converging and diverging trendlines, creating a symmetrical diamond pattern.
Volume Profile Support: Significant volume support is visible in the $0.00240–$0.00250 range, which may act as a strong demand zone.
EMA Resistance: 50 EMA is currently positioned above the price, serving as dynamic resistance.
Breakout Potential: A breakout above the diamond resistance, especially with increased volume, could target the $0.005 –$0.007 zone, representing a major upside move.
Cheers
Hexa
NYSE:PUMP BYBIT:PUMPUSDT
ETH/USD: We in? Not yet!Macro
FOMC held rates at 4.25–4.50% for the fifth consecutive meeting, stressing a data-dependent stance amid mixed economic signals (Reuters, 2025a).
White House to publish a pro-crypto policy report, signaling potential regulatory clarity and institutional inflows ahead (Reuters, 2025b).
Ether has doubled over the past three months and gained 4.5% in the last week, reflecting strong momentum and market breadth (Reuters, 2025c).
Risk Management
Stop-loss: Below key support at 3,237 (0.618 Fib + trendline confluence).
Position sizing: Risk ≤ 1% of account equity per trade.
Risk/Reward:
Target 1: 4,372 (1.236 Fib) → RR ≈ 1.5
Target 2: 5,080 (regression line projection) → RR ≈ 2.5
Trade Setup
Entry: On a daily close above the ascending trendline near 3,400–3,500 with bullish confirmation (e.g., hammer or engulfing candle).
Targets:
Partial profit at 4,372 (1.236 Fib)
Full exit at 5,080 (regression line)
Stop-loss: 3,200–3,230 zone (below 0.618 Fib).
Sentiment Filter: “Here or no trade” — only engage if price respects confluence support.

SAHARA ANALYSIS🔮 #SAHARA Analysis 💰💰
📊 #SAHARA is making perfect and huge rounding bottom pattern in daily time frame, indicating a potential bullish move. If #SAHARA retests little bit and breakout the pattern with high volume then we will get a bullish move📈
🔖 Current Price: $0.1043
⏳ Target Price: $0.1062 and above
⁉️ What to do?
- We have marked crucial levels in the chart . We can trade according to the chart and make some profits. 🚀💸
#SAHARA #Cryptocurrency #Pump #DYOR


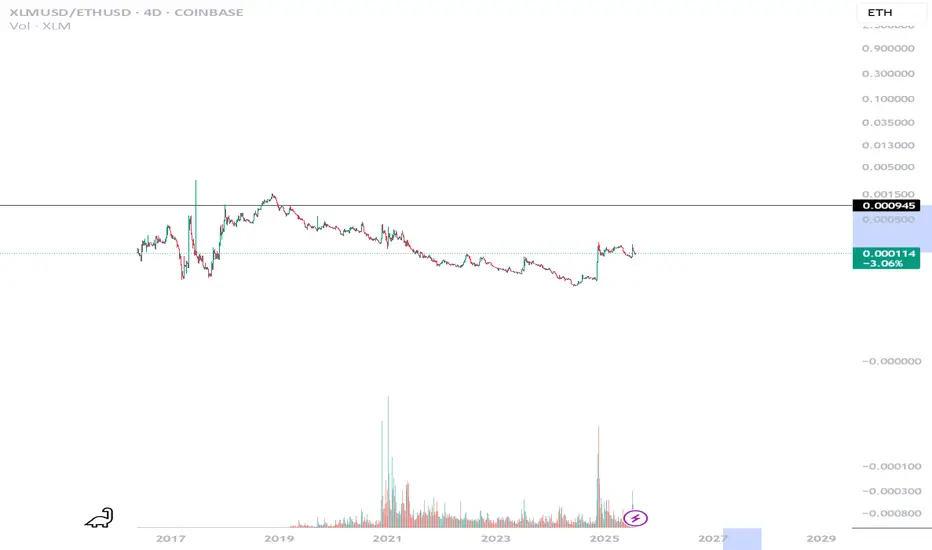
Expect a 730% rally XLM VS ETHThis is a XLM VS ETH Chart, I'm selling for XLM for ETH after XLM runs first expecting 726%
Buy BTCUSD Focus on the $117,500–119,000 levels: a breakout upwards could mean the beginning of growth, a breakout downwards — a strong correction.
Follow the actions of institutional players, flows into ETFs, and political and regulatory news.
Manage risk: BTC remains a volatile asset, the possibility of large peaks and falls remains.

Long trade www.tradingview.com
🟢 Buyside Trade
Pair: LINKUSD
Date: Saturday, 5th July 2025
Time: 8:00 PM
Session: Tokyo Session PM
Time Frame: 4Hr TF Entry
🔢 Trade Metrics
Entry Price: 13.161
Take Profit (TP): 25.814 (+96.14%)
Stop Loss (SL): 12.984 (−1.34%)
Risk-Reward Ratio: 70.32: 1
📈 Chart Analysis
Structure: Price broke the previous consolidation zone and retested key support levels near the 13.16 area before launching upward.
Indicators:
200 WMA (Yellow) & 50 EMA (Blue) both support continuation.
Break of market structure confirmed prior resistance as new support.

Stellar lumens the most bullish chart in all of crypto $4 soonnuff said, if yall don't see whats happening , you hate money.
