BTC Is Heading For At Least 120k level AgainBased on current market movement in my personal humble opinion there’s good chance for btcusd to go up again to test 120k level or the best case another ATH.
The reason behind this is we have complete correction in the form of regular flat (yellow pattern line) and based on this tf (h4) we can spot bullish engulfing price action at the end of possible wave C of the regular flat I have mentioned earlier.
The stop can be below the low pf the latest bullish engilfing candle.
Risk not more than 1%.
If it takes me out then I’ll look for another reenter below as even if the market breaks the low of the regular flat, the bias doesn’t change at all.
Crypto market

A lose Cycle! Sell The Bottom, Buy The Hype!? Why Do You Buy When Everyone Else Is Terrified?
What drives us to make the exact opposite of a rational decision?
Is a crashing market truly a buying opportunity or just a trap?
Hello✌️
Spend 2 minutes ⏰ reading this educational material.
🎯 Analytical Insight on Bitcoin :
BINANCE:BTCUSDT has created strong liquidity with this recent pullback 📉 and is now testing a key daily support level. I’m looking for a potential bounce of at least 5%, targeting around $119,000, near a significant daily resistance 🚀.
Now , let's dive into the educational section,
🌀 Retail Traders: Victims of Hype, Fear, and Noise
Most casual traders sell during a dip, not because of a plan but because of panic. As soon as they see red candles flooding the chart, they react emotionally, not logically. Then, when prices rally and social media is buzzing, they jump back in, usually at the worst possible time. This cycle of buying tops and selling bottoms isn’t random. It is driven by crowd psychology, and unless you recognize it, you’ll keep falling for the same trap again and again.
🧭 No Strategy or Stop Loss Means You’re Gambling
If you enter a trade without knowing where you'll exit, you’re not trading. You’re guessing. A strategy is not optional. It is your foundation. Proper take-profit and stop-loss levels are what keep emotions out of the equation. Traders without a plan either take profits too early or hold onto losses too long, hoping they’ll bounce back. This isn’t trading. This is gambling with extra steps.
🔍 Technical and Fundamental Analysis Work Best Together
Only reading charts without understanding the asset means you're blind to context. Only studying the fundamentals without watching price action means you’re missing timing. Technical analysis helps you pinpoint when to act. Fundamental analysis tells you why to act. The best traders blend both. You find the "what" through fundamentals, and the "when" and "how" through technicals.
⚠️ Buying the Hype and Selling the Panic Hurts
Markets swing between extremes. When your favorite coin is pumping and influencers are screaming 🚀🚀 it might be too late. That is often when smart money exits and retail rushes in. On the flip side, when everyone is doom-posting and charts are dripping red, that is when opportunity quietly appears. But only if you’ve done your homework. It’s not about being a contrarian. It’s about being informed.
🛠 Useful TradingView Tools to Avoid Getting Tricked
To avoid emotional decisions, there are a few essential tools in TradingView that every trader should get familiar with:
Volume Profile
Shows you where the highest buying and selling activity has occurred. It helps reveal the zones where whales might have entered the market.
Fear & Greed Indicator
Gives you a quick sense of the market’s emotional state. When everyone’s afraid, it might just be the right time to start thinking about buying.
Divergence Scanner
Helps you spot potential price reversals before they happen by detecting divergences between price and momentum.
Alerts
Stop checking the charts 24/7. Set alerts on key resistance and support levels so you only react when it actually matters.
Multi-Timeframe Analysis
Don’t stay locked into the 15-minute chart. Use daily and weekly timeframes to understand the bigger picture and avoid short-term noise.
🎯 Final Thought and Recommendation
In this market, the winners aren’t the fastest. They are the most prepared. Build your strategy, manage risk with stop losses, blend technical with fundamentals, and most importantly, don’t let the crowd think for you.
✨ Need a little love!
We pour love into every post your support keeps us inspired! 💛 Don’t be shy, we’d love to hear from you on comments. Big thanks , Mad Whale 🐋
📜Please make sure to do your own research before investing, and review the disclaimer provided at the end of each post.

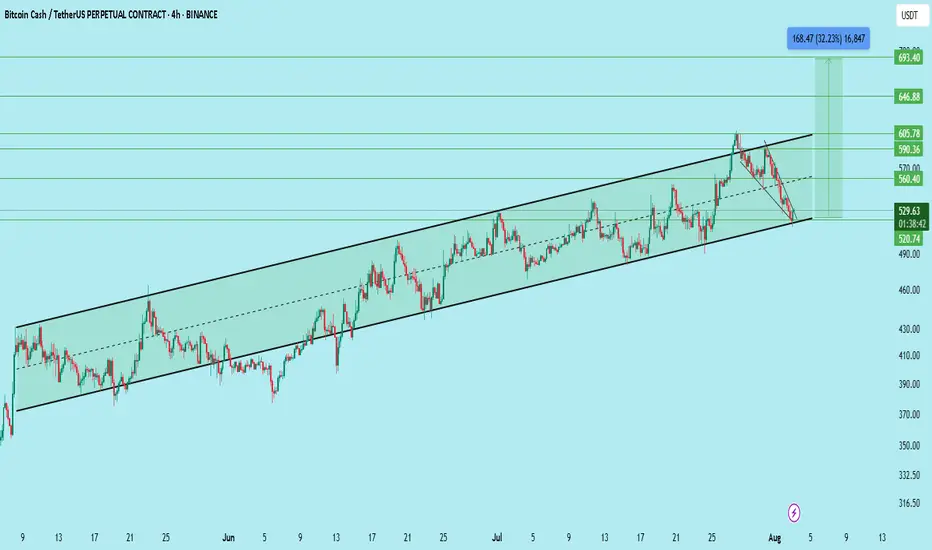
BCHUSDT : Potential Long Setup – Trendline Support Falling WedgeBCH has been trading in a well-defined ascending channel on the 4H chart. After multiple higher highs and higher lows, price recently corrected to the channel support and formed a falling wedge — a bullish reversal pattern.
Current Price: ~$528
Entry Zone: $520–$540
Stop Loss: Below $495 (clean invalidation below channel support)
Targets:
TP1: $560
TP2: $590
TP3: $605
TP4: $646
TP5: $693
Potential Upside: +32% from entry zone
Analysis:
The falling wedge breakout near channel support confirms buyer interest.
Volume drop during the correction phase supports bullish reversal conditions.
Risk-reward ratio favorable near the channel low.
Trade Plan:
Start building position between $520–$540 using DCA. Keep SL below $495. Expect gradual move toward the upper resistance zones if the breakout sustains.
Watch for breakout confirmation above $540–$550 for momentum entry.
DYOR | Not Financial Advice
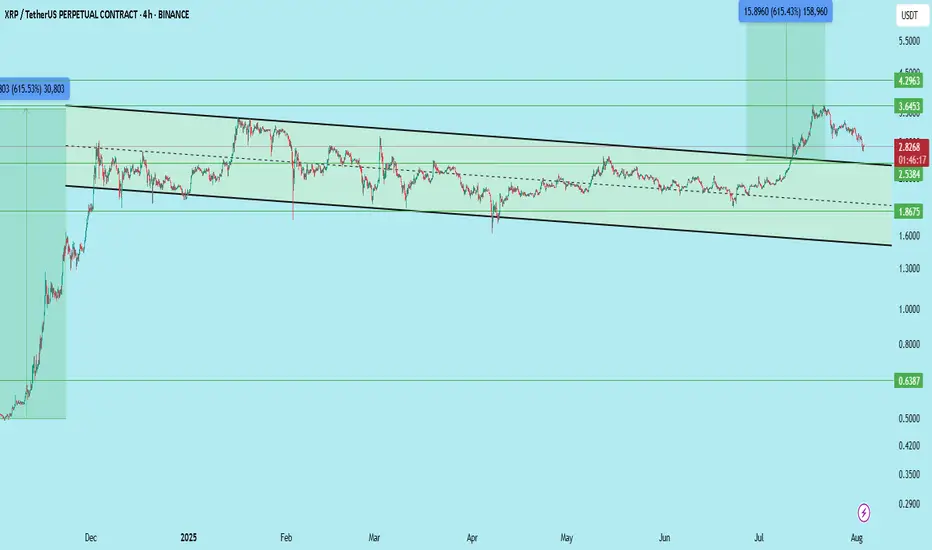
#XRP/USDT – Breakout from Downward Channel | Bullish OutlookXRP has finally broken out of the long-standing downward parallel channel on the 4H chart — a strong bullish signal supported by volume and structure shift.
Falling Channel Structure:
XRP had been consolidating within a well-defined descending channel since late 2024. This structure capped price advances and formed a strong resistance ceiling.
Breakout Confirmation:
Recent price action cleanly broke above the upper trendline with volume expansion, followed by a classic retest of the breakout zone near 2.53, confirming the breakout is valid and not a fakeout.
Volume Analysis:
Breakout was supported by a noticeable increase in buying volume. The retest phase is happening on reduced volume, which is typical for a healthy bullish structure.
Support Zones:
2.53 – Key breakout level and current support
1.87 – Mid-channel level, strong previous base
0.638 – Long-term demand zone (unlikely to revisit unless severe macro breakdown)
Resistance Levels / Targets:
3.64 – Local resistance, recent swing high
4.29 – Major horizontal resistance
Further upside open if macro trend remains bullish
Setup Summary:
Structure: Falling Channel → Breakout → Retest
Entry Zone: Between 2.53 and CMP (~2.83) using DCA
Stop Loss: Below 2.38 to protect against fakeouts
Targets:
TP1: 3.64
TP2: 4.29
Long-Term Open
Why This Matters:
XRP breaking out of a 9-month downtrend indicates a major sentiment shift.
Similar breakouts in the past have led to 600%+ moves, and current structure resembles that setup.
Macro trend shows buyers stepping in with conviction.
DYOR | Not Financial Advice
GOATUSDT Retest at Key Demand Zone – Accumulation or Breakdown?🔍 Comprehensive Technical Analysis
After experiencing a prolonged downtrend since late 2024, GOATUSDT finally broke out of a long-term descending trendline in early May 2025 — a potential early signal of a medium-term trend reversal. However, the price has now pulled back, retesting a major support zone that coincides with the previous breakout structure.
---
🧱 Key Zone: Demand Area + Trendline Retest
Price is currently trading within a crucial demand zone between $0.090 – $0.100, which previously acted as a major resistance and now serves as support. This area is technically significant due to:
Confluence of horizontal support and the retest of the descending trendline.
A previous accumulation zone that led to a breakout.
Clear historical buyer reaction from this region.
---
📐 Price Structure & Pattern
Descending Triangle Breakout: Successfully broken to the upside in May.
Support-turned-Resistance-turned-Support: A classic structure flip.
Horizontal Consolidation: Price is ranging in a narrow zone, indicating either accumulation or distribution.
---
🐂 Bullish Scenario (Potential Rebound):
If the price holds and bounces with increased volume from the $0.090 – $0.100 zone, it could confirm a strong accumulation phase and initiate the next leg up.
🎯 Bullish targets:
1. $0.15745 — Minor resistance
2. $0.21071 — Psychological and technical resistance
3. $0.24889 — Fibonacci extension level
4. $0.41017 — Mid-term breakout target
> Bullish confirmation: Bullish engulfing or hammer candle with high volume from the demand zone.
---
🐻 Bearish Scenario (Breakdown Risk):
If the price breaks below $0.093 and closes with strong bearish volume, this may confirm weakness and trigger a deeper correction.
📉 Downside targets:
$0.06500 — Minor historical support
$0.04900 — Previous base level
$0.03550 — All-time low (critical support)
> Bearish confirmation: Clean breakdown followed by a failed retest back into the range.
---
📊 Strategic Summary:
GOATUSDT is currently at a pivotal decision point. The zone between $0.093–$0.100 acts as a battleground for bulls and bears. A bounce could signal accumulation and a bullish reversal, while a breakdown could lead to continuation of the bearish trend.
🎯 Key focus: Price action and volume reaction at the demand zone.
---
🧲 Bullish Narrative Catalysts:
Renewed interest in low-cap altcoins
Gradual increase in volume since the breakout
Selling pressure weakening near key support
#GOATUSDT #CryptoBreakout #TrendlineRetest #TechnicalAnalysis #AltcoinAnalysis
#DemandZone #SmartMoneyConcepts #BreakoutOrFakeout

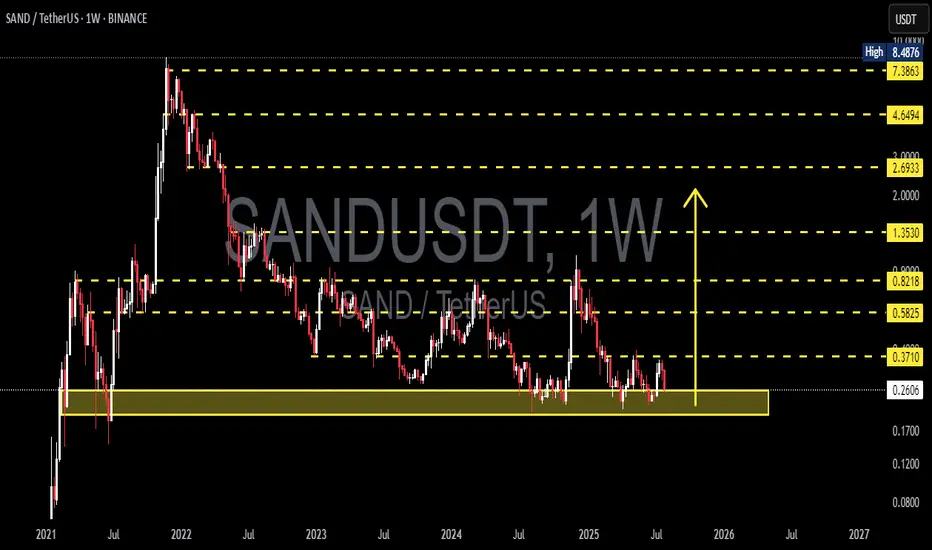
SAND/USDT Analysis – Major Accumulation or Imminent Breakdown?🔍 Overview:
SAND is currently trading at a crucial historical support zone, which has held firm multiple times since mid-2022. The chart shows a prolonged accumulation phase, offering significant potential for a major breakout or a decisive breakdown depending on market reaction.
---
🧠 Price Structure & Price Action:
After reaching an all-time high at $8.4876 in late 2021, SAND has been in a long-term downtrend.
However, over the past year, it has formed a wide base around the $0.26–$0.37 range — a clear sign of potential accumulation.
Price is currently moving sideways in a compression structure, signaling the build-up of energy for the next explosive move.
---
🧱 Key Levels:
Level Function Status
$0.2613 Primary Historical Support Currently being tested
$0.3710 Local Resistance Needs to be reclaimed
$0.5825 Major Resistance Bullish confirmation level
$0.8218 Weekly S/R Flip Mid-range target
$1.3530 Psychological Resistance Potential medium-term target
$2.6933 / $4.6494 Expansion Phase Targets Long-term upside potential
$7.3863 Pre-ATH Resistance Late-cycle target
---
🟢 Bullish Scenario:
1. If price holds and bounces off the $0.26–$0.37 demand zone, a bullish reversal may unfold.
2. A weekly close above $0.3710 would be the first sign of strength.
3. Breaking $0.5825 with solid volume would confirm trend reversal and open the path toward $0.82 – $1.35.
📌 Additional Bullish Confirmation:
Bullish divergence on RSI (if present)
Increasing volume during upward moves
---
🔴 Bearish Scenario:
1. A clear breakdown below $0.2613 on the weekly timeframe would signal a loss of major support.
2. This opens downside risk toward:
$0.17
$0.12
Possibly even $0.08 if the market seeks a deeper revaluation.
3. Such a move would likely represent a full structure reset.
📌 Additional Bearish Confirmation:
Strong bearish candles with high volume
Weak or no bullish reaction within the demand zone
---
🔁 Formations in Play:
Accumulation Rectangle: A sideways range often found at market bottoms before new bull cycles.
Multi-year Base Formation: Can serve as a launchpad for major parabolic moves if resistance is broken.
---
📚 Conclusion:
SAND is at a make-or-break zone. The market is coiled like a spring — preparing either for a new bullish expansion or for further downside pain. Smart traders and investors will:
Wait for breakout confirmation
Or exit positions on breakdown signals
This is a golden zone for preparation, not reaction.
---
📌 Suggested Trading Plan:
✅ Bullish Bias: Scale in within support zone; tight stop below $0.26
❌ Bearish Bias: Short only after weekly close below $0.26
🧠 Neutral/Waiting: Let the market prove itself
#SANDUSDT #CryptoBreakout #AltcoinAnalysis #TechnicalAnalysis #MetaverseToken #SupportZone #BullishScenario #BearishOutlook #SmartMoneyAccumulation #CryptoTA #AccumulationPhase
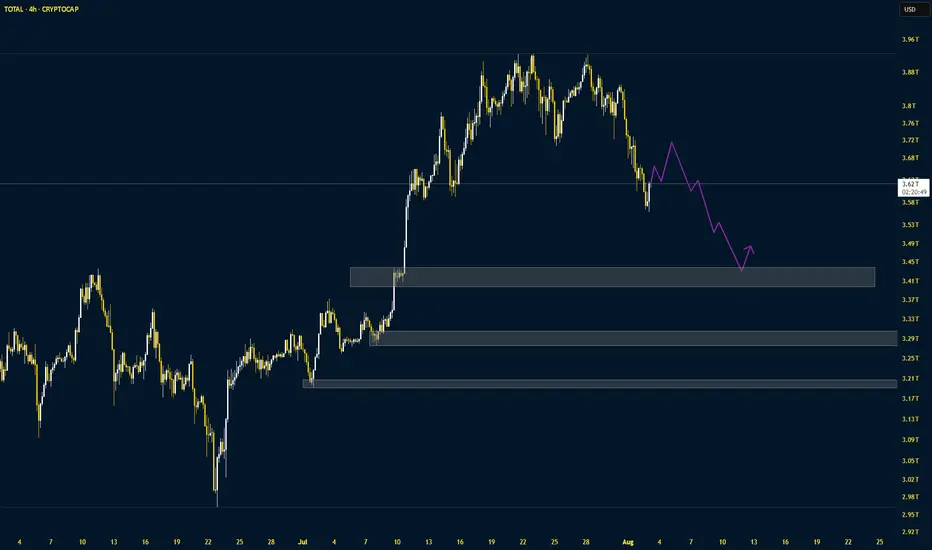
Crypto Total Market CapThe market is correcting at a very fast pace. The correction pattern could be 5-3-5. The following supports are important
Ethena Bullish Momentum Builds, Eyes 30% Rally to $0.85Hello✌
Let’s analyze Ethena’s upcoming price potential 📈.
BINANCE:ENAUSDT has demonstrated strong bullish momentum recently, supported by positive fundamental developments 📈. The price is currently near key daily and Fibonacci support levels. If these hold, a potential 30% upside targeting $0.85 looks likely 🚀.
✨We put love into every post!
Your support inspires us 💛 Drop a comment we’d love to hear from you! Thanks , Mad Whale

Watch Uniswap’s $10 Defense For 16% Breakout Toward $12.5Hello✌
Let’s analyze Uniswap ’s upcoming price potential 📈.
BINANCE:UNIUSDT is currently trading near a key confluence zone that includes the psychological round number of 10, a daily timeframe support level, and a Fibonacci retracement area. If this zone holds, there is potential for a 16% upside move toward the 12.5 level , making it a setup worth monitoring in the coming sessions. 📊🔍
✨We put love into every post!
Your support inspires us 💛 Drop a comment we’d love to hear from you! Thanks , Mad Whale

CFX Bulls Eyeing 38% Surge Toward Explosive 0.29 TargetHello✌
Let’s analyze Conflux’s upcoming price potential 📈.
BINANCE:CFXUSDT has shown solid bullish momentum recently, supported by a series of positive fundamental catalysts 📈. Price is now approaching a daily support zone that also aligns with a key Fibonacci retracement level. If this level holds, I’m expecting a potential move of around 38% to the upside, with a mid-term target near 0.29 . Watching closely for price action confirmation around support before considering entry 🚀.
✨We put love into every post!
Your support inspires us 💛 Drop a comment we’d love to hear from you! Thanks , Mad Whale

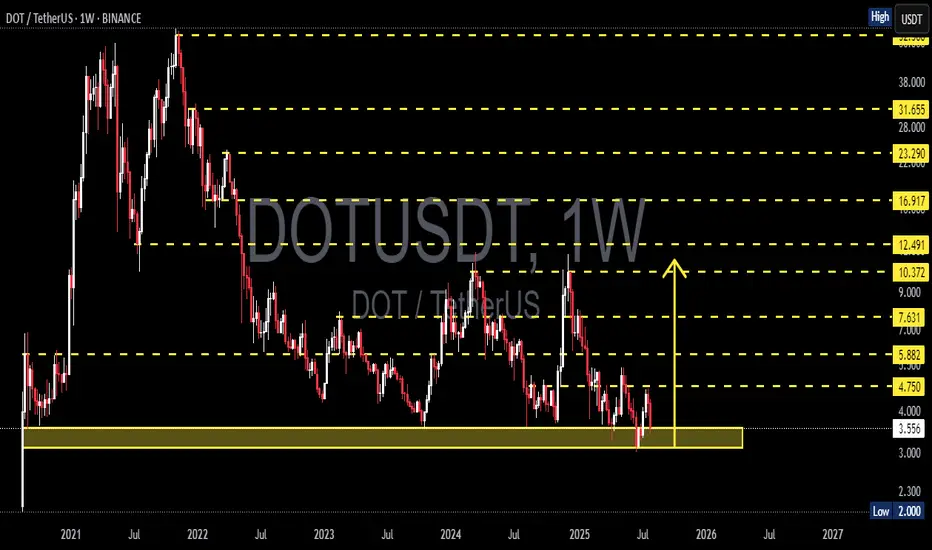
DOTUSDT On the Edge of a Major Rebound or a Devastating BreakdowPolkadot (DOT) is once again retesting one of its strongest macro support zones between $4.00 – $3.55, a historically significant demand area that has provided major price bounces since mid-2022.
This isn’t just a random level—it’s a critical accumulation base where large buyers have consistently shown interest. With price now hovering around this zone again, the next move could be decisive for DOT's mid- to long-term trend.
---
🔍 Price Structure & Key Patterns
Extended Accumulation Phase: DOT has been trading in a sideways range for over 80 weeks, indicating a potential bottoming structure forming after a prolonged downtrend.
Strong Historical Demand: The $4.00 – $3.55 region has acted as a key support multiple times since 2022, reinforcing its importance as a make-or-break zone.
Potential Trap Setup: Current price action could be forming either a bull trap or bear trap, depending on whether price rebounds or breaks down. Weekly candle confirmation will be key.
---
🟢 Bullish Scenario (Upside Reversal)
If price holds and prints a strong bullish candle (e.g., bullish engulfing or long-tailed hammer), expect the following upside targets:
Short-term: $4.75 – $5.88
Mid-term: $7.63 – $9.00
Long-term: $10.37 – $12.49, aligning with prior distribution zones
✅ A breakout from this long accumulation base could trigger a massive short squeeze and renewed buying momentum.
---
🔴 Bearish Scenario (Breakdown)
If DOT closes below $3.55 on the weekly chart:
Confirms breakdown from macro support
Opens downside risk toward $2.30 – $2.00
Would print a new lower low, extending the bear market phase and potentially triggering capitulation
⚠️ Speculative long positions should include tight risk management below $3.50.
---
🧠 Market Sentiment & Strategy
DOT appears to be in a "Capitulation meets Hope" phase—selling pressure is exhausting, but bullish conviction hasn't yet taken control.
Ideal entry zones lie within the current demand range, with tight stops.
Watch for a daily breakout or bullish momentum confirmation next week before committing to positions.
---
📌 Final Takeaway
> DOT is standing at the edge of a cliff—or a launchpad. The $3.55–$4.00 zone has repeatedly been the foundation for rebounds. If history repeats, this may be the beginning of a new uptrend. If not—brace for deeper downside.
⏳ The market is watching. Will DOT break out… or break down?
#DOTUSDT #Polkadot #CryptoTechnicalAnalysis #SupportResistance #CryptoRebound #BearishOrBullish #AltcoinOutlook #CryptoBreakdown #WeeklyChart #AccumulationZone #DOTAnalysis

Bitcoin buy setupHi everyone.
I think this area has a good potential to set an order and take at least 1% profit out of it..
Let's see how it reacts to this level...
Please consider the risk management.
Goodluck
BTC Bear Divs5 hidden bear Divs on yesterdays daily. 2 wicks on the 50MA. If the engulfing holds, nice setup for a reversal with a target of 130 +/- by EO August.

SOLUSD- Has a long-term sport between 155 and 158Technical Analysis by AI
💵 Current Price & Market Context
• SOL trading around $158–$160, down about 2–3% today, still down ~14% from last week’s top near $180+.
🧭 Trend & Momentum
• RSI near 41–47 → not oversold but on the lower side.
• MACD still leaning bearish. Momentum: neutral to slightly bullish across indicators.
🛠️ Support & Resistance
• Immediate support at $160, stronger support at $154.
• Resistance at $172–$176, bigger barrier around $180–$190.
📈 Pattern Behavior
• Still holding an ascending channel, currently sitting near the lower band.
• Failed breakout at $180–$190 means that’s a hard ceiling unless broader market turns bullish.
⸻
✅ Trade Thoughts Based on This
Aspect
Bias Neutral to bearish short-term
Entry Zone Valid? Yes, $156–158 is still solid
Key Level to Watch
$154 — if breaks, downside likely
Upside Potential Target $172–176 short term
Breakout Ceiling $180+ tough without volume/sentiment
⸻
🧭 What You Should Do Now
• You’re in near $156–158 → good spot as long as $154 holds
• If price dips to $154 and bounces: still valid
• If breaks $154: prepare to cut, next support is ~$145
• If price moves above $170: momentum could take it to $176+
• Don’t chase anything. Wait for volume or bounce from support

The Great Trap: How Billionaires Are Winning, and You're Not!The Great Crypto Trap: How Billionaires Are Winning—And You're Not
The ETFs, Saylor, and all of Trump's billionaire friends are getting richer—thanks to crypto.
Meanwhile, most retail traders are just trying to stay above water. Leverage trades are wiped out, charts feel rigged, and the market makes you feel like you're swimming against a riptide.
Why?
Because these rich guys have a plan: manipulate you and take your money. That’s how they stay rich.
Understanding their strategy is the first step to stop being their exit liquidity.
🧠 The New Battlefield
Crypto is no longer a playground for cypherpunks and tech rebels. It’s fully institutional now. We're not just trading against whales—we're fighting the same entities that own the media, control Wall Street, and write the rules.
So forget the old ways of thinking. The tables have turned.
🗓 The Sunday Rekt Routine
To maximize destruction, they need to avoid friendly fire. So they pump on the weekend when retail is free and optimistic, then dump on Monday to close the CME gap—like clockwork.
The playbook:
Weekend: Pump. Trap your long.
Monday: Dump. “Fill the gap.” Liquidate everyone.
Response:
Don’t fall for weekend FOMO. Exit Sunday afternoon. Wait until Tuesday to re-enter, once Monday’s high and low are set. Trade smart, not emotional.
📈 Top-of-the-Market FOMO
You’ve seen it before. Just before the crash, the media frenzy begins. Influencers say “Don’t miss this pump!” or “99% will miss the next big move!” The ETF gods hint at new inflows. It's a setup.
They're not hyping it for your benefit—they're offloading their bags in your face.
Just look at the charts:
BlackRock bought billions to drive BTC to 121K.
Then, in 72 hours, they dumped billions.
Saylor? Silent. No new buys. That’s not coincidence—it’s coordination.
Response:
Check the MACD, RSI, and Stochastic RSI on daily or weekly timeframes. If they're maxed out and the influencers are screaming green—it’s probably too late.
When they stop buying, the dump is already planned.
🧰 How to Outsmart Them
Watch the MACD for crossovers and divergence.
Monitor RSI zones—don’t long into extreme overbought conditions.
Use Stoch RSI to anticipate momentum shifts.
Rule: When everything is overheated, and FOMO is peaking—step back. Let them dump into each other. You’ll get your entry later, cleaner and cheaper.
⚔️ This Is War
Make no mistake: this is a war for your money.
They want yours. You want theirs.
Only the smart survive.
To be continued.
DYOR.

mBos 15mWe came to 4h OB, swiped some liquidity and received a reaction. Expectations for the price to return back to the wick and continue up to take the liquidity there. As there is no break on the HTF, it is a trade with higher risk.
Entry on the test of 15m wick. Stop below wick. Take on the swim of EQH

Pengu - After a 33% dump, Pengu approaches my 1st TargetI anticpate T1 will be hit in the coming days/weeks.
But I will be holding out for T2, for a more ideal entry.
The streets aren't bloody enough yet.
May the trends be with you.

BTC NEW LOOKBtcusd sell from 115,000
Target1 114,000
Target2 112,000
Target3 110,000
Stope Lose 116,500
TRADE AT YOUR OWN RISK

INITUSDT at a Crossroads: Bounce or Break Break Down?📊 Comprehensive and Relevant Analysis
On the 12-hour timeframe, the INIT/USDT pair is currently retesting a crucial demand zone between $0.3500 – $0.3685. This zone previously acted as a strong support that triggered a sharp upward move in mid-July.
Now, price is sitting just above the lower edge of that demand box — a critical moment that could dictate the short- to mid-term trend.
---
🐂 Bullish Scenario (Potential Rebound):
Price has tested the $0.35 - $0.3685 zone multiple times and continues to reject further downside.
A micro higher low structure is forming inside the demand zone, indicating that buyers may be regaining control.
If a bounce occurs and price breaks above the minor resistance at $0.4045, the next upside targets are:
$0.4805 – previous consolidation area
$0.5843 to $0.6421 – historical high-volume zones
Confirmation will be stronger if a bullish engulfing, hammer, or volume spike candle forms at this level.
---
🐻 Bearish Scenario (Breakdown of Support):
If price closes convincingly below $0.35, the demand zone will be invalidated.
This could trigger a continuation of the downtrend toward:
$0.3000 – next psychological support
Possibly as low as $0.2650 – the major long-term support
A breakdown will confirm a new lower low structure, validating seller dominance and increasing bearish momentum.
---
📐 Visible Patterns and Structures:
Range Consolidation between $0.35 – $0.48: suggests either accumulation or distribution before a breakout.
Descending Channel on the mid-term structure: indicates a controlled bearish trend.
Potential Double Bottom: if the price bounces and reclaims $0.48, a reversal pattern may play out.
Support Zone Compression: repeated hits to the same support often lead to a break if buyers lose strength.
---
📌 Key Takeaway:
INIT is currently at a decision point. This level is known to precede large directional moves — either a strong bounce or a significant breakdown.
📉 A confirmed breakdown below the demand zone = a strong short setup.
📈 A bullish reaction with volume and reversal signals = a potential buy opportunity.
Traders should wait for confirmation from the next few candles and watch for reaction volume before committing to a position.
#INITUSDT #CryptoAnalysis #DemandZone #BreakoutOrBreakdown #AltcoinWatch #SupportAndResistance #VolumeAnalysis #TechnicalOutlook #PriceActionSetup #CryptoTrend

BTCUSD ideaWe are waiting for our asset to reach our action zone, and based on the reaction, we’ll decide on our next moves.ALWAYS WAIT FOR A CONFIRMATION TO SEE IF THE PRICE VALIDATES THE ZONE.and you what is your vision of the EURUSD its interests me! i wait you in the commentary

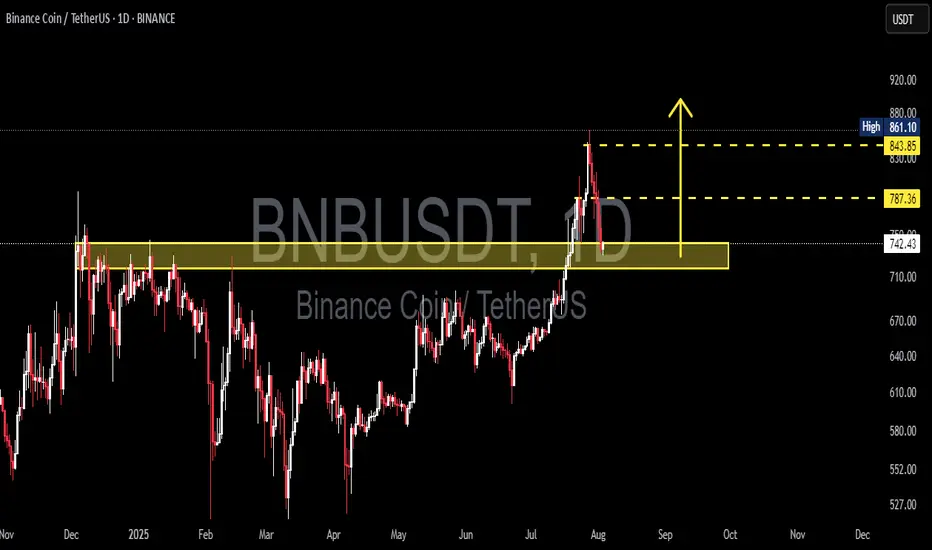
BNBUSDT Critical Retest in Progress📊 Comprehensive Analysis:
BNB/USDT has finally managed to break out of a major consolidation range that lasted over 6 months, with the key resistance zone between $730 and $750 acting as a strong ceiling since late 2024.
The breakout in late July 2025 was supported by a noticeable increase in volume, signaling strong accumulation and a possible shift from a ranging market to a bullish trend.
Now, the price is revisiting this previous resistance — a crucial retest zone that will likely determine whether this move is sustainable or a potential bull trap.
---
🔍 Key Price Levels Identified:
🟡 Retest Support Zone (Previous Resistance):
$730 – $750 → A critical area that must hold to maintain the bullish market structure.
🟡 Minor Resistance:
$787.36 → Recently rejected, this is the next short-term barrier that bulls must break.
🟡 Major Resistance (Swing High):
$843.85 → Key historical level before reaching the recent local high.
🔵 Recent Local High (Potential Double Top or Breakout):
$861.10 → A break above this level could open the doors to fresh highs.
---
✅ Bullish Scenario:
If BNB holds above the $742.36 level and prints a strong bullish reversal candle (e.g., pin bar or bullish engulfing), the retest can be considered successful.
Next upside targets:
🎯 $787.36 → Immediate resistance
🎯 $843.85 → Key swing high
🎯 $861.10 → Local high
🎯 $900 psychological level → If momentum and volume persist
Look for decreasing volume during retracement and surging volume on breakout to confirm bullish continuation.
---
❌ Bearish Scenario:
If the price fails to hold above $742.36 and breaks down below $730, this may confirm a false breakout (bull trap).
Downside targets could include:
⚠️ $710 – $690 → Minor demand zone
⚠️ $660 – $640 → Historical support within the previous range
A bearish confirmation would come from a lower high formation followed by a strong bearish breakdown candle with increasing volume.
---
📈 Chart Pattern & Price Structure:
The breakout indicates a bullish continuation pattern.
Potential formation of a Bullish Flag or an Ascending Channel, if support holds and consolidation continues above $740.
No major signs of distribution yet — the structure remains healthy and bullish.
---
🧠 Strategic Summary:
> The market has shown strong bullish intent, but it is now at a critical retest phase. Holding this zone could ignite the next leg up. Failure to do so, however, may signal a reversal or deeper correction.
For swing traders, the $730–$750 zone is a golden pocket for potential entries with tight risk management. For conservative traders, a confirmed breakout above $787–$843 offers a safer opportunity.
#BNBUSDT #BNBAnalysis #CryptoBreakout #Altcoins #TechnicalAnalysis #PriceAction #SupportResistance #BullishScenario #BearishScenario #CryptoTrading #BinanceCoin #SwingTrading
sell pullback wave 4🌀 Elliott Wave Analysis Overview
The chart shows a completed major Wave (3), followed by an ongoing correction forming Wave (4).
Inside Wave (5), there is a clear 5-wave impulsive structure (labeled 1 to 5 in red).
After the peak at subwave 5, the market entered an ABC correction (labeled A, B, C in red):
Wave A marked the initial drop,
Wave B a brief retracement,
Wave C is currently developing and may still continue.
📉 Rising Wedge & Breakdown
A rising wedge pattern formed and broke to the downside — typically a bearish signal.
Current price (around $113,813) sits below the resistance zone at $115,000–$120,000.
If the correction deepens, major support lies at:
$102,548 (key support level),
$100,000 (psychological level),
And deeper Fibonacci projections (2.618 to 4.886 extension) between $89,000 to $83,000 — potential completion zone for Wave C.
🚀 Next Move Expectation
If Wave C is complete, BTC could launch into the next impulsive Wave 3 of a larger cycle, targeting:
$120,000
$123,879
Or possibly higher as Wave (5) unfolds.
🔍 Summary
This chart suggests Bitcoin is at a critical turning point:
Either it bounces from current support to start a new impulsive move up (Wave 5), or the correction extends deeper into the Fibonacci zone before a real bullish continuation.
