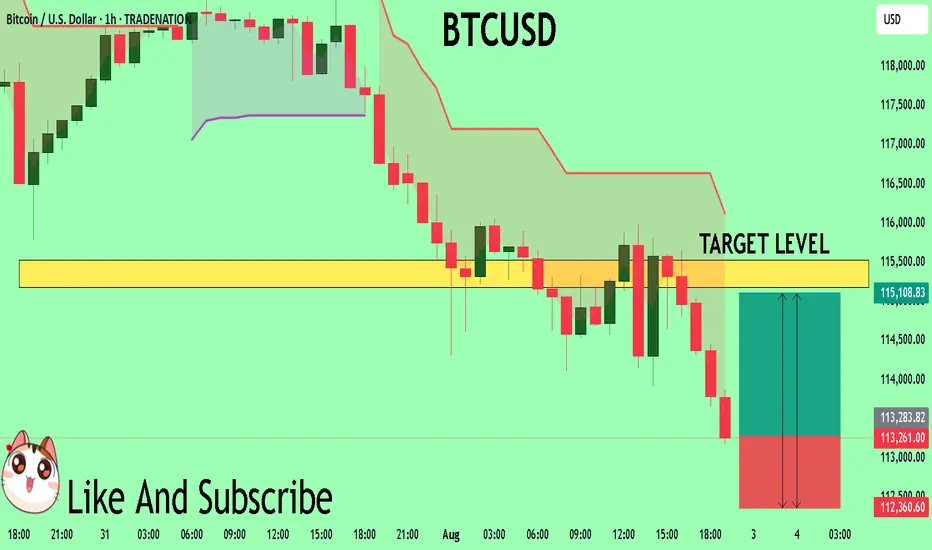
Is it time to buy BITCOIN now?My previous analysis of reaching $112,000 was correct and now Bitcoin is around $113,000. Is it time to buy now? The answer is no because the price has not yet stabilized and other news may push the price below 112,000. Also, the NEW RSI indicator has not yet crossed its moving average.
Crypto market

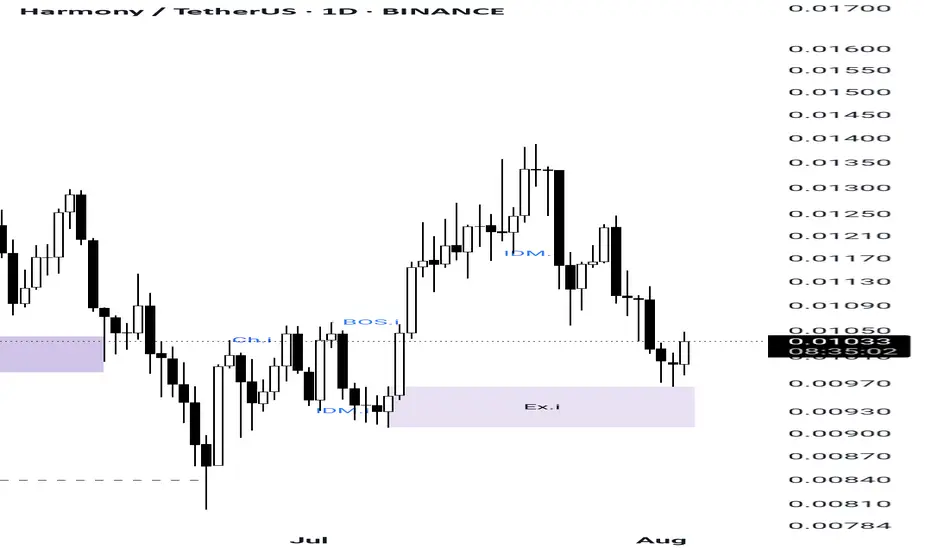
Harmony(ONE) is going to pump...As you can see in ONE Structure it made a minor structure and price touched its minor EX orderblock and for sure it made a SCOB confirmation
So now its ready to pump...
It's my own analysis and it's not investment advise , so DYOR
Solanawe can see price, going in perfect channels all price level are golden levels, So we look to buy dip between 137 and 145, next target will be 220$

BTC ShortAiming for some downside liquidity currently .
First take profit - 0.62 fib
Second take profit - 1 fib

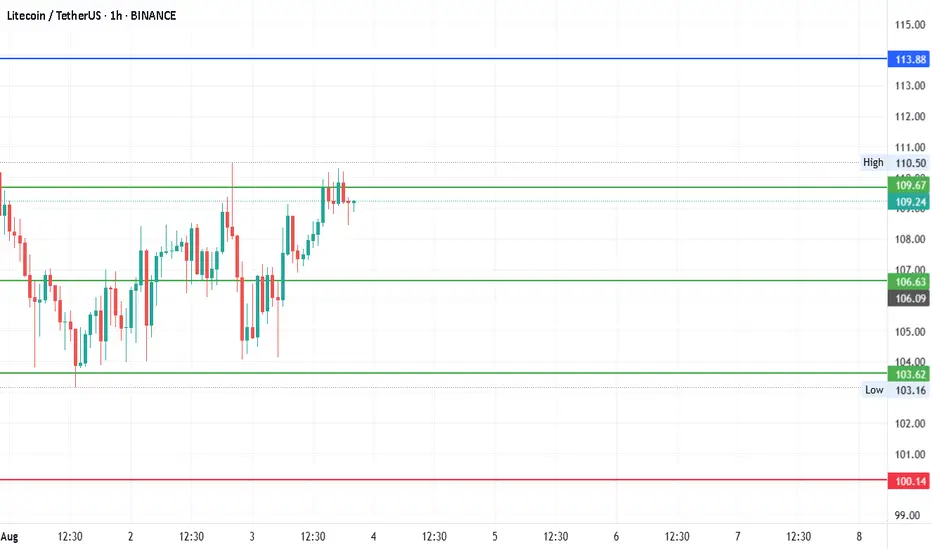
#LTCUSDTDate: 03-08-2025
#LTCUSDT - Current Price: 109
#LTCUSDT Pivot Point: 107 Support: 104 Resistance: 110
#LTCUSDT Upside Targets:
Target 1: 113
Target 2: 117
Target 3: 120
Target 4: 124
#LTCUSDT Downside Targets:
Target 1: 100
Target 2: 97
Target 3: 93
Target 4: 89
#Crypto #Bitcoin #BTC #CryptoTA #TradingView #PivotPoints #SupportResistance
#TradingView #Nifty #BankNifty #DJI #NDQ #SENSEX #DAX #USOIL #GOLD #SILVER
#BHEL #HUDCO #LT #LTF #ABB #DIXON #SIEMENS #BALKRISIND #MRF #DIVISLAB
#MARUTI #HAL #SHREECEM #JSWSTEEL #MPHASIS #NATIONALUM #BALRAMCHIN #TRIVENI
#USDINR #EURUSD #USDJPY #NIFTY_MID_SELECT
#SOLANA #ETHEREUM #BTCUSD #MATICUSDT #XRPUSDT #LTCUSDT
BTCUSD--Short-03-08-25--After last week, expecting price will move down further to monthly support-1 and monthly support-2

Potential 4H Head and shouldersA potential h&s could be shaping, the daily trend is down but the weekly chart is looking for support.

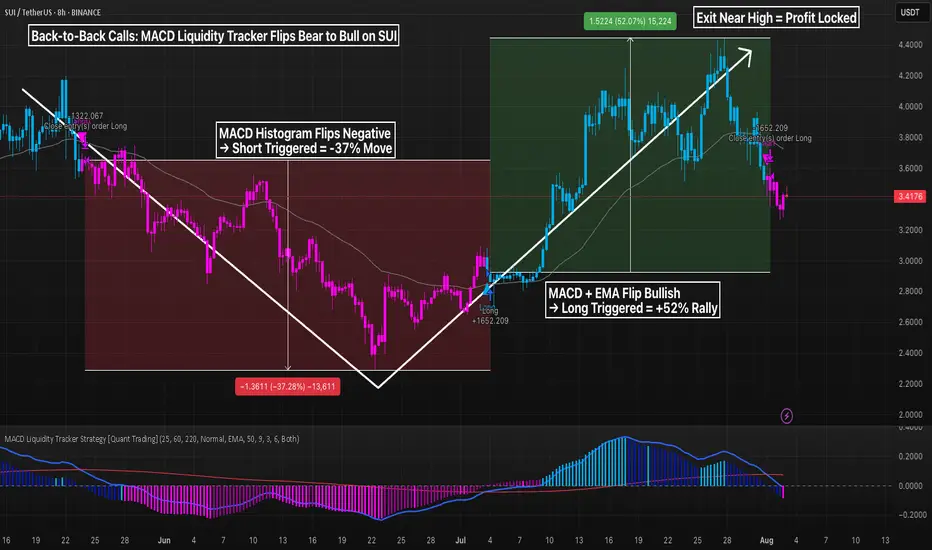
Back-to-Back Calls MACD Liquidity Strat-> Bear to Bull on SUIWhen the market flips, most traders get stuck holding bags.
Not here.
The MACD Liquidity Tracker Strategy flipped short near the top and long near the bottom — catching a clean -37.28% drop followed by a +52.07% rally on SUI 8H.
Here’s how it works:
– EMA filter confirms direction
– MACD histogram + crossover signals timing
– Strategy waits for true momentum before flipping
You don’t need to predict the bottom. You need a tool that reacts fast enough to capture moves, but slow enough to ignore noise.
⚙️ Settings Used:
– MACD: 25 / 60 / 220
– EMA Filter: 50 / 9 / 3
– Entry Mode: Both (Histogram + Crossover)
This is what smart automation looks like: fewer trades, more clarity, and real trend capture.
BTC, ETH & Market Structure Outlook – Is the Pullback Over or Ju
💎🚀 BTC, ETH & Market Structure Outlook – Is the Pullback Over or Just Beginning? 🔥♦️
🧠 Dow Theory | Multi-Cycle Technical Breakdown | Index Watch
👉 Don't forget to LIKE, FOLLOW, and COMMENT to support the content!
♦️ BTC/USDT Analysis
🔻 The key support at 115,725 was broken – but has the macro trend turned bearish? Not yet.
📉 From the HWC (1D) perspective, BTC has dropped only ~4.5%, which still looks like a pullback.
🟥 However, if price stabilizes below 109,000, we will begin shifting to a bearish macro bias.
🧠 Weakness in trend is present but not confirmed.
🔄 MWC (4H) – Sideways, Then Breakdown
📊 After a strong rally, BTC ranged for about 17 days, then broke below the range support.
🔽 The 4H trend leans bearish, but it's not a strong or confirmed downtrend.
⏱️ LWC (1H) – Clearly Bearish
📉 Lower highs and lower lows are forming. The trend is decisively downward in 1H.
🚀 Bullish Scenario:
If BTC bounces from 112,000, we need:
• A strong new high
• A healthy pullback
• A breakout of the new high → then long entries are valid
❗ Bearish Scenario:
If 109,000 breaks with volume → strong bearish continuation likely.
♦️ ETH/USDT Analysis
🔸 The 3538 level is key.
✅ If ETH shows clear reaction, followed by a breakout, a long position becomes valid.
⚠️ But only after a confirmed trend shift on the 4H timeframe.
♦️ Top Altcoins
⭕ Most alts are in an uncertain phase.
🕒 It's best to wait until new highs/lows and a valid structure are formed.
♦️ BTC Dominance (BTC.D)
💥 BTC.D broke through the critical 62.22 level.
🟡 Now we wait: Will it hold above or fake out and reverse?
🔻 If BTC is dropping while BTC.D is rising →
👉 Result: BTC drops moderately, but alts drop much harder.
♦️ USDT Dominance (USDT.D)
📉 This chart reflects market fear & greed.
Currently showing reduced greed (risk-off behavior).
🔸 Next resistance levels: 4.63 and 4.72
❗ If these break → bearish bias becomes dominant.
⭕ However, a fakeout here could create a fast early entry opportunity.
♦️ TOTAL Market Cap
📍 Market is sitting on a major support level – but BTC remains the key driver.
❗ No confirmed long setups until BTC structure shifts bullish.
♦️ Strategic Outlook
1️⃣ Not a good time to open fresh positions – wait for clear 4H structure formation
2️⃣ Bias remains bullish overall, but waiting for confirmation
3️⃣ Until BTC trend clearly reverses, we are not focused on BTC.D reversals – they remain secondary
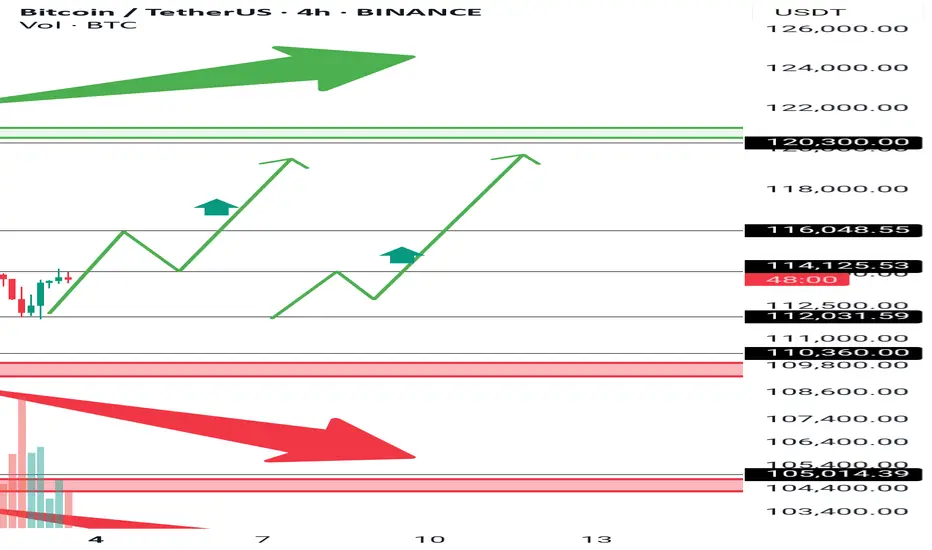
4️⃣ On the Bitcoin chart, you can see another red zone — breaking the first one will invalidate the bullish outlook, and breaking the second one will trigger a search for short positions.
5️⃣ To return to a strong uptrend, breaking the green zone around 120,000.00 is essential.
6️⃣ I’ve drawn two green upward paths on the chart. I’ll be looking for such a path for an early long entry.
💎 Stay cautious, manage risk, and follow structure!
🚀 Smash that ROCKET, leave a LIKE, and hit FOLLOW for daily crypto insights!
TradeCityPro | Bitcoin Daily Analysis #143👋 Welcome to TradeCity Pro!
Let’s dive into the Bitcoin analysis. Today, the weekly candle will close and the market will return to its normal condition starting tomorrow. It’s very important to have a solid analysis today so we can make profits in the upcoming week.
⏳ 4-Hour Timeframe
Yesterday, Bitcoin had another short drop and wicked down to around the 111747 zone, but then returned above the 0.618 Fibonacci level.
💥 Even from this timeframe, it’s clear that a long trigger has formed on lower timeframes, and it seems like a V-pattern is being formed, which we’ll analyze in the lower timeframes.
📊 If the market activates the long trigger today, I’ll try to enter so I don’t miss out in case a bullish move starts with the new weekly candle and I can have an open position.
✔️ The RSI oscillator also entered the oversold zone yesterday and exited it. Since Bitcoin is still above the 110000 zone, I still view the trend as bullish. So this double bottom that formed on the RSI is a very good sign for bullish momentum in the market.
⏳ 1-Hour Timeframe
In the 1-Hour timeframe, we had a short trigger at the 114560 zone in the previous analysis, which was activated and the price moved down. I had mentioned in that analysis that I wouldn’t open a short position with this trigger, and I didn’t.
🔽 Now the position of that trigger has shifted and moved to the 114028 zone. Today I’m watching the market closely, and if the price moves up toward this trigger with increasing volume, I’ll open a long position if 114028 breaks.
🔍 This is one of those positions where you can use either a small or large stop loss. If you go with a larger stop, you can ride the next bullish leg that may push the price back toward the 120000 zone. But if you go with a smaller stop, it becomes a short-term trade that will be closed with smaller risk-to-reward ratios.
📈 Personally, I prefer to go with a larger stop loss so that if Bitcoin starts another bullish leg, I can have a well-positioned entry. (Just make sure to practice proper risk management — I personally won’t risk more than 0.25% on this position since the main momentum hasn’t entered yet.)
💫 As for short positions, I won’t provide any triggers for now because I’m not opening shorts myself, and if you open one, I won’t be able to guide you on what to do with it.
❌ Disclaimer ❌
Trading futures is highly risky and dangerous. If you're not an expert, these triggers may not be suitable for you. You should first learn risk and capital management. You can also use the educational content from this channel.
Finally, these triggers reflect my personal opinions on price action, and the market may move completely against this analysis. So, do your own research before opening any position.

Monero short to 288.65 todayJust now opened a short position on monero.
Aiming for 288.65
SL: 297.72
Tp: $288.65

ETH 4H – MACD Histogram Caught The 54% Increase, Did You?The MACD Liquidity Tracker Strategy doesn’t just catch trends — it shows you how strong they are. On this ETH 4H chart, a textbook move unfolds:
🔹 Histogram flipped positive → Long entry triggered
🔹 Rising bars = building momentum
🔹 Tallest bar = momentum peak (July 21)
🔹 Shrinking bars signaled a weakening trend before price ever reversed
🔹 Histogram turned negative → clean exit at the top
The MACD histogram is a direct visual of momentum:
– Bars rising = acceleration
– Bars shrinking = exhaustion
– Crossing below 0 = confirmation of reversal
⚙️ Strategy Settings:
– MACD: 25 / 60 / 220
– EMA Filter: 50 / 9 / 3
– Entry Mode: Histogram + Crossover Combo


#Bitcoin Sunday Update $BTC bounced from the $112,398 support #Bitcoin Sunday Update
CRYPTOCAP:BTC bounced from the $112,398 support and is now trading above $113,700. If it holds above this level, a push toward $120K is likely. However, if downside continues, next key support sits near $110K — both supports could trigger a rebound toward $120K. Stay alert for range play before breakout.

BTCUSD Will Explode! BUY!
My dear followers,
I analysed this chart on BTCUSD and concluded the following:
The market is trading on 11326 pivot level.
Bias - Bullish
Technical Indicators: Both Super Trend & Pivot HL indicate a highly probable Bullish continuation.
Target - 11517
Safe Stop Loss - 11236
About Used Indicators:
A super-trend indicator is plotted on either above or below the closing price to signal a buy or sell. The indicator changes color, based on whether or not you should be buying. If the super-trend indicator moves below the closing price, the indicator turns green, and it signals an entry point or points to buy.
Disclosure: I am part of Trade Nation's Influencer program and receive a monthly fee for using their TradingView charts in my analysis.
———————————
WISH YOU ALL LUCK
BTC -MACD Triggered the Breakout Early, MACD MasteryYou didn’t need 20 indicators. Just one system that actually worked.
The MACD Liquidity Tracker Strategy flipped long on BTC just before the latest 4H breakout — catching an 11.39% move with perfect histogram and EMA alignment.
🔍 Here’s what happened:
– Histogram flipped positive on July 23
– EMA filter cleared — clean long trigger
– Histogram rose into a momentum peak
– Strategy closed just before consolidation
This is exactly what the Liquidity Tracker was built for:
✅ Spot clean trend shifts
✅ Confirm strength via momentum
✅ Filter out noise using EMAs
⚙️ Settings Used:
– MACD: 25 Fast / 60 Slow / 220 Signal
– EMA Filter: 50 / 9 / 3
– Entry Mode: Histogram + Crossover Combo

3H to New HighsEverything seems to be painting a picture from the 3 HR time frame, in the next 9 hours we can be seeing some potential moves to the upsides. The play from my weekly outlook is still in play, and this 3HR TF is solidifying it. Happy Holding Zebecs!

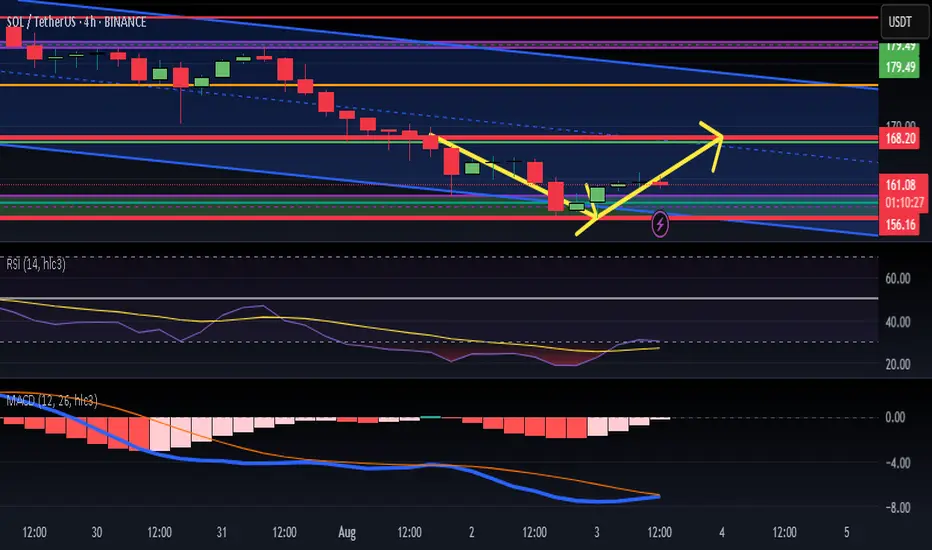
two important level keywe stuck in two level important main support in 61.8 fib 157 and daily resistance in 167 i think market will try resistance three time and will try two time resistance in 167 and bullish trend is start
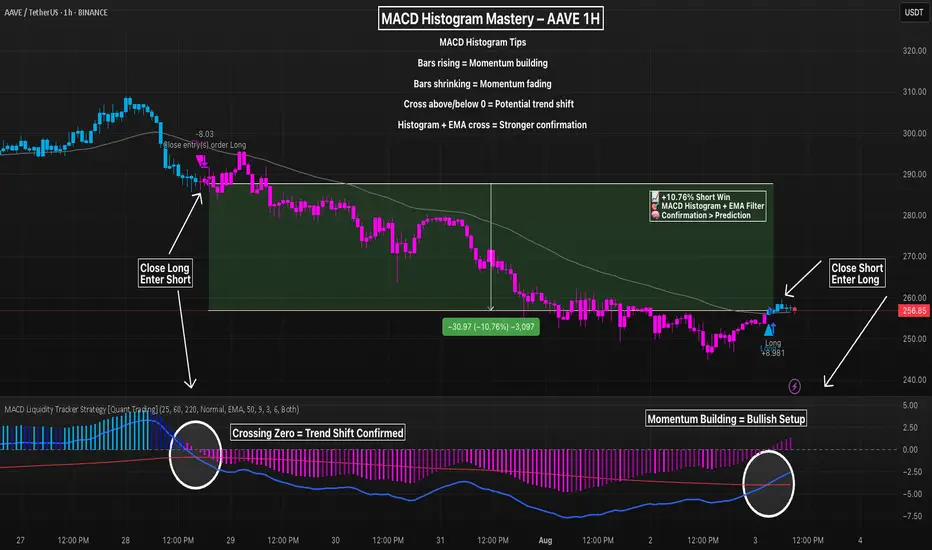
Master MACD Histogram + EMA Filter To Filter Out NoiseThe MACD histogram isn’t just noise — it’s a leading signal for momentum shifts when interpreted correctly. On this AAVE 1H chart, a textbook transition plays out:
– Rising histogram fades → crosses below 0
– EMA filter confirms trend shift
– Strategy flips short at the peak, locks in a +10.76% move
The recent long trigger occurs only after the histogram begins rising, crosses above zero, and price breaks back above the 50/9/3 EMA filter.
💡 Histogram Tips:
– Rising bars = bullish momentum building
– Shrinking bars = momentum weakening
– Crossing the zero line = potential trend reversal
– Best results come when histogram + EMAs align
⚙️ Settings Used:
MACD: 25 / 60 / 220
EMA Filter: 50 / 9 / 3
Entry Mode: Both (Histogram + Crossover Confluence)
📈 Use histogram transitions as an early signal — but always confirm with trend filters to avoid fakeouts.
#BitcoinDate: 03-08-2025
#Bitcoin Current Price:113646
Pivot Point: 112812 Support: 111359 Resistance: 114274
Upside Targets:
🎯Target 1: 115329
🎯Target 2: 116384
🎯Target 3: 117724
🎯Target 4: 119063
Downside Targets:
🎯Target 1: 110300
🎯Target 2: 109240
🎯Target 3: 107901
🎯Target 4: 106561
#TradingView #Nifty #BankNifty #DJI #NDQ #SENSEX #DAX #USOIL #GOLD #SILVER
#BHEL #HUDCO #LT #LTF #ABB #DIXON #SIEMENS #BALKRISIND #MRF #DIVISLAB
#MARUTI #HAL #SHREECEM #JSWSTEEL #MPHASIS #NATIONALUM #BALRAMCHIN #TRIVENI
#USDINR #EURUSD #USDJPY #NIFTY_MID_SELECT
#SOLANA #ETHEREUM #BTCUSD #MATICUSDT #XRPUSDT
#Crypto #Bitcoin #BTC #CryptoTA #TradingView #PivotPoints #SupportResistance

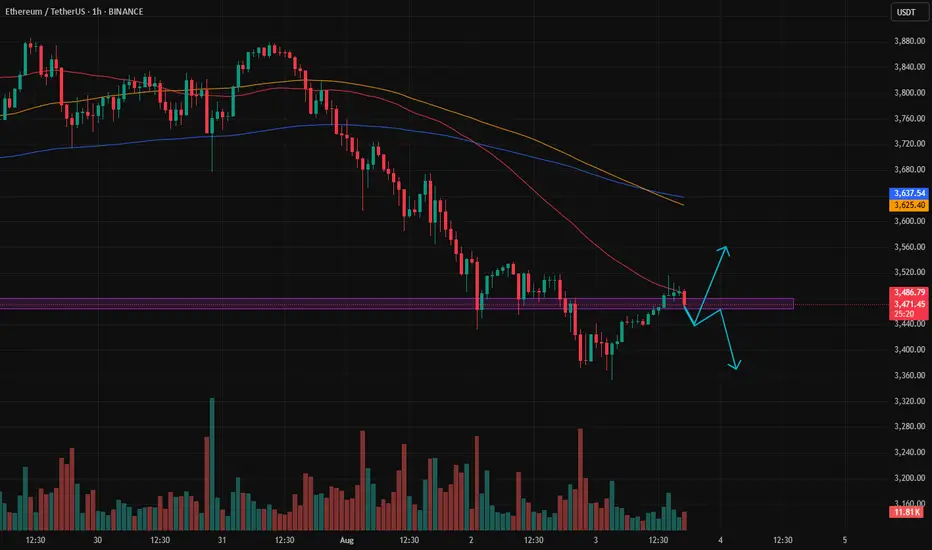
Patience to identify the market trendBased on the previous analysis, after hitting the sell target, the price made an upward correction.
Right now, it’s unclear whether we’re seeing the beginning of a trend reversal to the upside, or if the price is going to drop back below the zone, giving us another short opportunity.
If it does drop again, there’s a possibility it could fall as far as 3000.
We need to be patient and let the market show its hand — then we can respond accordingly.
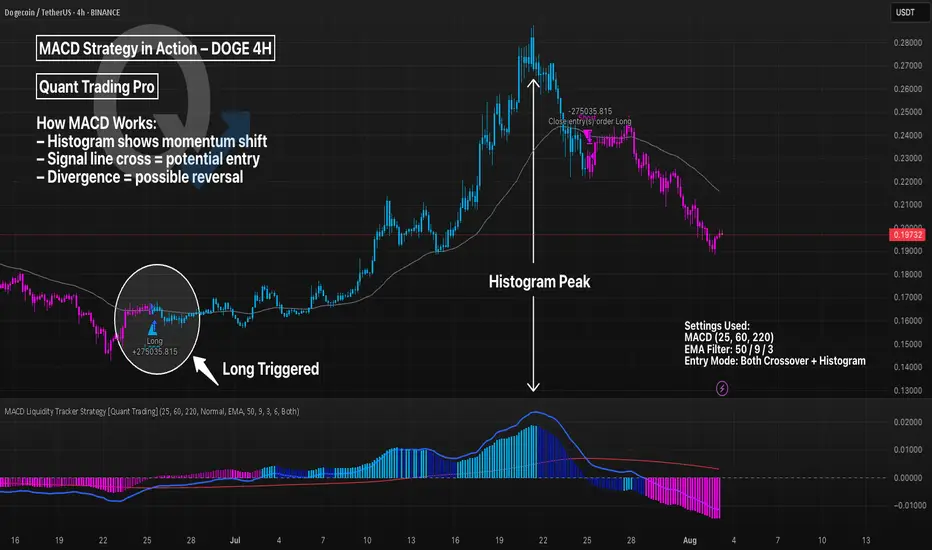
MACD Liquidity Strategy in Action – DOGE 4HThe MACD (Moving Average Convergence Divergence) is a trend-following momentum indicator. It uses two EMAs to generate signals via crossovers and histogram shifts.
This chart shows DOGE 4H with a long-only MACD Liquidity Tracker Strategy, using:
Fast EMA: 25
Slow EMA: 60
Signal Line: 220
These longer settings reduce noise and provide higher-conviction swing entries, though at the cost of late signals.
💡 Tweak Tip:
Lower values (e.g. 12/26/9) = more signals, better for scalping
Higher values (e.g. 25/60/220) = fewer signals, better trend filtering
Adjust the EMA filter (50/9/3 here) to match asset volatility
📊 Use MACD for:
Trend continuation confirmation
Exit timing via histogram fading
Divergence spotting (momentum vs price)
FART coin Short x10Short 10x
Entry $0.9297 on the 20EMA
Target $0.893 on the Trend line
Stop $0.937 above candle on the 20EMA
Add B/E when it hits $0.917
Risk 5/10
