Hypecoin weekend short to $35.75hypeusdt short
Sl: $36.72-38.85
Tp1: $36.34---50%
Full Exit: $35.75
2.21-3 RR
DTT strategy applied
Time sensitive
Crypto market

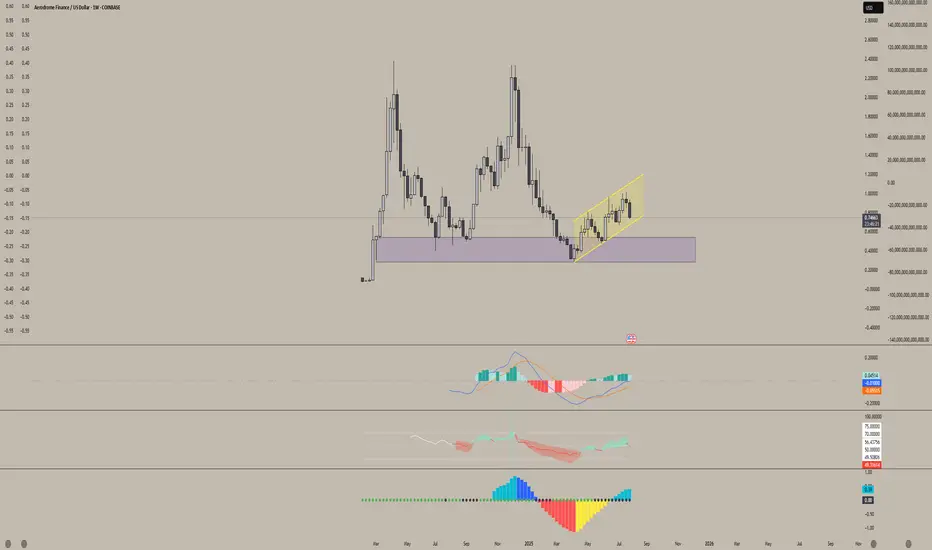
Aerodrome Finance (AERO)Aerodrome (AERO) is showing strong signs of accumulation.
We've been trading within this parallel channel for nearly three months, and it's repeatedly respected both the upper and lower bounds. As we approach the bottom of this range again, it looks like an ideal accumulation zone for long-term holders.
I'm very bullish on this project. Aerodrome is the leading DEX on Base — Coinbase’s Layer 2 network — and with no native Base token currently, AERO is in a prime position to claim that top spot. There's a vacant throne on Base, and AERO is well-positioned to sit on it.
$ALT — Possible 1000x sleeper?
MEXC:ALTCOINUSDT is a Solana-based meme coin, currently listed on MEXC and LBANK for about 3 weeks. It's also tradable on Raydium. While the original developer has left the project and there are claims from some in the community that the influencer 'cryptobeast' acted in bad faith, and that insiders dumped heavily (leading to a -99% drawdown), I personally believe there is a chance for a post-dump pump.
Since it's a meme coin reliant on liquidity pools, I think stop-loss levels are less meaningful. I approach it more like an isolated futures position — only entering with money I can afford to lose.
My target ranges from above $0.40 to potentially exceeding $2. For reference, LAUNCHCOIN experienced a similar pattern — a crash right after listing, followed by a pump up to nearly 7x its launch high. I believe MEXC:ALTCOINUSDT could form a similar narrative if it rallies.
That said, I'm not part of the team, not a developer, and not a financial advisor — just sharing my personal opinion.

Inflection Zone, Do or Die levelI've drawn up a couple of major pivot points that I expect BITSTAMP:BTCUSD to consolidate at before continuing either up or down.
The market is in my opinion currently feeling a little bit confused and not quite fearful yet but a little bit doubtful anyway. The melt up has been real, and for some painful, as directional movement is at most only half of what matters. So this injection of volatility is welcomed at least by me, and I've been fairly exposed to growth stocks in my port lately.
Based on fibonacci phi channels and other confluences of support locations, it looks like we've turned a corner and are on the way down, but I'd be surprised if we breached 107k and as shown, if that did happen, there is a LOT of underlying supply.
I don't know where we go from here but I wanted to point out this level highlighted in light blue, as its historically been a major line in the sand for BTC.

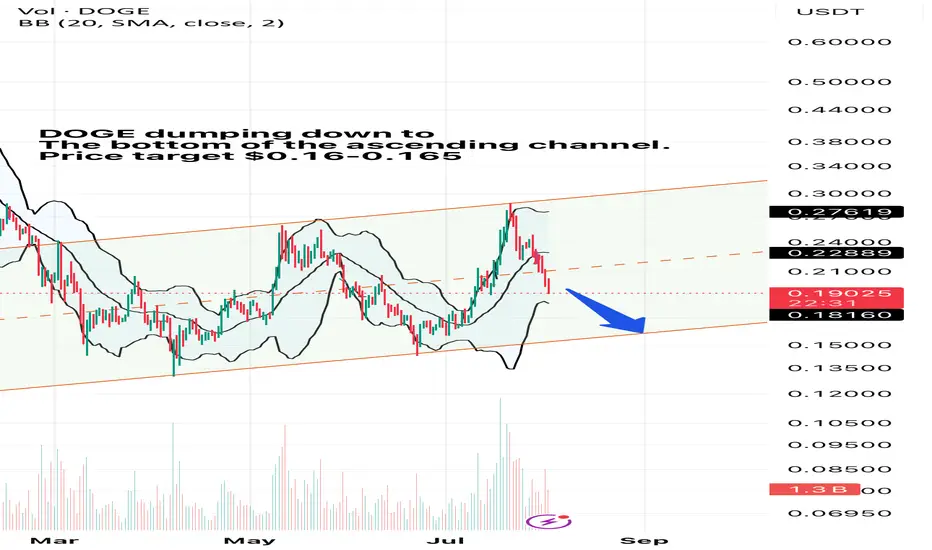
DOGE dumping will end soon.DOGE has been moving within the ascending channel. After hitting the upper resistant level of the channel, it has been dumping since then. Currently heading down to the bottom of the channel. Price Target $0.16-0.165
Shib pump incomingIt can go a bit lower but the option to start building a position is looking great!!!
Could take some time for an 40x
NOT FIANNCIAL ADVICE!!


The cloud with the help of the Tenkan we will rise!!Shit is about to get real.
I was telling folk to look at BTC @ $19....
This could be the time.
NOT FINANCIAL ADVICE

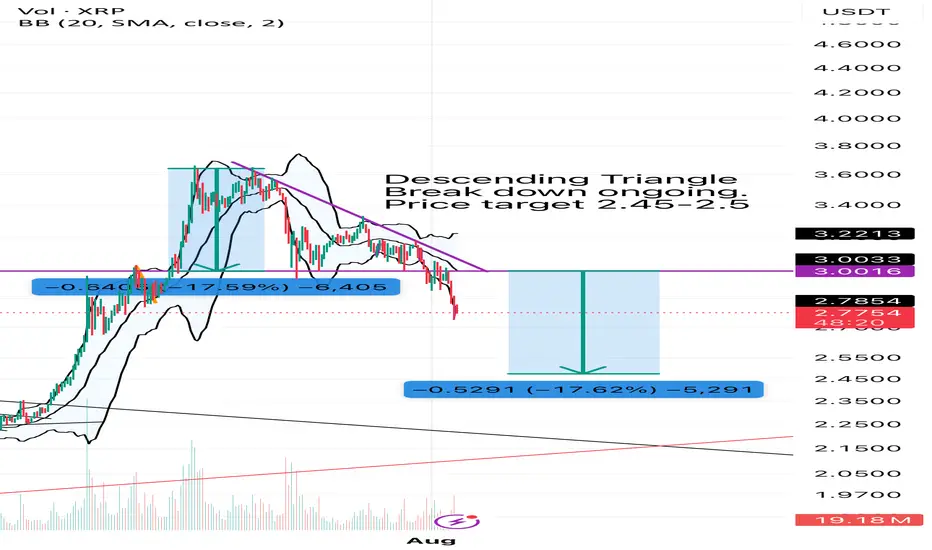
XRP dumping continuesXRP has formed a bearish descending triangle and currently broken down the neck line and continues to dump. This dump will end near $2.45-$2.5 range. Good Luck!
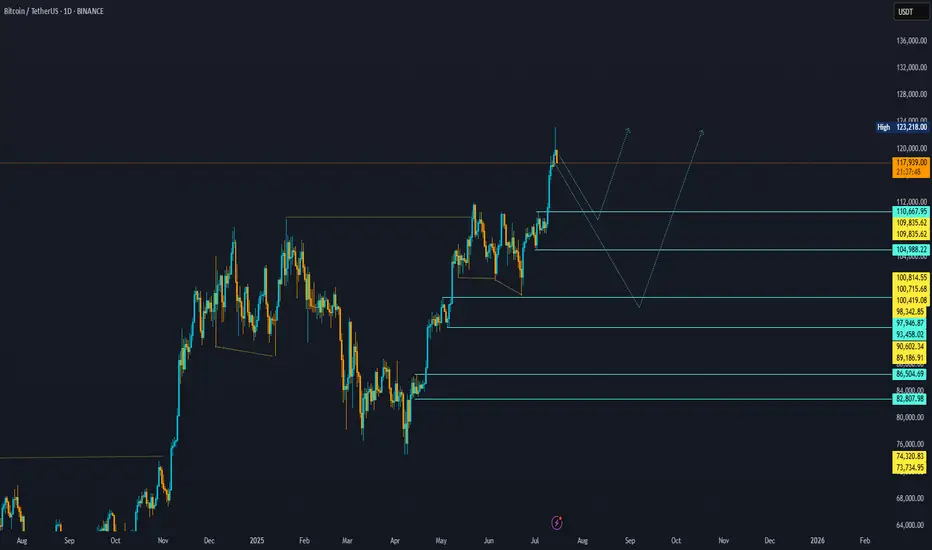
$BTC One Last Flush Before the Next Leg Up!Technical Analysis really is a beautiful thing.
As mentioned, price heading down to ~$111k.
Had a small bounce off the 50DMA at $112k.
Hopefully PA doesn’t range for too long in the previous ATH POI. That will really take steam out of the bull’s engine.
I’m expecting one last flush to push the RSI a bit lower before we can continue the trend back up.
As always in a bull market, BTFD!

BTC next bull run after taking restAs is clear, BTC has made a new high, and we should wait for the next bullish entry after a retracement.
BTC/USD has formed a symmetrical triangle pattern on the 1-hour Price has broken downwards from the consolidation zone, signaling potential bearish momentum. If selling pressure continues, the projected target aligns with the measured move from the pattern’s height, indicating a possible decline toward the next major support zone. Traders should monitor volume for confirmation and manage risk accordingly.

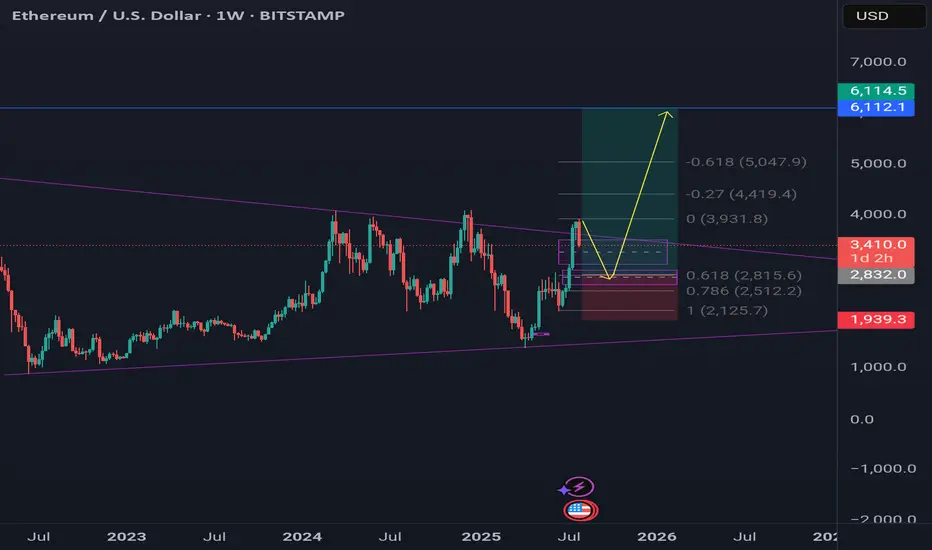
ETHUSD : Key levelsHere is a list of key levels. All of them will be interesting to the market, but when exactly from them will be a bounce I will inform in the next posts. It is foolish to just wait for a bounce from them. Stay tuned for the next posts.

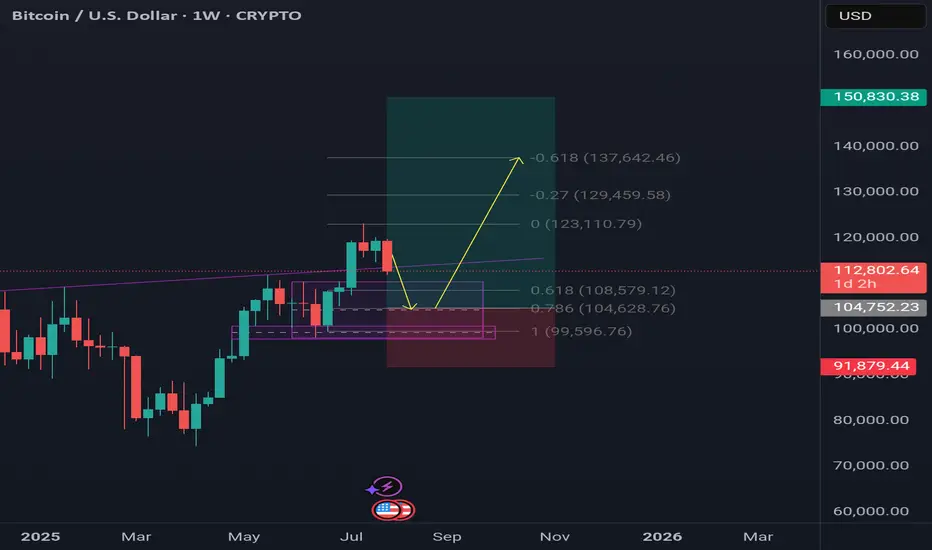
ETHER send it higher and higher and higher.Ether is not going anywhere without makin a new all time high.
Soon 6k ether and even 10k .
The sleeping giant is waking up and when it fully awakes ,it will obliterate everyone.
Bitcoin send it higher . I think btc will stop around 104k region amd then it will continue to give us another leg higher.It is not over yet , it still has to offer us another upside movememt.
Lets send it higher.
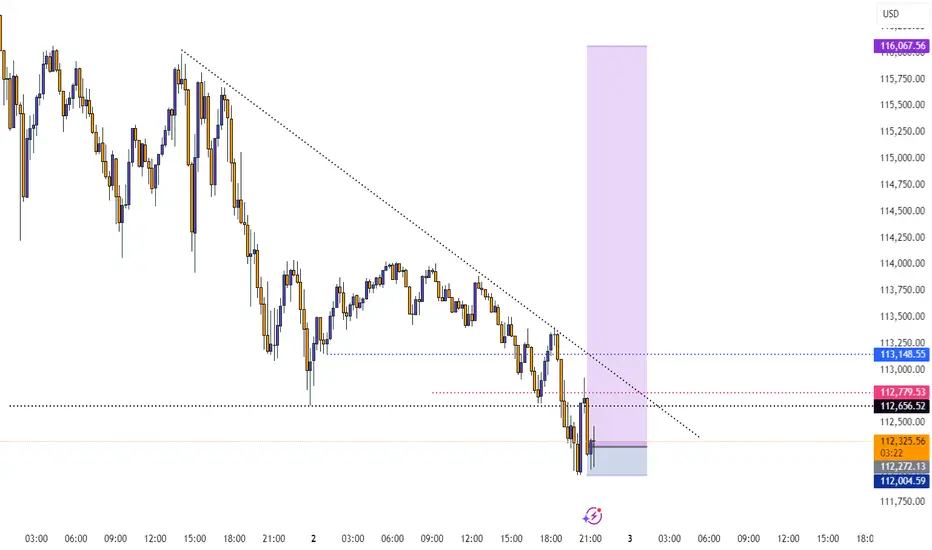
Bitcoin Long Position: Strong Trendline Support! Looking to take a long position on Bitcoin (BTC/USDT) as it bounces off the ascending trendline 🚀. The trendline has historically shown strong support levels, and it’s currently retesting it for a potential reversal.
Key Points:
Current Price: 112,580 USDT 💰
Support Zone: Trendline support is around 112,000 – 111,800 ⬇️
Target: Higher Highs near 116,322 (EMA 20 resistance level) 📈
Stop Loss: Set just below the trendline at 111,500 🔒
Trade Setup:
Entry: At 112,580 USDT
Stop Loss: 111,500 USDT
Target 1: 114,800 – 115,500 USDT
Target 2: 116,322 USDT (potential breakout)
Reasoning:
Trendline Rebound: BTC is testing a major trendline support.
Short-Term Momentum: Expecting a continuation after this test.
Risk Management: Tight stop below the trendline for safety.
🔔 Stay updated: Follow for more setups and updates! Happy trading!

BTCUSD : Long levelHere is a great entry point for those who scalp this instrument or pips. The level is marked with a green arrow. It will be active until I report. It may become inactive over time.
Watch out for trading on the news.

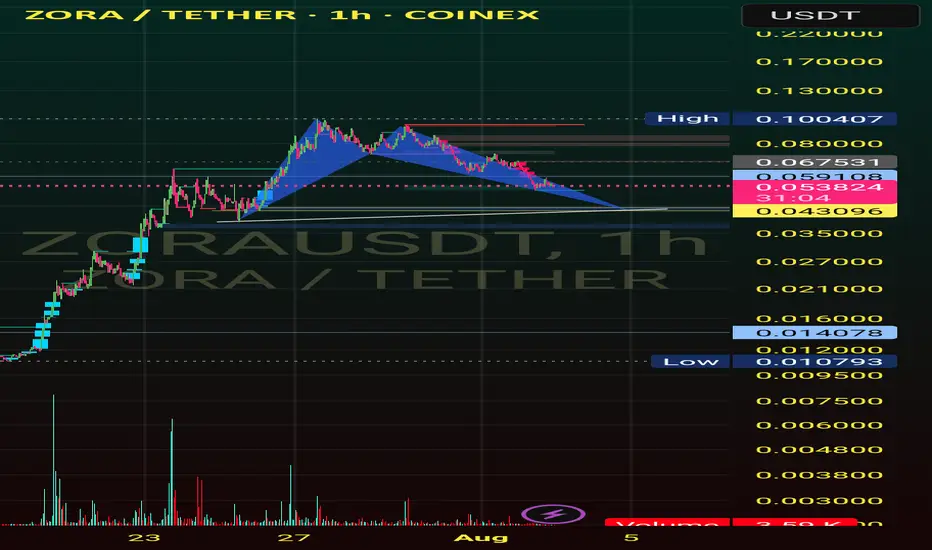
Cypher patternI see a Cypher Pattern on this chart, which could correct to lower areas for now. Again, please trade with your own analysis, I am not responsible for your profits or losses.📉
BTCUSD : Short levelHere is a great entry point for those who scalp this instrument or pips. The level is marked with a red arrow. It will be active until I report. It may become inactive over time.
Watch out for trading on the news.

BTCUSD : Key levelsHere is a list of key levels on BTCUSD. All of them will be interesting to the market, but when exactly from them will be a bounce I will inform in the next posts. It is foolish to just wait for a bounce from them. Stay tuned for the next posts.

Winter is coming!This idea reflects the beggining of the bear market phase. Just wait patiently around 400 days to start scooping again like a maniac. Dont listen to the Maxis, instead use a plan like this one to remove emotions and buy more sats with less capital.

ENA short to $0.4910Just now opened a short on ENA. Aiming for $0.4910
Seems likely to dump further based on DTT analysis- Learn more on X.
Sl: $0.5435
Roughly 2 RR from my entry
