Trumpcoin short to $8.292Just now opened up a short position on Trumpcoin. Market is low and soon I anticipate reversal to the upside but not just yet. Based on my DTT analysis market is likely to make new lows ago.
Sl: $8.745
Time sensitive
Crypto market

ETHEREUM ETHUSDTTHE structure and strategy will never lie. Watch demand and supply roof .
from the top layers ,we have seen the 3touch supply roof sending Ethereum tanking again expect the retest of the broken supply from the bottom to provide buy opportunity
trading is 100% probability, please lower your expectations and know that any key level can fail.
#ethusdt #ethereum #bitcoin #btc #crypto

Bitcoin Overall: Still Expecting new ATHIndicated are the supports I’m watching. If price goes below the ‘invalidation leg’ I consider the btc bull market to be over.

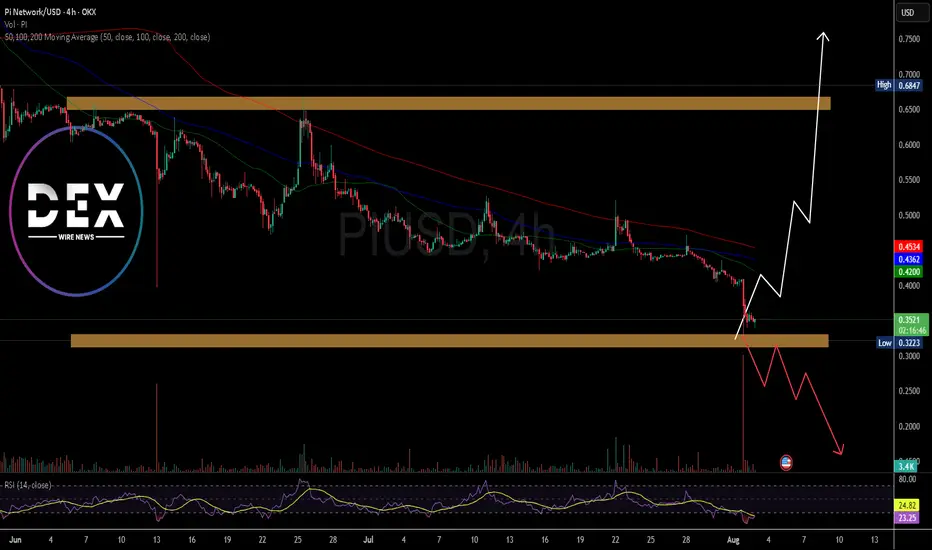
Is There Hope For PI Network? The Price of the notable altcoin NASDAQ:PI network has since seen a downtick of 80.86% since lunching and listing on major CEX like Kucoin, GateIo, OKX, etc. as per data from CMC.
The altcoin has lost the psychological $0.66 resistance zone forming a support or baseline at the $0.33 price range. with increasing selling pressure, NASDAQ:PI might experience further price dip to the $0.20 price point eventually leading to a deja vu to the $0.60 price point.
Possible factor to present price degradation is the dip in CRYPTOCAP:BTC 's price that most coins follow suit, and NASDAQ:PI wasn't an exception.
NASDAQ:PI is currently oversold as hinted by the data from Trading view. the altcoin has an RSI of 20 which entails weak momentum and possible chances of a market turnaround.
What Is Pi Network?
Pi Network is a social cryptocurrency, developer platform, and ecosystem designed for widespread accessibility and real-world utility. It enables users to mine and transact Pi using a mobile-friendly interface while supporting applications built within its blockchain ecosystem.
Pi Price Data
The Pi price today is $0.346618 USD with a 24-hour trading volume of $174,236,091 USD. Pi is down 14.58% in the last 24 hours. The current CoinMarketCap ranking is #38, with a market cap of $2,692,698,184 USD. It has a circulating supply of 7,768,487,700 PI coins and a max. supply of 100,000,000,000 PI coins.
[ayana] TFPS Report: Is Bitcoin Ignoring a Clear Warning?⚡️ TFPS Report: Is Bitcoin Ignoring a Clear Warning from Wall Street?
Analysis for: #Bitcoin (INDEX:BTCUSD, 4H) | August 02, 2025
Traditional financial markets (TradFi) are sending a clear bearish signal, and they're leading Bitcoin's price moves with high confidence. A significant divergence has appeared: while the long-term strategic link to crypto is very strong, the immediate tactical influence is currently low.
📊 Data Snapshot in Detail:
▪️ TFPS Score: -26.59 (Bearish Pressure) 🔴
▪️ Wall St. Influence (R²): Tactically Low (16% over 24h), but Strategically Very High (78% over 30d).
▪️ Market Condition (Z-Score): Normal (0.2).
▪️ Pacesetter (Lead/Lag): TradFi is leading Crypto by 6 bars (24 hours) with High Confidence (56.1% CI).
▪️ Key Drivers: A mix of declining Risk Appetite ( AMEX:SPY at 30.21%) and rising Market Stress ( TVC:VIX at 29.75%).
🎯 Actionable Insight for Traders:
The environment signals an underlying Risk-Off Phase. Caution is advised; be wary of the divergence. The high strategic R² (78%) and high-confidence lead from TradFi suggest the underlying bearish pressure is significant and should not be ignored. The current low tactical R² (16%) could be a temporary lag before Bitcoin's price realigns with the broader market sentiment. Watch the key drivers ( AMEX:SPY , TVC:VIX ) closely for signs that this divergence is closing.
#Bitcoin #TFPS #MacroAnalysis #TradFi BITSTAMP:BTCUSD

BTC WARNINGEvery time BTC has broken its ATH, it has moved three fractals up, and then corrected. In addition, every time it has touched the blue line marked as a trend, it has corrected. It has already done all of this. And I dare say there will be a strong correction.

Bitcoin Still has Room to Run - Here's One Reason WhyWhen we zoom out and look at Bitcoin on a logarithmic scale, a clear pattern emerges.
In this chart, I’ve marked each cycle top with a vertical blue line. These peaks are almost perfectly spaced — roughly four years apart, aligning with Bitcoin’s halving cycles. From 2013 to 2017 to 2021, and now projecting into the next expected top near late 2025 or early 2026, this cyclical rhythm has held remarkably steady.
But it’s not just time — it’s structure.
Overlayed on the chart is a standard deviation framework, with the center line acting as a mean reversion anchor. Every major cycle has seen Bitcoin reach the second standard deviation above the mean before topping out.
Where are we now?
Still below the halfway mark.
As of today, Bitcoin hasn’t even reached the +1 standard deviation level. Historically, price accelerates toward the upper bounds of this channel as the cycle matures — and we haven’t seen that blow-off phase yet.
In other words:
Bitcoin still has room to grow.
We’re not late — we’re mid-cycle.
Let the headlines panic. The structure is calm.
And the structure says: higher.

The Only Bitcoin Chart You NeedUnderstanding Price Action is essential for successful trading as it allows traders to interpret market dynamics and make informed decisions based on pure price movements. By focusing solely on price movements, traders can eliminate noise and distractions caused by indicators or external factors, leading to a clearer understanding of market trends and patterns.

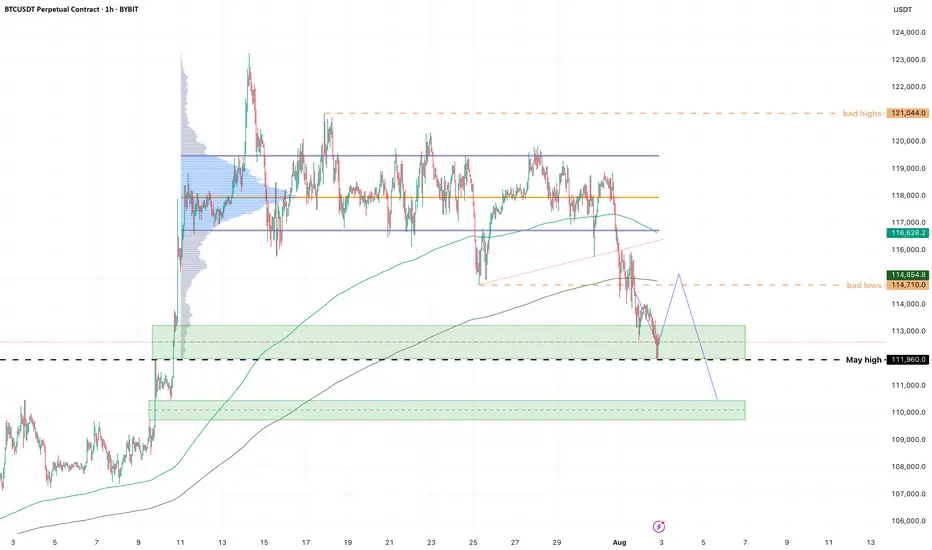
BTC - HOOOLLDDD!!!!Looks like we got our downside first.
Short update, but important level to watch is that 112k high from May this year. I longed on a ltf low hold, looking for a bounce into the highs of this sell-off cluster, then see what's what.
Flow is still very heavy; I expect to get stopped on this but it's one of those setups I just have to take, or I kick myself tomorrow.
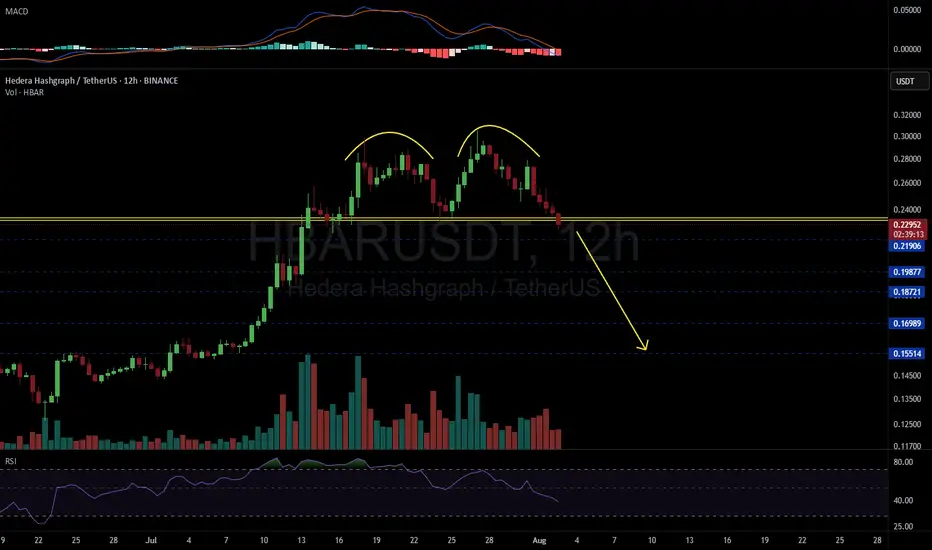
HBARUSDT 12H#HBAR has formed a Double Top pattern on the 12H timeframe and has now broken below the neckline.
If this candle and the next one close below the neckline, the pattern will be confirmed and we could see further downside toward the following support levels:
🎯 $0.21906
🎯 $0.19877
🎯 $0.18721
🎯 $0.16989
🎯 $0.15514
⚠️ As always, use a tight stop-loss and apply proper risk management.
SOL's Golden Pocket: Is This the Bottom?SOL just tapped into the golden pocket zone and swept sell-side liquidity. Creating a high-probability long opportunity.
🟢 Long Setup:
Entry Zone: $156.67 – $151.50
Stop Loss: Below $150 (clear invalidation)
Target: $172
Risk:Reward: solid R:R setup
Why This Zone? Confluence Breakdown:
Golden Pocket retracement (0.618–0.666)
1.272 Trend-Based Fib Extension
Monthly Order Block
0.5 Fib Speed Fan support
Key Level at $154.81
Anchored VWAP support layer
Pitchfork 0.618/0.666 alignment
SSL (Sell-Side Liquidity) swept
nPOC at ~$152 offers a prime entry if we see another leg down
💡 Tip: Ladder in entries within the zone and size up near nPOC if price dips further. Manage risk carefully and watch how price reacts at the zone.
🧠 Educational Insight
Golden pockets (the 0.618–0.666 Fibonacci zone) are some of the most respected levels in trading often acting as key reversal zones, especially when stacked with other tools. In this case, we’ve got a rare confluence: anchored VWAP, nPOC, monthly OB, SSL sweep etc. all lining up with the golden pocket.
When multiple technical factors align, they don’t just increase probability, they give you a tighter invalidation and a better risk-to-reward setup. That’s how professional traders spot sniper entries.
_________________________________
💬 If you found this helpful, drop a like and comment!

BONKUSDT – Let the Market Come to YouIn a possible Q3 correction, BONKUSDT may retest the green box zones below.
These areas are not predictions — they’re prepared zones where I’ll be waiting, not chasing.
🟩 I don’t buy strength blindly. I buy value with structure.
All risk-on markets typically experience significant corrections in the third quarter of the year and struggle to recover from this correction until the end of the year.
🎯 My Strategy
🔔 Set alerts for the green boxes
🕐 Switch to the 1-hour timeframe when triggered
📈 Wait for upward breakout + positive CDV
🎯 Only then: take the shot — one bullet, risk-managed
“Markets reward those who wait with a plan, not those who rush with emotion.”
Let’s stay patient, structured, and consistent.
— UmutTrades 💙
📌I keep my charts clean and simple because I believe clarity leads to better decisions.
📌My approach is built on years of experience and a solid track record. I don’t claim to know it all but I’m confident in my ability to spot high-probability setups.
📌If you would like to learn how to use the heatmap, cumulative volume delta and volume footprint techniques that I use below to determine very accurate demand regions, you can send me a private message. I help anyone who wants it completely free of charge.
🔑I have a long list of my proven technique below:
🎯 ZENUSDT.P: Patience & Profitability | %230 Reaction from the Sniper Entry
🐶 DOGEUSDT.P: Next Move
🎨 RENDERUSDT.P: Opportunity of the Month
💎 ETHUSDT.P: Where to Retrace
🟢 BNBUSDT.P: Potential Surge
📊 BTC Dominance: Reaction Zone
🌊 WAVESUSDT.P: Demand Zone Potential
🟣 UNIUSDT.P: Long-Term Trade
🔵 XRPUSDT.P: Entry Zones
🔗 LINKUSDT.P: Follow The River
📈 BTCUSDT.P: Two Key Demand Zones
🟩 POLUSDT: Bullish Momentum
🌟 PENDLEUSDT.P: Where Opportunity Meets Precision
🔥 BTCUSDT.P: Liquidation of Highly Leveraged Longs
🌊 SOLUSDT.P: SOL's Dip - Your Opportunity
🐸 1000PEPEUSDT.P: Prime Bounce Zone Unlocked
🚀 ETHUSDT.P: Set to Explode - Don't Miss This Game Changer
🤖 IQUSDT: Smart Plan
⚡️ PONDUSDT: A Trade Not Taken Is Better Than a Losing One
💼 STMXUSDT: 2 Buying Areas
🐢 TURBOUSDT: Buy Zones and Buyer Presence
🌍 ICPUSDT.P: Massive Upside Potential | Check the Trade Update For Seeing Results
🟠 IDEXUSDT: Spot Buy Area | %26 Profit if You Trade with MSB
📌 USUALUSDT: Buyers Are Active + %70 Profit in Total
🌟 FORTHUSDT: Sniper Entry +%26 Reaction
🐳 QKCUSDT: Sniper Entry +%57 Reaction
📊 BTC.D: Retest of Key Area Highly Likely
📊 XNOUSDT %80 Reaction with a Simple Blue Box!
📊 BELUSDT Amazing %120 Reaction!
📊 Simple Red Box, Extraordinary Results
📊 TIAUSDT | Still No Buyers—Maintaining a Bearish Outlook
📊 OGNUSDT | One of Today’s Highest Volume Gainers – +32.44%
📊 TRXUSDT - I Do My Thing Again
📊 FLOKIUSDT - +%100 From Blue Box!
📊 SFP/USDT - Perfect Entry %80 Profit!
📊 AAVEUSDT - WE DID IT AGAIN!
I stopped adding to the list because it's kinda tiring to add 5-10 charts in every move but you can check my profile and see that it goes on..

Subsquid short to $0.13875Rejected strong as seen from weekly tf. Its unlikely to push back up until it reaches a strong support area.
0.3875 might be that area though I think it probably fall lower but that's good enough
Sl: $0.15605
Roughly 2RR

HBARUSDT – Planning Ahead, Not Reacting Late In the event of a potential Q3 correction, I believe HBARUSDT could revisit the green box zones below.
These areas aren’t guaranteed bounce points — but they represent fair value in a market pullback scenario.
🧭 How I’m Preparing
📌 No blind orders
📌 Set alerts at the green zones
📌 When price hits, switch to 1-hour
📌 Wait for upward breakout + rising CDV
If it aligns, I take the trade — one bullet only.
"The smart investor doesn’t fear the correction — they prepare for it."
No rush. No panic. Just discipline.
Let’s stay ready.
— UmutTrades 💙
📌I keep my charts clean and simple because I believe clarity leads to better decisions.
📌My approach is built on years of experience and a solid track record. I don’t claim to know it all but I’m confident in my ability to spot high-probability setups.
📌If you would like to learn how to use the heatmap, cumulative volume delta and volume footprint techniques that I use below to determine very accurate demand regions, you can send me a private message. I help anyone who wants it completely free of charge.
🔑I have a long list of my proven technique below:
🎯 ZENUSDT.P: Patience & Profitability | %230 Reaction from the Sniper Entry
🐶 DOGEUSDT.P: Next Move
🎨 RENDERUSDT.P: Opportunity of the Month
💎 ETHUSDT.P: Where to Retrace
🟢 BNBUSDT.P: Potential Surge
📊 BTC Dominance: Reaction Zone
🌊 WAVESUSDT.P: Demand Zone Potential
🟣 UNIUSDT.P: Long-Term Trade
🔵 XRPUSDT.P: Entry Zones
🔗 LINKUSDT.P: Follow The River
📈 BTCUSDT.P: Two Key Demand Zones
🟩 POLUSDT: Bullish Momentum
🌟 PENDLEUSDT.P: Where Opportunity Meets Precision
🔥 BTCUSDT.P: Liquidation of Highly Leveraged Longs
🌊 SOLUSDT.P: SOL's Dip - Your Opportunity
🐸 1000PEPEUSDT.P: Prime Bounce Zone Unlocked
🚀 ETHUSDT.P: Set to Explode - Don't Miss This Game Changer
🤖 IQUSDT: Smart Plan
⚡️ PONDUSDT: A Trade Not Taken Is Better Than a Losing One
💼 STMXUSDT: 2 Buying Areas
🐢 TURBOUSDT: Buy Zones and Buyer Presence
🌍 ICPUSDT.P: Massive Upside Potential | Check the Trade Update For Seeing Results
🟠 IDEXUSDT: Spot Buy Area | %26 Profit if You Trade with MSB
📌 USUALUSDT: Buyers Are Active + %70 Profit in Total
🌟 FORTHUSDT: Sniper Entry +%26 Reaction
🐳 QKCUSDT: Sniper Entry +%57 Reaction
📊 BTC.D: Retest of Key Area Highly Likely
📊 XNOUSDT %80 Reaction with a Simple Blue Box!
📊 BELUSDT Amazing %120 Reaction!
📊 Simple Red Box, Extraordinary Results
📊 TIAUSDT | Still No Buyers—Maintaining a Bearish Outlook
📊 OGNUSDT | One of Today’s Highest Volume Gainers – +32.44%
📊 TRXUSDT - I Do My Thing Again
📊 FLOKIUSDT - +%100 From Blue Box!
📊 SFP/USDT - Perfect Entry %80 Profit!
📊 AAVEUSDT - WE DID IT AGAIN!
I stopped adding to the list because it's kinda tiring to add 5-10 charts in every move but you can check my profile and see that it goes on..

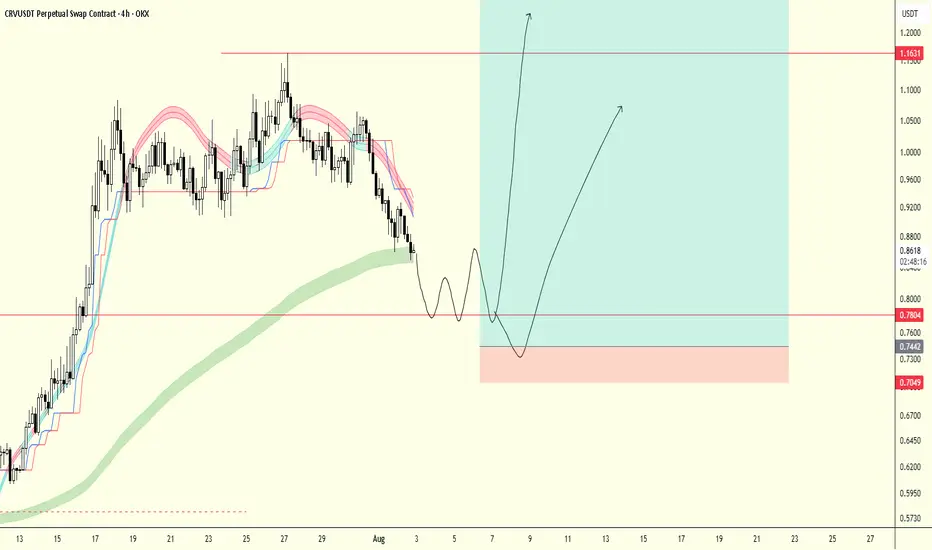
crvnin yapacağı hamle . Please act according to your own strategy and do not make trades based on your own judgment. The cryptocurrency market involves risky transactions.
BTC/USD 1D Chart 🔼 Resistance:
• USD 123,263 - local peak, strong resistance (green line)
• USD 119,120 - level tested several times, recent reflection
• 116,224 USD - zone of previous consolidations
🔽 support:
• 110,945 USD - SMA #2 (movable average), tested in the past
• 107,804 USD - local hole
• USD 103,542 - strong support from the past (historical retention of declines)
⸻
📊 Technical indicators
📉 Trend:
• The yellow upward trend line has been broken - a potential bull weakness signal.
• The candle pierces the trend line from the bottom - it is possible to change the direction to a side or downward trend.
📈 Medium walking (SMA):
• The red SMA #1 line acted as dynamic resistance.
• The price is currently testing SMA #2 as support.
• SMA #5 (blue, approx. 98,600 USD) is very strong long -term support.
📉 Macd:
• The MacD line is below the signal line → Bear signal (Bearish).
• Red histogram - inheritance impetus is growing.
📉 RSI:
• RSI has fallen below the level of 50 → the advantage of supply.
• Currently, it is approaching the supply of supply overload (<30), which can herald the technical reflection.
⸻
🔮 Scenarios
✅ Scenario Bycza (Bullish):
• Maintenance of a price above 110.945 USD (SMA #2).
• Return above the trend line or testing USD 116,224 and piercing up.
❌ Bear scenario (Bearish):
• Loss of support to 110.945 USD → decrease to USD 107,800.
• If this does not keep the course, the next strong level is USD 103,500.
⸻
🧠 Applications:
• Short -term: the market looks weak, the candle breaks the upward trend.
• Medium -term: still in the game, but if it does not reflect from the current levels, a greater correction is possible.
• Commercial decisions: It is worth waiting for confirmation of the direction (reflection from support or continuation of declines).

Telusdt Buy opportunitySpotted a potential ascending formation with price currently developing a mini bullish flag. This structure suggests an underlying accumulation phase ahead of a potential breakout.
The strategic focus is the Buy Back Zone, a key area for strong accumulation entries. Targets are clearly mapped on the chart, with 0.009896 as the first short-term objective, followed by 0.061317.
The final critical area to monitor is the Crucial Resistance Zone, acting as the neckline of the entire setup—its breakout will confirm a long-term structural shift. Watching closely for sustained momentum.

Insider Selloff + Liquidity Sweep🔻 PENGU/USDT TRADE IDEA 🔻
📣 Hey CandleCraft crew!
Today we’re diving into a chilly little bird that flew a bit too close to the heat. 🐧 PENGU pumped hard — but when team wallets start dumping $17M worth of tokens, that’s not bullish, that’s suspicious. Think iceberg ahead.
🔥 TRADE SETUP
Bias: Short
Strategy: Insider Selloff + Liquidity Sweep
Entry: $0.036 – $0.038
SL: $0.041
TPs: $0.030, $0.025, $0.018
Why?
– HTF sweep of liquidity above $0.04
– Insider wallet moved 485M tokens to exchanges
– LTF CHoCH + RSI breakdown
– Price hovering under 20-day EMA with weakening volume.
Candle Craft | Signal. Structure. Execution.


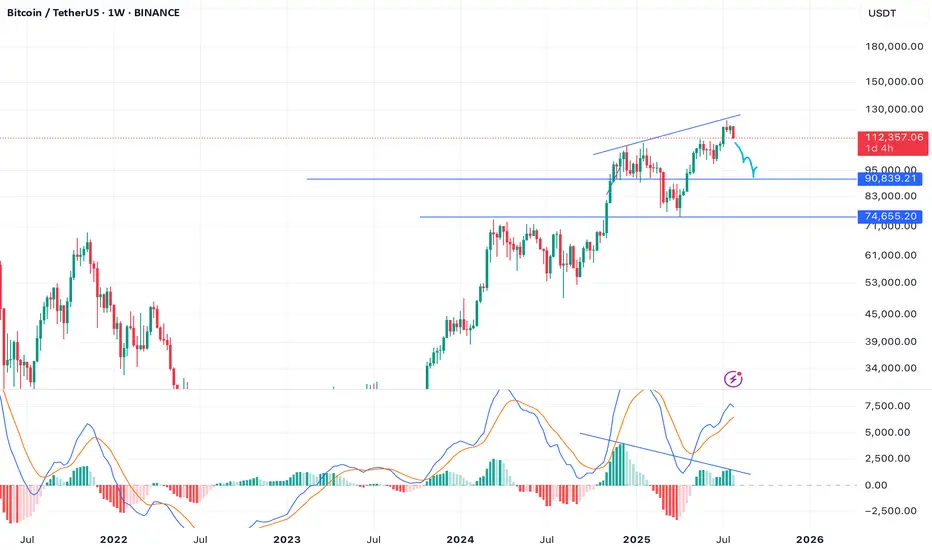
From Euphoria to Exhaustion – BTC's Next Move?BTC Idea – Bearish Divergence + Key Level Watch ⚠️
Summary / Bias:
BTC has tapped 120K and is now showing early signs of weakness. A bearish divergence on the MACD Histogram (weekly) is flashing caution, while price has retraced back to the critical 112K zone. I'm leaning bearish short-term, expecting a move towards 100K, and possibly as low as 93K, if key confirmations unfold.
Technical Context:
Weekly MACD Histogram shows a clear bearish divergence, signaling potential exhaustion.
BTC rejected from 120K and has pulled back to 112K.
Price crossed below the Yearly Camarilla L#, but we need a weekly close below to confirm further downside.
112K remains the key pivot – failure to bounce strongly here could open the door for deeper retracement.
Scenarios to Watch:
🟥 Bearish Continuation (Primary Bias)
Breakdown and close below 112K
Downside targets:
TP1: 100K
TP2: 93K
🟨 Neutralizing Risk
Hold above 112K with strong bounce = neutral bias, reassess
Close back above 115K+ with strength = invalidate bearish lean
Caution & Patience:
Now is not the time for aggressive longs. Signs of exhaustion + major level retest call for defensive positioning and high-quality setups only. Let confirmation guide entries.
NFA. Risk management always.
Will update if structure shifts.
btcThis is not a signal.
Just my outlook on BTC based on data
No fluff
No fancy indicators
And definetly no rectangles
Just watch and see how it plays out, as we are currently in a big indecision zone as well as the weekend I would not enter any positions now but rather wait for monday-wednesday to enter.

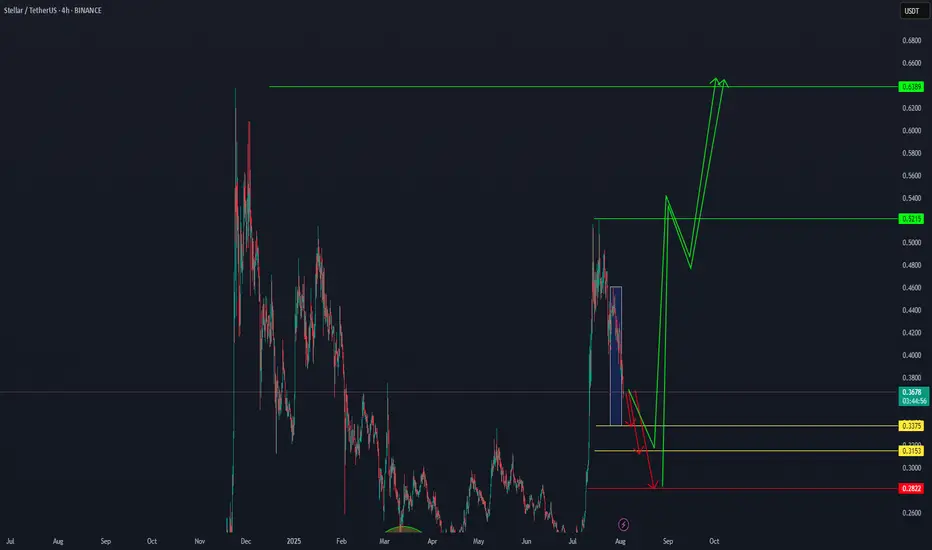
"Stellar XLM will definitely reach 0.6389."" Stellar (XLM) is expected to begin its upward move from the price zones of 0.3375, 0.3153, and 0.2822, heading toward the confirmed targets of 0.5215 and then 0.6389.
While the exact starting point may vary slightly, the targets at 0.5215 and 0.6389 are considered certain." BINANCE:XRPUSDT
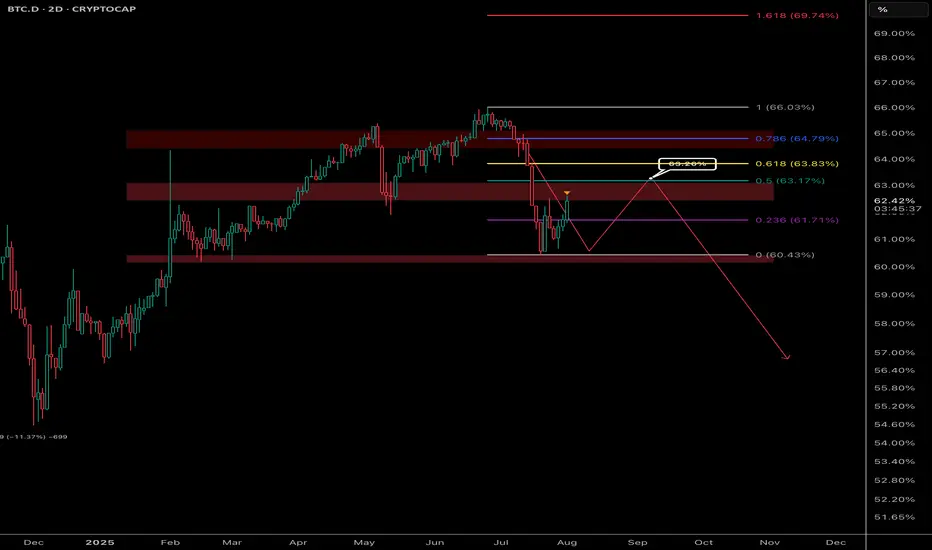
Bitcoin Dominance (BTC.D) – Key Levels Ahead
BTC dominance is climbing into a major resistance zone after a steep drop. The current structure hints at a possible lower high forming, which could be bearish if it gets rejected around 63.2%.
🟥 If rejected from resistance:
Could mark a continuation of the downtrend in BTC dominance.
This may signal money rotating out of BTC and into altcoins — potential altseason vibes ahead.
🟩 If it breaks above:
The dominance trend may continue higher.
That would indicate capital flowing back into BTC, possibly showing risk-off sentiment or market uncertainty.
🎯 Key zones to watch are where dominance stalls or breaks — market rotation depends on this move.