Another formation of head and shoulderSolano possibly forming a head and shoulder weekly pattern. Watching the support is critical which confirms the head and shoulder pattern and a reversal opportunity to a lower target such as the trendline support or even lower. An invalidation of the left shoulder open opportunity to break out the ATH and target higher. The weekly moving average holding a support at the moment and price didn't dip lower. Keeping major economics in mind the higher highs and expectation of cutting interest rate could invalidate the head and shoulder pattern.
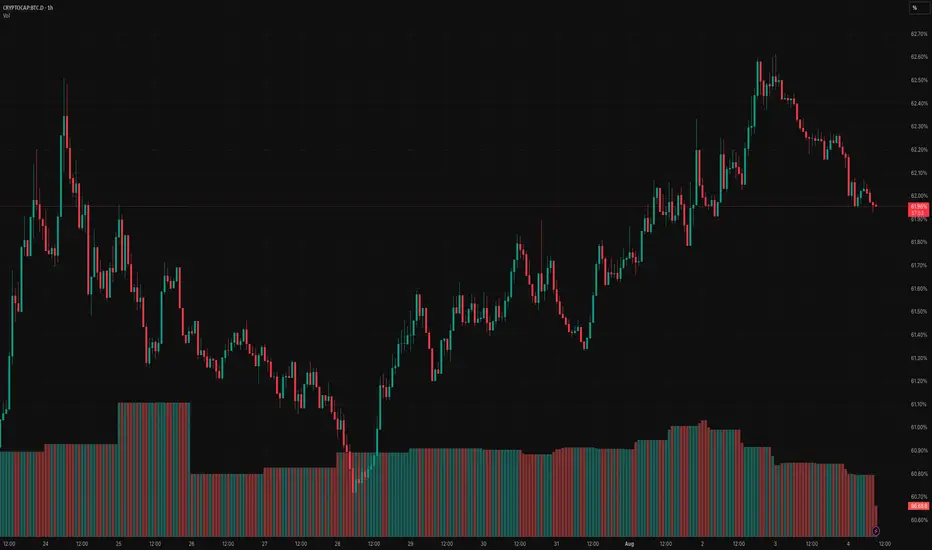
Crypto market

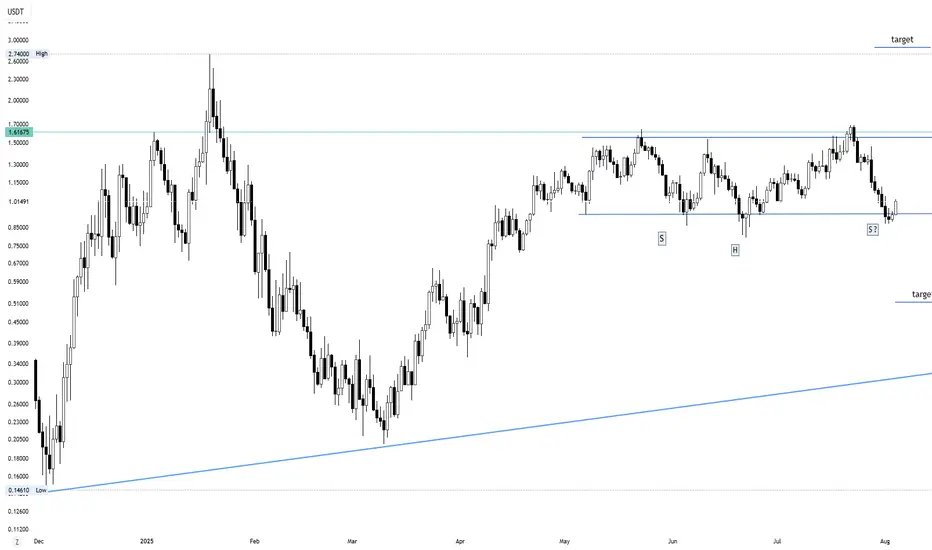
A possible inverse head and shoulder formingIn this daily chart, it clearly shows the formation of inverse head and shoulder. For it to be a valid inverse head and shoulder, the right shoulder should complete. The pattern is developing inside a rectangular pattern. A breakout will target New ATH. A pullback and close below the possible head which no longer makes it head, and shoulder increases sell pressure.
Bearish Divergence on Bigger tf
CMP 105228.47 (02-06-2025)
Bearish Divergence on Bigger tf (Cautious
approach should be taken).
However, if 109350 is Crossed, we may
witness 115000 & then 120000 - 121000.
and if 112000 is crossed & sustained, be ready
to get New Highs :-)
Lets be more cautious & dig out 3 Important
Support Levels.
S1 around 103000 - 102500
S2 around 97800
S3 around 93400 - 93500.

Is Gorbagana (GOR) Poised for a 5x–10x Move? Here’s My Take
🐧 MEXC:GORUSDT (Gorbagana Chain) is a meme-to-mainnet project on Solana.
After a strong run, it corrected about 50–75% from its all-time high, which fits well into a classic Fibonacci retracement zone.
Based on my own Fibonacci analysis, I see potential for a 5× to 10× upside if momentum picks up again.
⚠️ This is just my personal view, not financial advice.

my emotion ruin my tradei understand the market after 3 years watching learning thinking i reach a level i could predict the future price in 70 % come true but my emotion destroy every think i analized my fear my greed make my patient low i dont know what should i do ?a lot of adrenalin come to my body fear greed if you see my post please help me to do some thing next post i talk about trend

pepepepe volatiliity is contracting and momentum is showing up. shorts are off the table for now at least on the daily timeframe in the near term hopefully growing into at leat end of sept

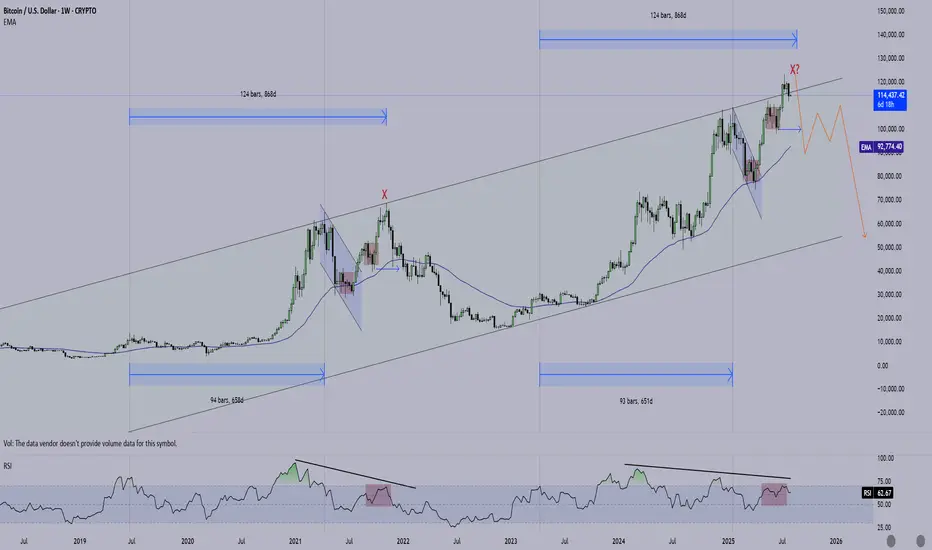
BTC: could this be it? It might be too early to tell, but this could be the top. Strong divergence in Weekly chart, but would only be confirmed if we breakdown the support levels as price can potentially push up into failure. Just a caveat, I can easily be wrong here.
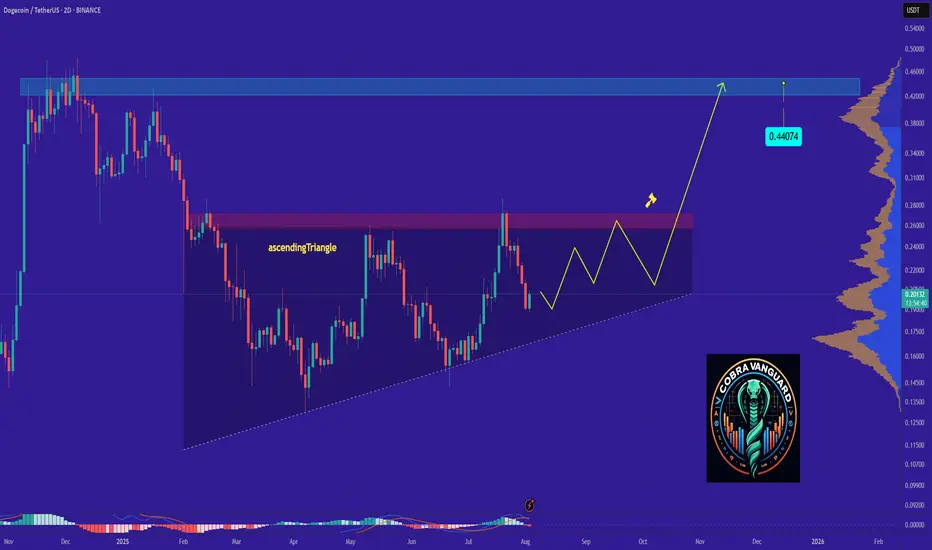
DOGE's Situation, A Comprehensive Analysis !!!The price on the 2d timeframe is within an ascending triangle, which can be promising. If the price breaks this pattern with bullish candles, it could easily rise by the distance of AB=CD .
Best regards CobraVanguard.💚
TradeCityPro | Bitcoin Daily Analysis #144👋 Welcome to TradeCity Pro!
Let’s dive into Bitcoin analysis. Today is the first day of the week and Bitcoin has made a bullish move.
⏳ 4-Hour Timeframe
After the weekly candle closed, Bitcoin made an upward move and pulled back up to the 0.5 Fibonacci zone.
✔️ The long trigger I provided yesterday in the 1-Hour timeframe has been activated. If you opened a short-term position, it has likely already hit the target. If it was a long-term position with a larger stop, then it should still be open for now.
💫 The current 4-Hour candle has wicked into the 0.5 Fibonacci zone, which indicates a strong rejection from this area. If the candle closes red, the probability of starting the next bearish wave will increase significantly.
📊 Besides the resistance from the Fibonacci level, the SMA25 is also overlapping with this zone, so this upward move could also be seen as a pullback to the SMA25 before another drop begins.
✨ However, the candle hasn't closed yet, so it's too early to decide anything. In my opinion, Bitcoin has re-entered a choppy and sideways phase that doesn’t provide good and clean positions — most trades like yesterday’s need to be scalps.
🔍 If a deeper correction happens, our lower support levels are already identified (with the most important one being the 110000 zone). For shorts, I’ll look for entries below 110000. As for longs, I’ll wait for confirmation and stabilization above 116000. For now, I’m only observing this box between 110000 and 116000.
❌ Disclaimer ❌
Trading futures is highly risky and dangerous. If you're not an expert, these triggers may not be suitable for you. You should first learn risk and capital management. You can also use the educational content from this channel.
Finally, these triggers reflect my personal opinions on price action, and the market may move completely against this analysis. So, do your own research before opening any position.

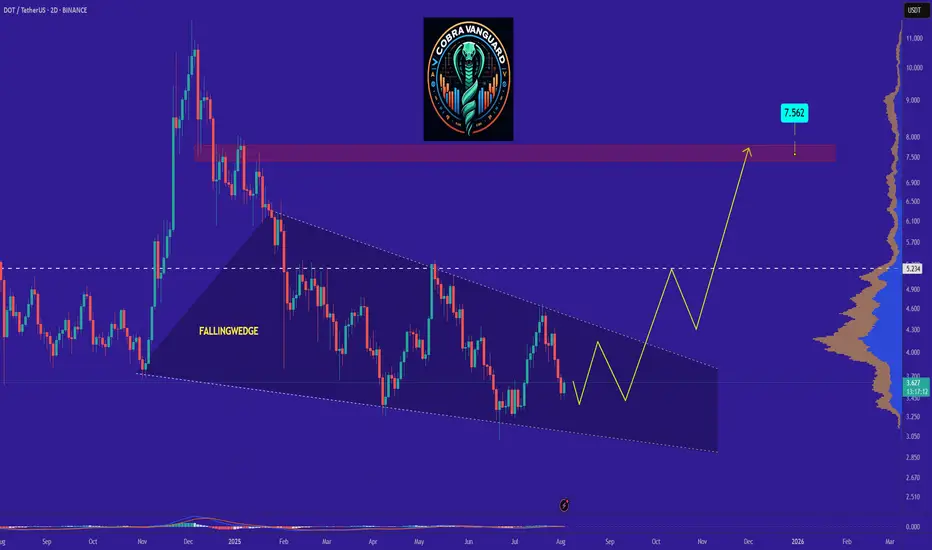
DOT is bullish now and many Traders don't see itSo if you pay attention to the DOT chart you can see that the price has formed a Ascending wedge which means it is expected to price move as equal as the measured price movement.( AB=CD )
NOTE: wait for break of the WEDGE .
Best regards CobraVanguard.💚
Dogecoin Bullish · $0.70 & 240% Profits PotentialThis is a great chart setup and I can even say it looks better than Cardano, but why? Because prices are lower, therefore there is more room available for growth. So it really depends on how you look at it.
Seeing Dogecoin producing a rising channel is good, but knowing that prices are still really low compared to the last high (December 2024) and also compared to the all-time high tells us that there is still plenty of room available for growth and it is early. The rising channel after the correction ended reveals that the market—traders, holders, investors, etc.—are buying and accumulating for what comes next. Can be anything, but everybody is already buying...
The current higher low support was found right in-between 0.618 and 0.786 Fib. retracement levels. Here marked with blue dotted and purple dotted lines.
We could say that it is possible to see two to three days green followed by another low, a lower low, and this is definitely possible but there is no bearish momentum, no sell side force. And thus we can conclude on an early end for this retrace. Another reason is the fact that the rise is more steep now compared to April, so the retrace should also be more steep and have a shorter lifespan. Agree, agree, agreed.
Dogecoin produced a perfect channel with higher highs and higher lows, the next move is a major jump with resistance at $0.70 and total growth potential reaching 240%. We can continue with this pattern and track the market long-term. It is what I do; it is what we have been doing for countless years now... And we are only getting started.
The best is yet to come.
Thank you for reading.
Namaste.

day 3 supported my MAs looking to hold till it hit tp or until the close of day 3. break even at 1:2 r:r

LINK Targets $21.60 with Bullish MomentumLINK Targets $21.60 with Bullish Momentum
After Bitcoin’s explosive surge to $118800, the entire crypto market is on fire, and Chainlink (LINK) is one of the standouts.
LINK has broken out of a well-defined bullish pattern and continues its upward push since yesterday.
If you're already in the trade, consider holding your position, as LINK shows strong potential to reach $17.60, $19.60, and possibly even $21.60.
If you're not yet in, an ideal entry zone to monitor is around $14.00 to $14.50.
Momentum remains strong, and the breakout structure supports further upside.
You may find more details in the chart!
Thank you and Good Luck!
PS: Please support with a like or comment if you find this analysis useful for your trading day

Lingrid | SOLUSDT Corrective Move Completed ? Long OpportunityBINANCE:SOLUSDT is forming a bullish higher low just above the 158.47 support after a corrective pullback from the recent higher high. Price structure remains within the upward channel, and the rebound from key horizontal support signals a continuation setup. As long as the 158.47–160.00 zone holds, price is likely to target the 192.00 resistance near the channel's top. The ascending structure supports a bullish continuation toward the upper resistance band.
📉 Key Levels
Buy trigger: Break above 172.00
Buy zone: 158.47 – 160.00
Target: 192.00
Invalidation: Drop below 150.00
💡 Risks
Breakdown of the ascending structure below 150.00
Rejection near 172.00 without momentum confirmation
Broader market weakness could suppress breakout potential
If this idea resonates with you or you have your own opinion, traders, hit the comments. I’m excited to read your thoughts!

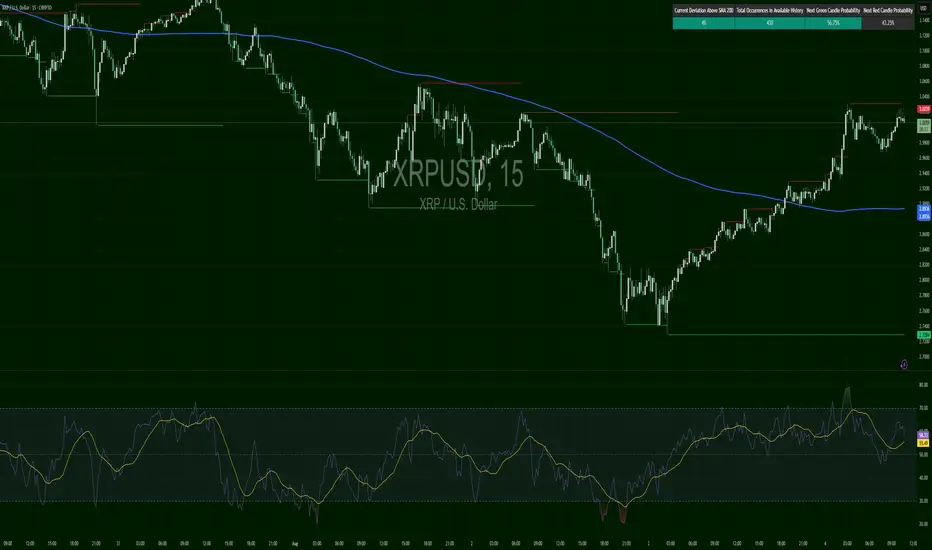
XRPUSD – Return to BattlefrontXRP lifted hard off support and is now hovering near $3.0166, just below resistance at $3.0329. RSI has surged back over 60, while green candle probability is decent at 56.69%.
TRXUSD – Above the CloudsTRX surged back above its 200 SMA, now at $0.33040, just below resistance. RSI at 63.5 remains strong. Price is riding an aggressive rally channel with strong follow-through potential.

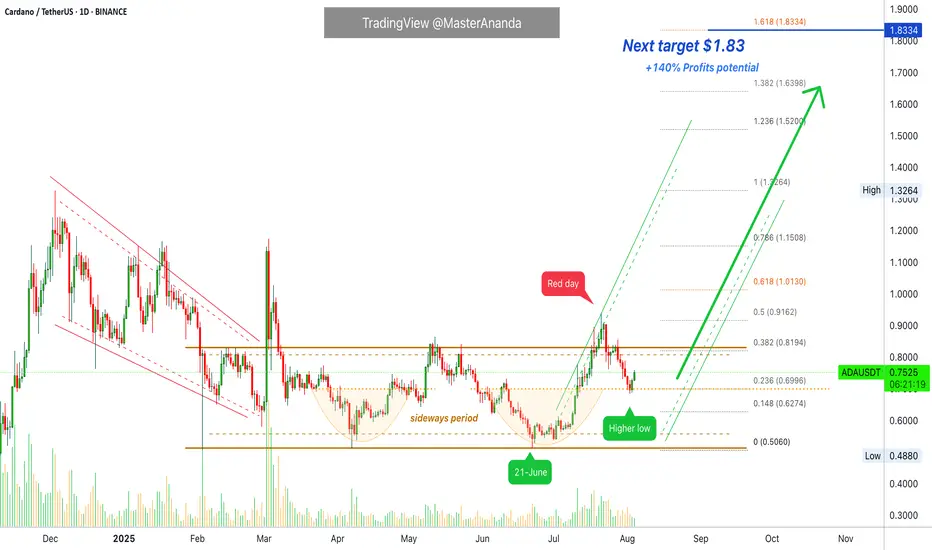
Cardano Higher High Hidden Signal Confirmed · UpdateGood news. We already have a higher low and Cardano back into the long-term accumulation zone but on the bullish side. You know a channel has a middle portion always and the lower portion relates to the bears while the upper portion is owned by the bulls. This is the good news, Cardano is staying safely, nicely on the bullish side of the 2025 consolidation channel. Cardano has been in this range almost the entire year but everything looks great.
The broader bias is bullish based on the strong advance late last year. This was a strong advance and every strong move needs to be consolidated before anything else happens. This is the correction followed by sideways action. After this phase is over, now, then we see a new move develop, the continuation of the previous move—the bullish wave.
We have 140% profits potential (PP) to $1.83 but this is still some middle way, mild, middle portion move. The market will continue to heat up, evolve and grow and as this happens we will be taking out several resistance zones and with these gone we can expect higher prices and finally the new all-time high we have been waiting for for so long. Patience of course.
Chart: Cardano (ADAUSDT) Daily Timeframe with MA200
Notice just three days below MA200 and now back above this level. In the past when ADAUSDT moved below MA200 it would stay months below this level. This time it was pierced briefly and the action moves back above. This means that the bulls are in control.
The retrace was short, small and low volume which means weak. Weak bears, weak sellers means that we are bullish and bullish means green.
With all this said and done, you can expect growth for months. Continue to buy, continue to trust and continue to hold. You will be happy with the results. Crypto is going up.
Energy for all readers. Let's grow together, let's be open, learn and share. The best is yet to come. You are special. You are a divine living being and you deserve the best... Thanks a lot for your continued support.
Namaste.
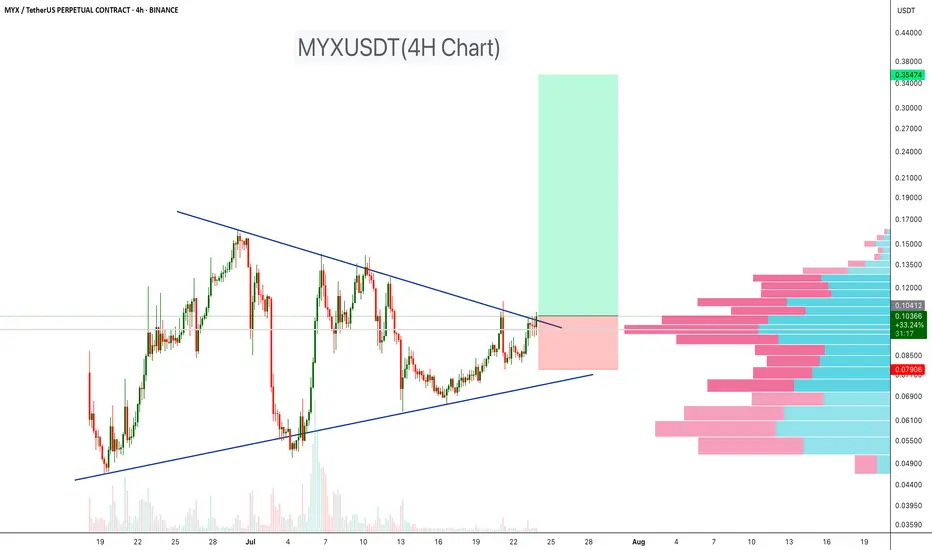
MYXUSDT Triangle Breakout!MYXUSDT is breaking out of a well-defined symmetrical triangle on the 4-hour timeframe, after weeks of consolidation between tightening trendlines. The breakout is occurring just above a high-volume node, as shown on the right-side volume profile, which now acts as a strong demand zone and potential support for continuation.
Price is currently holding above the breakout level ($0.105), with solid momentum and improving volume, indicating a potential trend expansion toward the projected target zone near $0.35.
Cheers
Hexa
Lingrid | BTCUSD Consolidation PHASE ContinuesBINANCE:BTCUSDT is bouncing from the confluence of an upward trendline and the $112,175 support level, forming a higher low structure. Price remains within an upward channel, with the current pullback holding above key structural support. As long as the higher low remains intact and price stays above $112,175, a continuation toward $120,500 is likely. Momentum appears to be rebuilding within the bullish framework after a period of consolidation.
📉 Key Levels
Buy trigger: Break and hold above $114,680
Buy zone: $111,500 – $112,500
Target: $120,500
Invalidation: Break below $111,000
💡 Risks
Failure to hold the trendline could trigger deeper downside
Resistance at $114,680 may reject early attempts to move higher
Market may stay range-bound if volume remains low
If this idea resonates with you or you have your own opinion, traders, hit the comments. I’m excited to read your thoughts!

XCN with potentialThis is one of my favorite assets, after all NFA. Do your research before investing and always trust your gut. This is what I see coming in the near future, long time frame. Don't forget to invest in what you can afford to lose.

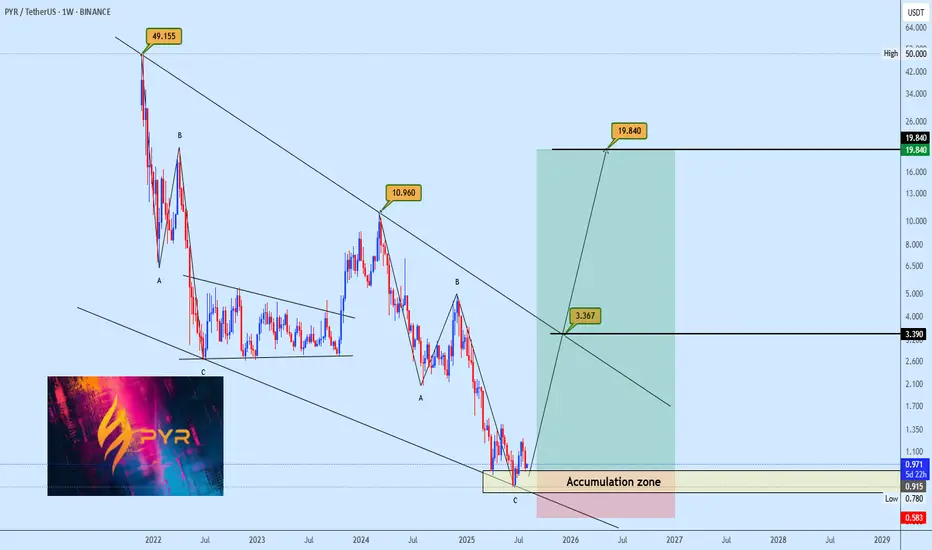
PYR Falling Wedge OpportunityPYR is currently forming a potential falling wedge, with price recently bouncing off the bottom support zone. The plan is to accumulate within the lower region of the wedge and anticipate a move toward the upper boundary. Profit targets are highlighted on the chart for clearer decision making. Keep your risk management in check and let us know your view.
Your feedback is always welcome
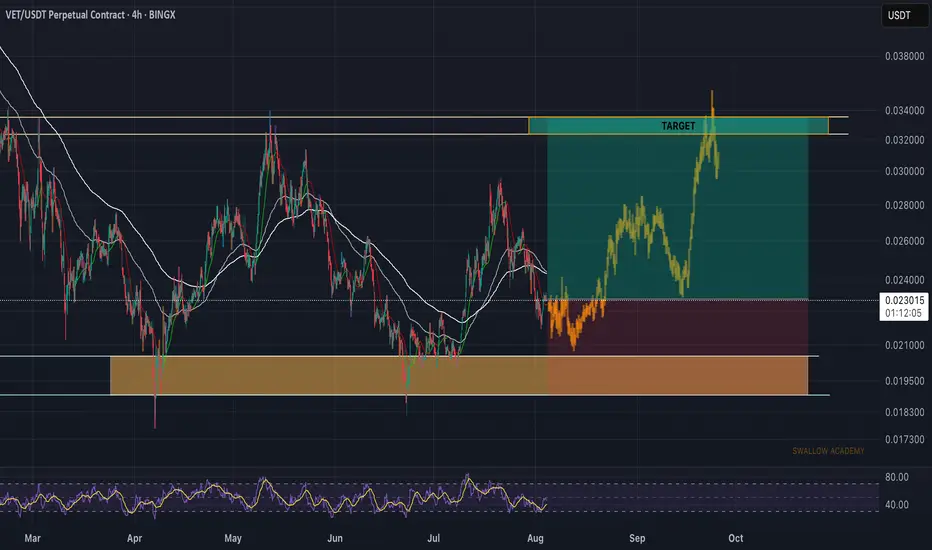
VeChain (VET): Good 1:3 Risk:Reward Trading OpportunityVET is giving us a decent 1:3 R:R ratio trade. We are seeing that sideways channel that has formed on VET coin where the price has tested the lower side of it, yet the upper side has not been tested for quite some time, which means we are intending to see that tested, and maybe broken as well, which would give us a good opportunity to long the coin on bigger timeframes until that bigger bullish CME gap!
Swallow Academy