Sei short to $0.2556 todayOpened a short position on sei just now. Aiming for $0.2556
market likely to push for another low again.
Sl: $0.2808
Tp: 0.2556
Market might push up a bit more. I didn't wait for ideal confirmation but invalidation is valid.
Crypto market

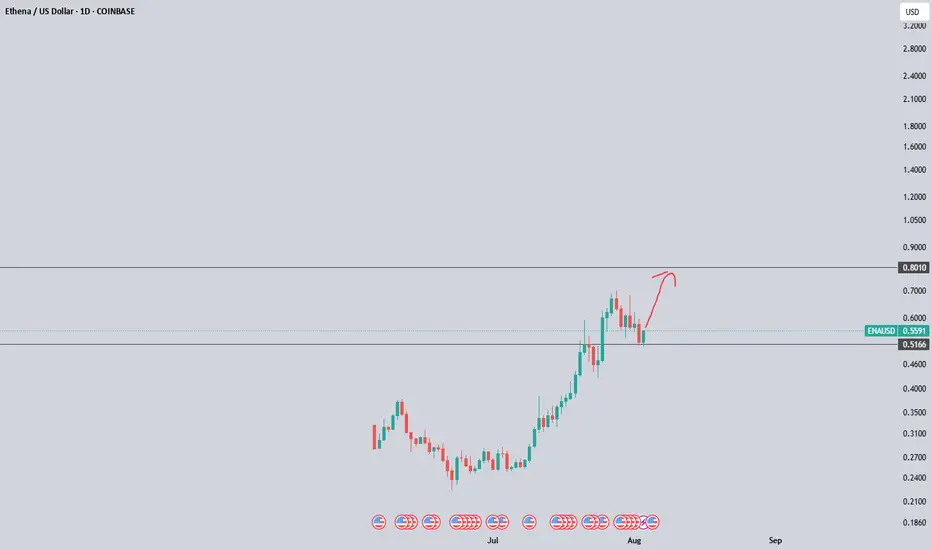
Ena !NFA.
I`m very bullish here.
I think we are likely bottomed here.
Consolidation a bit and run to 0.7 or 0.8.
Good luck!
ETH Derivatives Indicate Bearish Sentiment
A closer look at Ethereum's derivatives landscape reveals growing caution in the market. The 25-delta risk reversals on ETH options for August and September are trading between -2% and -7%, signaling a rising demand for downside protection. In comparison, BTC's risk reversals sit at a milder -1% to -2.5%.
Futures data adds to the picture: ETH open interest is at $47.5B, but key exchanges like Bitget and Hyperliquid show significant drops in long/short ratios (-9.08% and -9.35%). Meanwhile, Binance maintains a relatively low long/short ratio at 0.39, reflecting increasing short interest.
Despite ETH’s impressive 48% rally in July, recent price action has weakened, down 6% in 24h. This divergence between spot price behavior and derivatives sentiment may point to an upcoming correction.
⚠️ Worth watching closely: A break below $3,500 could trigger a sharper unwind of bullish positioning.

SONIC. USDTNote, that most of the news concerns a number of cryptocurrencies that have grown and are now adjusting their price.
But there are a number of cryptocurrencies for which there is no news.
One of these cryptocurrencies is Sonic.
" No news is good news".
So, it is not too difficult to guess that the first target for Sonic is $0.45.

BNB to 1k$NFA.
I`m very bullish here.
Consolidation likely till 5-6th august.
Run to 1k$.
Good luck!

Bullish ETH, 4k on the wayNFA.
I`m very bullish here.
Consolidation likely till 5-6th august.
Run to 4k 11-20th august.
Good luck!

Are we good to go?BTC.D broke slightly below the channel in July, and the August monthly candle has already retested it. Are we ready for a further downside on BTC.D?
BTC Trade Plan 03/08/2025 - where to buy BTC?Dear Trader,
Bitcoin's price is currently moving within a double channel, with the midline of the channel around 108,000. The first scenario is that the price reaches the midline of the channel and then starts an upward movement. The second scenario involves a sharp downward move towards a stop hunt target around 97,000-100,000. In both cases, as long as the price remains above the 100822 level(Daily Close), the bullish trend will continue.
Regards,
Alireza!

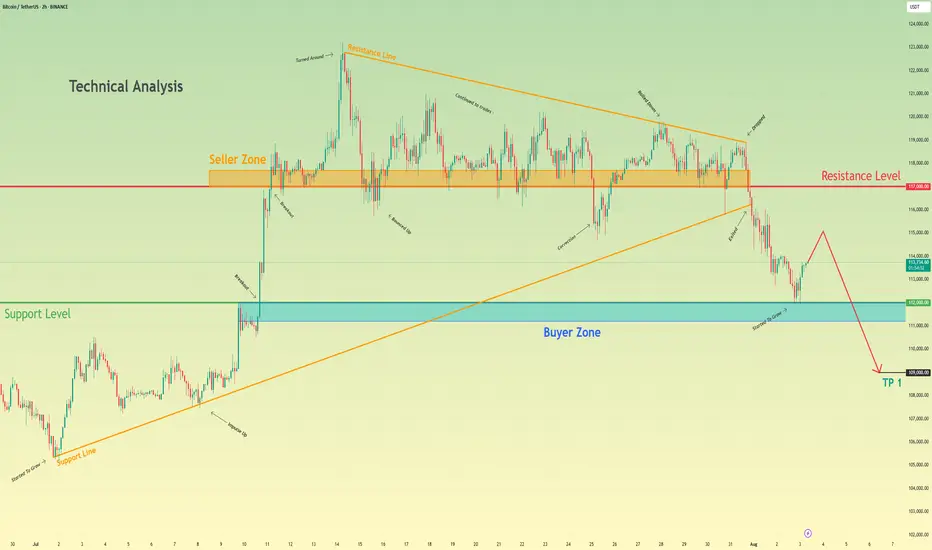
Bitcoin can continue to decline and break support levelHello traders, I want share with you my opinion about Bitcoin. Following an earlier upward trend, bitcoin entered a prolonged phase of consolidation, forming a large upward pennant where price action was tightly contested between the seller zone near 117000 and an ascending support line. This period of balance, however, has recently resolved to the downside with a significant change in market structure. A decisive breakdown has occurred, with the price breaking below the pennant's long-standing support line, signaling that sellers have ultimately gained control. Currently, after the initial drop, the asset is undergoing a minor upward correction, which appears to be a classic retest of the broken structure from below. The primary working hypothesis is a brief scenario that anticipates this corrective rally will fail upon encountering resistance from the broken trendline. A confirmed rejection from this area would validate the bearish breakdown and likely initiate the next major impulsive leg downwards. The first objective for this move is the buyer zone around the 112000 support level, but given the significance of the pattern breakdown, a continuation of the fall is expected. Therefore, the ultimate target price for this scenario is placed at the 109,000 level, representing a logical measured move target following the resolution of the large consolidation pattern. Please share this idea with your friends and click Boost 🚀
Disclaimer: As part of ThinkMarkets’ Influencer Program, I am sponsored to share and publish their charts in my analysis.
BTC/USDTWell, well, well, I see that Bitcoin has hit its main support. Those who bought and made profits can slowly exit.
GALA.USDTEvery price correction in Gala is a buying opportunity.
So, we can wait for the channel's upper limit of $0.02 to be reached.
But if the price can confidently overcome $0.02, a 200% increase is guaranteed.

Fet short to $0.6354Just opened this short on Fet. I think its highly probable that the market attempt to make another low.
DTT strategy applied to gauge the probability. Learn more on x.
Sl : 0.6354
Tp: 0.6029
2RR

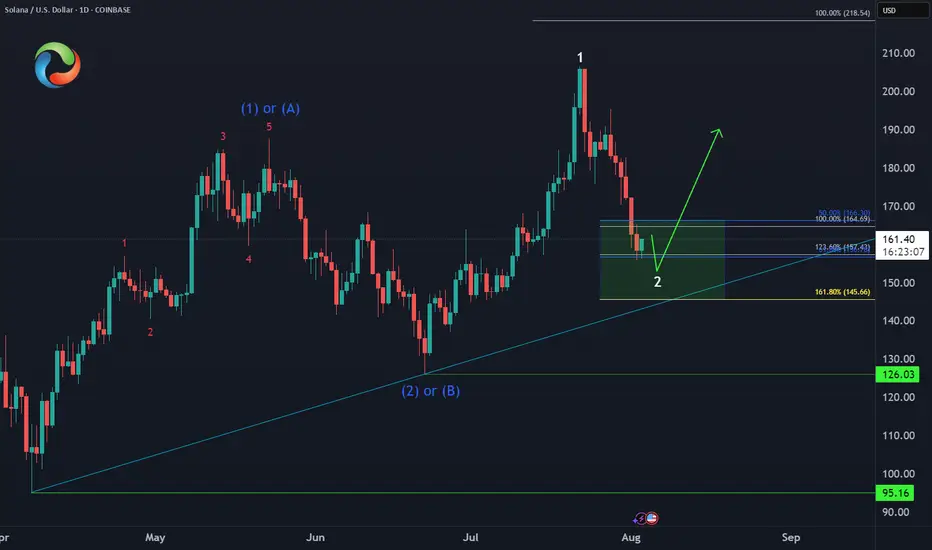
Solana SOL Extreme LevelsCRYPTO:SOLUSD Extreme Levels
50% - 61.8% Fib Ret ($166 - $156) ✅
Equal Legs area ( $164 - $145) ✅
Next Higher Target = $218 🎯
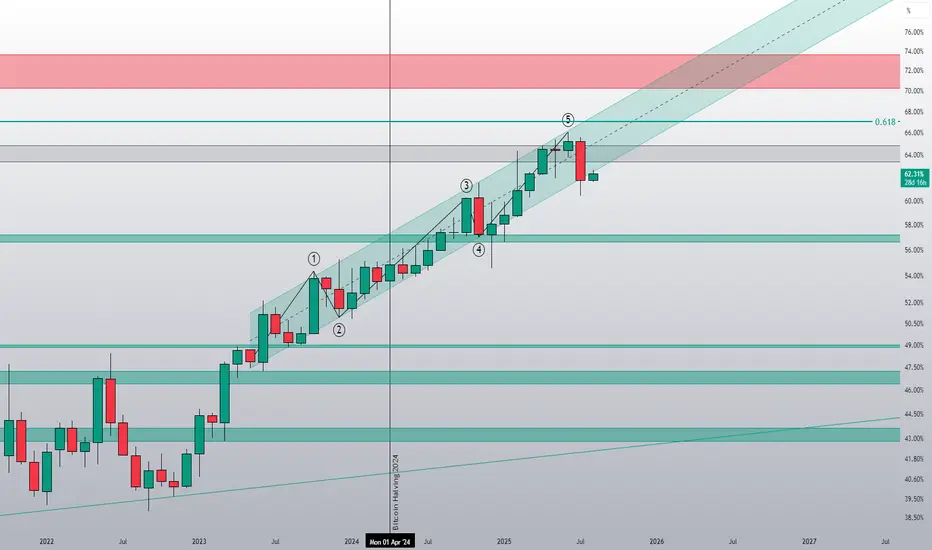
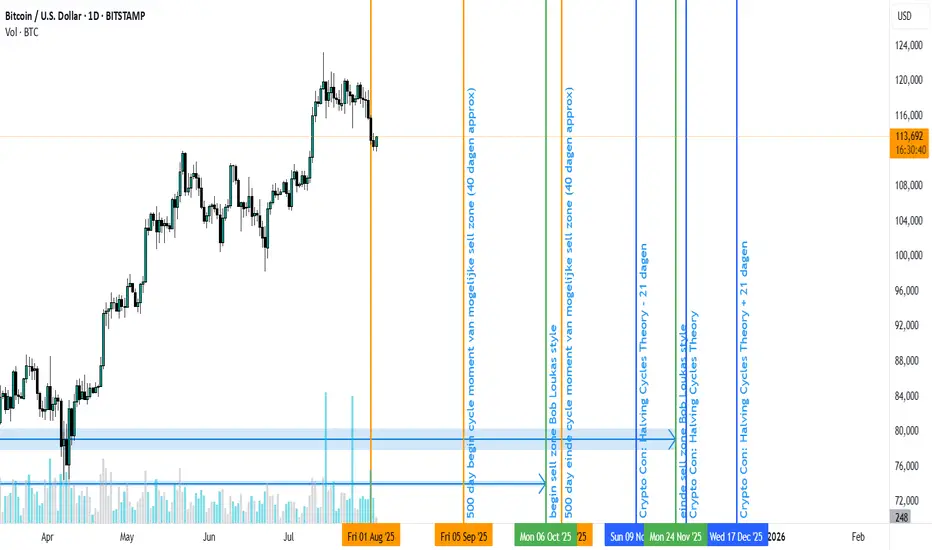
Next crypto/btc top timeframe according to different sourcesAccording to different sources the timing of the next crypto/btc top, could be as early as september 5th. See this chart for the different timeframes.
My current guess, if we get a rally towards $150k+ would be september/oktober.
UNI Liquidity Grab ReversalHey Candle Fam,
UNI’s been falling faster than weekend trading discipline—don’t worry, we stayed sober and spotted the setup before the panic hit. Let’s see if the market’s done crying yet or if there’s one last flush before the bounce. 💧📉
🔥 UNIUSDT.P TRADE IDEA 🔥
Bias: Long (Pending Confirmation)
Strategy: Liquidity Grab Reversal
Entry: $8.65 / $8.52
SL: $8.39
TPs: $9.20, $9.88
📊 Rationale:
– HTF structure: Clear breakdown from $11 top into unrefined imbalance—bearish until we trap the late shorts
– LTF signal: No BOS or CHoCH yet, but potential sweep forming under local support
– Liquidity target: Eyes on the zone under $8.60—this is where retail gets baited
🧠 Order Flow Note:
– OI bleeding out = exit of weak hands
– Funding flipped negative = short bias crowding
– CVD diving like a leveraged newbie in a pump-and-dump room—perfect for a reversal play
We don’t buy red candles. We buy their fear.
Wait for the trap, then we strike. Precision, not impulse.
Candle Craft | Signal. Structure. Execution.

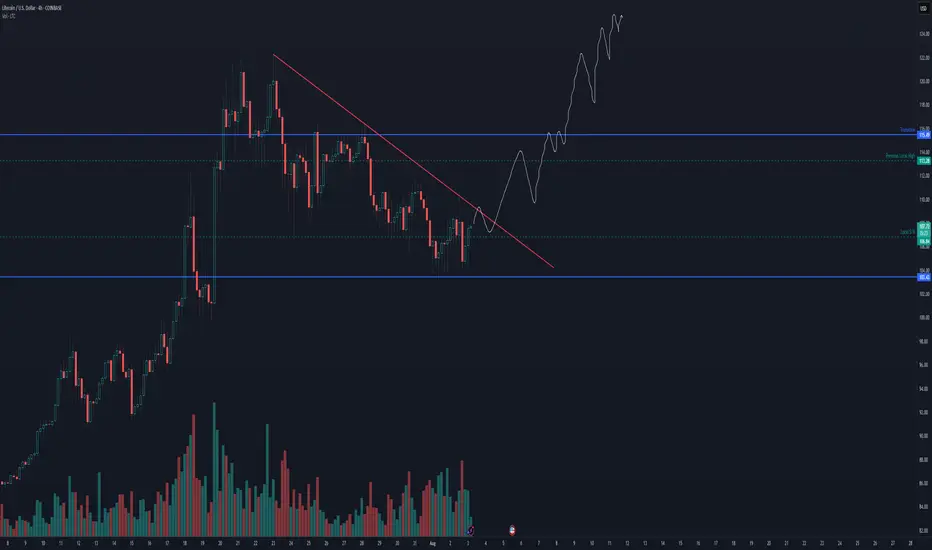
Litecoin is about to begin a leg upLitecoin is about to begin its first expansion. Alt season seems to be well underway and mid caps like LTC are next on the docket for money flow.
ETH Faces Sharp Rejection at Triangle Resistance📆 On the 3D chart, CRYPTOCAP:ETH just got rejected from the upper boundary of a symmetrical triangle — a clear resistance reaction ❌
That rejection triggered a swift 14% drop 📉, putting pressure back on lower support zones. The structure remains valid, but bulls need to step in soon to avoid deeper losses.
This is a critical spot — will buyers defend the level, or does ETH have more room to slide?
👀 All eyes on support now — next move could be fast.
Not financial advice.

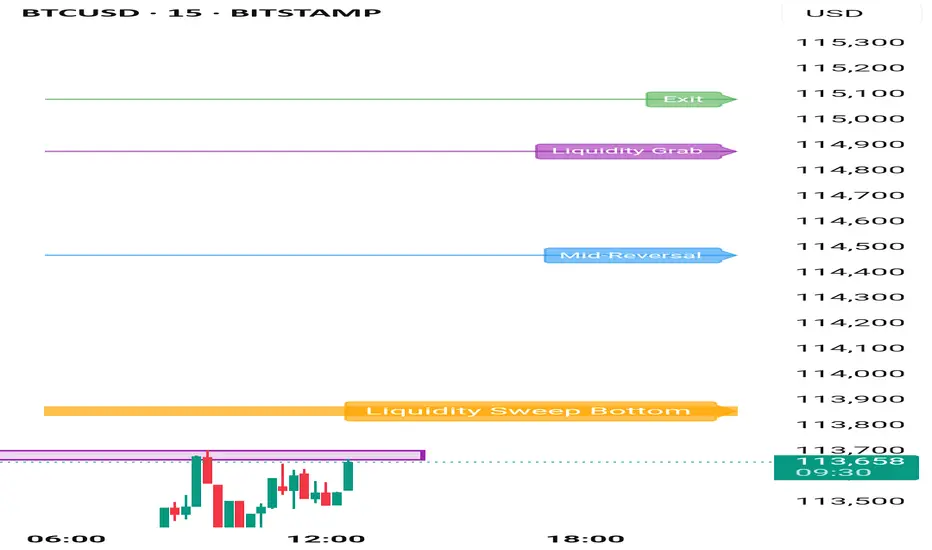
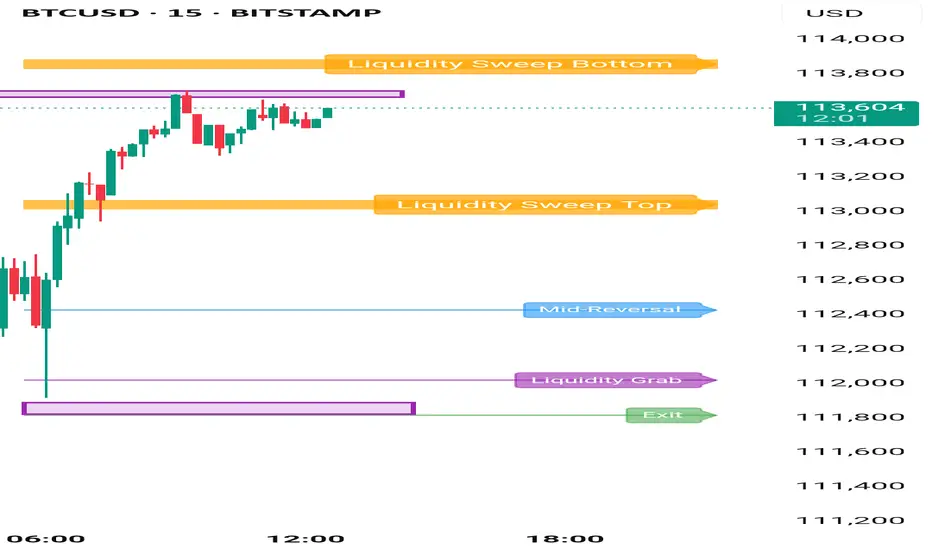
Targets for BitcoinIf we see break out of liquidity sweep . Liquidity Grab will be the target for bullish moment.
This charts and levels are plotted on the concept of liquidity sweep .
Once breakout of liquidity sweep, price should move till liquidity grab & after liquidity grab should take rejection and reverse for bottom liquidity sweep .
Strategic Long Position on Ethereum (ETH)
Ethereum's funding rates have spiked, reflecting an overcrowded long side. Such conditions often precede a long squeeze, as the market seeks to shake out overleveraged traders.
Despite this risk, the current bullish momentum justifies a tiered entry approach:
First Entry (Market Order): 3,790
Second Entry (Limit Order): 3,550
🛑 Stop Loss (for both entries): 3,400
🎯 Take Profit Target: 4,200
This setup allows participation in the upward trend while leaving room

Bit coin trade IdeaBit coin if closes above liquidity sweep we can expect a bullish moment . If taken proper rejection from liquidity sweep then bearish till liquidity grab . Zone to zone ..on the basis of Liquidity Concept.
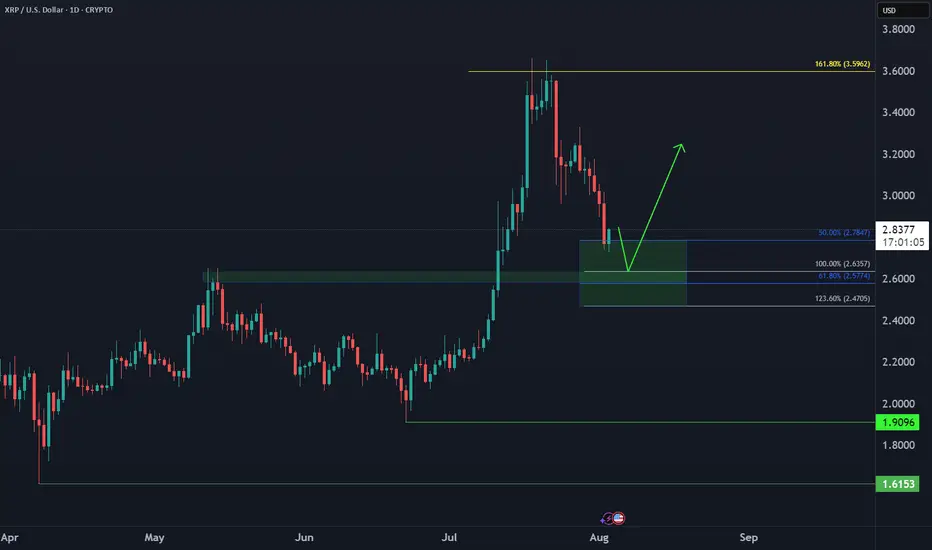
Ripple XRP Bullish Reversal📈 CRYPTO:XRPUSD dropped in 3 swings vs June low, now in buy zone $2.78–$2.47. Marginal lows still possible, but bounce expected next week from this extreme area.
Swing opportunity on cluster support, technical & macro plan__________________________________________________________________________________
Technical Overview – Summary Points
__________________________________________________________________________________
Momentum : Tech sector bias supportive on higher timeframes (Risk On / Risk Off Indicator “Buy” on 1D/12H) despite MTFTI “Down” on intraday (15min to 6H).
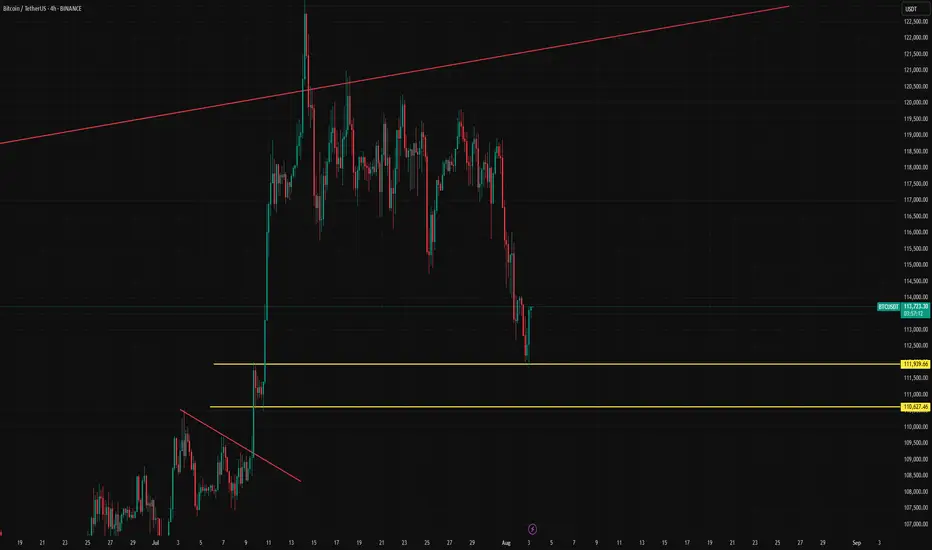
Key Supports : Major cluster at 111,900–112,772 (W Pivot High, 12H/24H Pivot Low). Critical defense short/mid term.
Resistances : 114,723, then 115,900, then 119,800–122,318 (break to relaunch impulse).
Volumes : Moderate to normal across all timeframes: no panic or capitulation.
Multi-TF Behaviour : ISPD DIV neutral everywhere: neither fear nor euphoria; wait-and-see market. No climax nor emotional extremes: conducive to squeeze or extension after catalyst.
__________________________________________________________________________________
Strategic Summary
__________________________________________________________________________________
Global Bias : Neutral to cautious bullish if 111,900–112,772 holds (invalidate if <111,900).
Opportunities : Defensive swing long entries on support. Gradual targets: 114,723, 115,900, 119,800–122,318.
Risks : Daily/4H close below 111,900 = acceleration towards $110k/$105k (on-chain air-gap).
Macro Catalysts : Geopolitical tensions (Gaza/Ukraine/China), China crypto ban headlines, sector decoupling, Fed/BoE policy.
Action Plan : Strict stop management (<111,750), agile on volume/ISPD signals. Critical macro monitoring: any exogenous move can trigger directional volatility.
__________________________________________________________________________________
Multi-Timeframe Analysis
__________________________________________________________________________________
1D (Daily) : Key support 114,723.2. Tech sector indicator (Risk On / Risk Off Indicator) bullish. MTFTI Up. Normal volume, no panic. Lack of ISPD oversold signal.
12H : Support W Pivot High 111,900 – 12H Pivot Low 111,920. Uptrend, moderately higher volumes, ISPD neutral. Battling for support maintenance and bounce.
6H : Core pivot support 111,900–112,000. MTFTI Down. No volume excess or sentiment signal. End of momentum, increase vigilance.
4H : Weakness confirmed, supports 112,000–112,500, resistance 117,722 to 119,800. Last short-term rampart tested.
2H-1H : Bearish, attacks on 111,900–112,772 supports, immediate resistance at 114,723/115,900. Weak range market.
30min-15min : Neutral, lower range between supports (111,900–112,772) and resistances (113,950–114,723). Volatility on breakout events, no sector bias.
Risk On / Risk Off Indicator : Persistent “Buy” on higher timeframes (12H/1D), neutral/bearish intraday (4H and below).
ISPD DIV : No extremes detected: no exhaustion, panic or major oversold; “range” environment.
Volumes : Normal, no climax or anomaly. Market awaiting a catalyst.
__________________________________________________________________________________
Fundamental, Macro Events, Sentiment Overview
__________________________________________________________________________________
Macro : Newsflow on China crypto ban, multiple tensions (Gaza, Russia-Ukraine), Fed/BoE slowing. Globally cautious setting despite no direct institutional shock.
On-chain (Glassnode) : Major OTC sale (~80k BTC) absorbed, 97% supply in profit: “moderate euphoria” phase, not capitulation; on-chain supports $110–117k, resistance $125–141k, air-gap below $115k.
Twitter : No panic, “final wick” narrative then anticipated technical rebound. No institutional outflows. China ban read as cyclical FUD.
__________________________________________________________________________________
Summary & Action Plan
__________________________________________________________________________________
Support 111,900–112,772 = key multi-TF cluster; area for defensive swing opportunity.
MTFTI is “Down” on lower TF, but Risk On / Risk Off Indicator bullish on daily/12H.
No capitulation, normal volume, market waiting for catalyst.
Swing bullish invalidated below 111,900—stop required, R/R 1:2 minimum.
Fast reclaim above 114,723 plus strong upside volume: short squeeze & potential extension to 119,800–122,318.
Macro monitoring essential (China ban, monetary policy, geopolitics).
__________________________________________________________________________________
Operational Summary : Favor defensive swing long plans on multi-TF cluster support (111,900–112,772), strict stop <111,750, progressive TPs to 114,723/115,900/119,800. Stay opportunistic: bias cautiously bullish but risk management is paramount in a cautious global environment and with no strong extremes detected.
__________________________________________________________________________________

ETH/USD – Critical Reversal Zone?
### 🚀 ETH/USD – Critical Reversal Zone?
**🔍 ETH Futures Multi-Model Signal | Consensus: LONG | Confidence: 77%**
---
**🧠 Key Highlights (DS + OA Model Consensus):**
* **Price:** \$3,375 → Trading *below* EMA9/SMA20 = short-term bearish, but hitting strong **support zone**
* **Support:** \$3,248 (Bollinger Lower) & \$2,987 (SMA50)
* **Resistance:** \$3,487 (EMA21), \$3,620 (SMA20)
* **Volume:** -10.3% (5D) → Selling **weakening**
* **RSI:** 49.5 → Neutral but oversold on short-term
* **MACD:** Bearish crossover, but showing **divergence**
* **Volatility:** Bollinger width 9.18% = **Breakout Setup**
---
### 📈 Trade Setup – Conditional LONG
| Entry | Stop Loss | Target | R/R | Confidence |
| ------- | --------- | ------- | ------ | ---------- |
| \$3,375 | \$3,229 | \$3,690 | 1:3.24 | 77% ✅ |
🪙 **Trade Type:** Scale-in (50% @ \$3,375, 50% @ \$3,275)
📊 **Take Profits:**
* TP1: \$3,485 (EMA21)
* TP2: \$3,590 (SMA20)
* TP3: \$3,690 (Weekly VWAP Anchor)
---
### ⚠️ Risk Dashboard
* 🚨 BTC < \$58K → Setup invalid
* 📉 No Open Interest Data – monitor liquidation triggers
* 🧠 Max Position Risk: **1.25%** | Use hard stop-loss
* ⏰ Entry Timing: **London Open (8:00 GMT)**
---
### 💬 TL;DR
ETH is sitting in a **high-confluence reversal zone**. Weak sell volume, macro bullish trend, and volatility contraction signal a potential bounce. 📊 **Risk-defined long** setup favored by both models.
🧠 “Smart money doesn’t chase — it positions early.”
---
📌 **#ETH #CryptoTrading #ETHUSDT #Futures #BreakoutSetup #BollingerBands #MACD #RSI #DeFi #Ethereum #CryptoSignals #TradingView**
