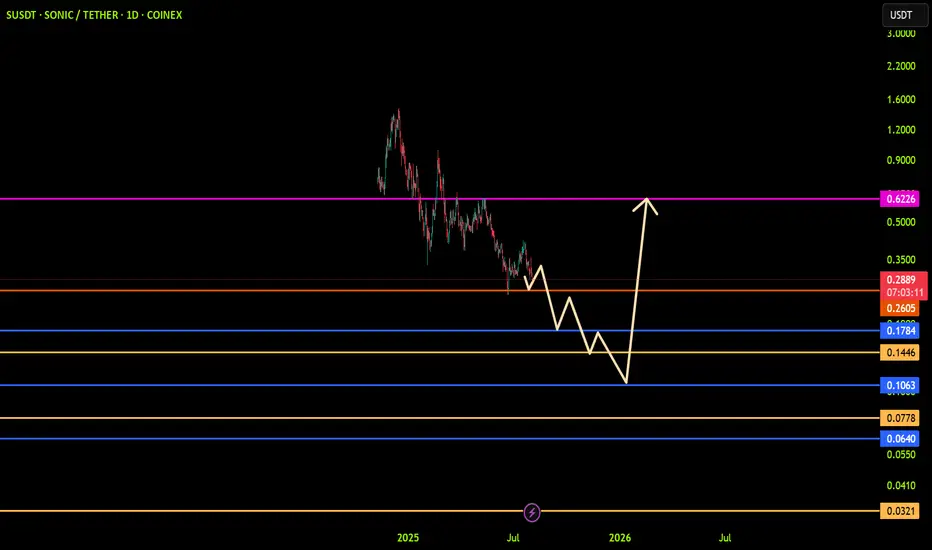
SUSDT: trend in daily time frames ((((( Each of these entries can reach the main TARGET)))))
The color levels are very accurate levels of support and resistance in different time frames, and we have to wait for their reaction in these areas.
So, Please pay special attention to the very accurate trend, colored levels, and you must know that SETUP is very sensitive.
Be careful
BEST
MT
Crypto market
EPIC : Risky signal...Hello friends🙌
🔊Due to the good price growth, we have found important support points for you.
Now, due to the price correction, we have found buy points for you and you can buy with risk and capital management and move with it until the goals we have set for you.
🔥Follow us for more signals🔥
*Trade safely with us*

Adding to Pump Trade X7Original entry $0.002275
Liq price $0.001969
Sold 50% at $0.0028
Adding to trade $0.002587 with 7x
Than add B/E
1st Target $0.0042 to sell 50%

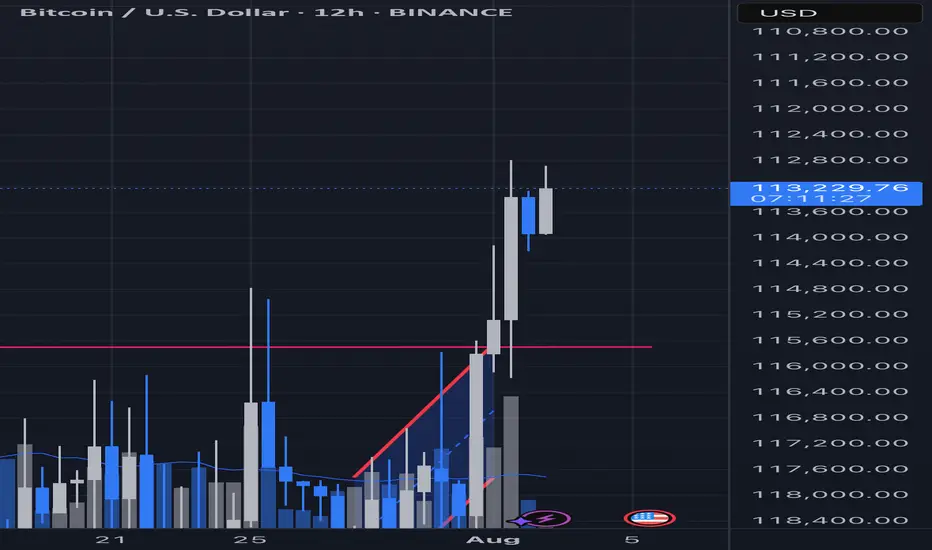
Bitcoin beginning a 12 hour reversal formation?(Inverse chart)I believe we are working on a top (bottom) of this 12 hour chart. If I am right this will result in a swing fail and begin a string reversal
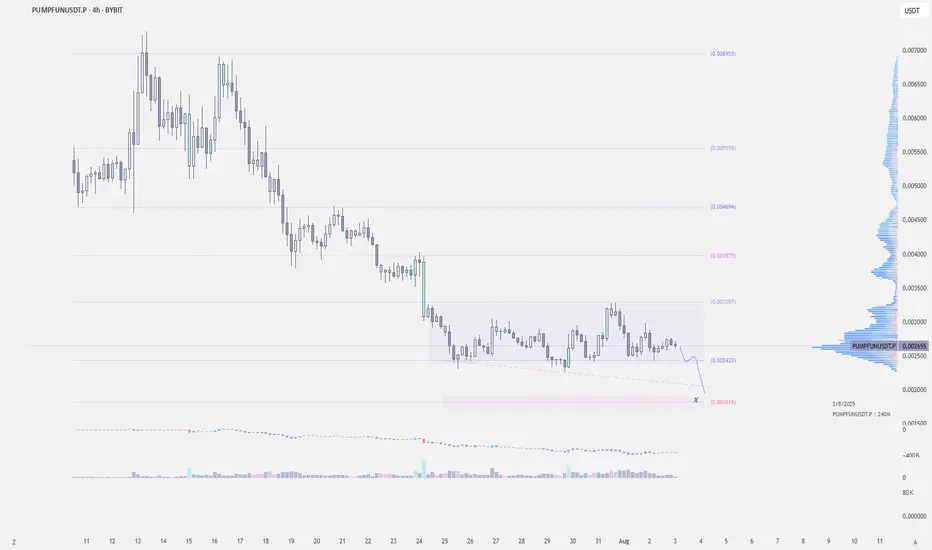
$PUMP May Still Dump to .0020-.0018BYBIT:PUMPUSDT | 4h
PUMPFUN is one of the few coins still holding support during the dump.
It’s looking tempting here, but a drop to the 0.0021–0.0018 zone is still likely.
Planning to long around 0.0021–0.0018
Targets:
.0028-.0032
.0037-.0040
.0045-.0048
Kas short to $0.0816Just now opened a short on KAS.
Sl: $0.08749
limit entry: $0.08548
Tp: $0.0816
Risk to reward: 1:2
DTT analysis applied - learn more on X

ERA : Risky but profitableHello friends🙌
Given the high that has been made and the price has returned, there is a possibility that the price will correct to the middle of the move, which is why we have provided two buying levels for you, which you can buy with risk and capital management and move towards the specified goals.
🔥Follow us for more signals🔥
*Trade safely with us*

daily BTC analysis Bitcoin breaks the $115,000 level and approaches $112,000. Personally, I expect this level to be unsustainable and the next level is $110,000. This analysis is not financial advice in any way.Crypto Futures Trading Could Destroy All Your Money

btcwow...!!!!!!!
btc have negative divergence in weekly time and it can be start down trend or correction trend
this analyse is not 100% true but it can probebly

Could this be the end of Bitcoin’s trend?The Current State of Bitcoin’s Trend: Has the Uptrend Come to an End...?
Based on recent analyses, Bitcoin has exited its 4-hour channel over the past few days, and there is still a possibility for further correction. However, this does not mean that the uptrend for Bitcoin is over.
My targets for Bitcoin remain the same as before: 123,700 and 129,710. It’s even possible that we might see a wick above these prices.
For those with more capital who are looking to buy Bitcoin, there are two good entry levels:
110,880
109,770
Everything else is clearly shown on the chart. Please be cautious, as there will likely be high volatility once the market opens.
Be sure to open the analysis link and boost the analysis with your likes.

BTCUSDT: Good Opportunity to buy Bitcoin has dropped sharply since NFP data came out. We can now see price reversing nicely from 109k area.

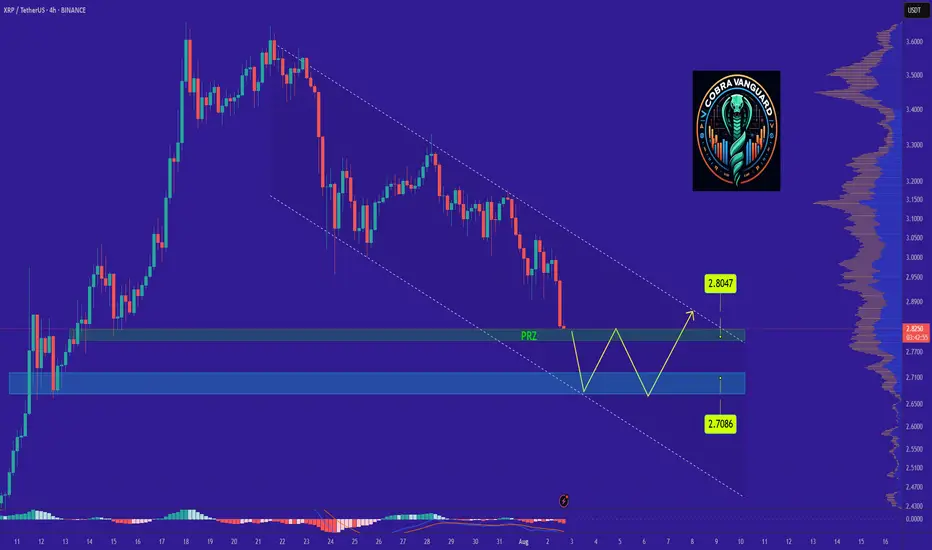
XRPs Situation (Daily) !!!If the price loses the PRZ range, it will drop to the bottom of the channel and then rise to the top of the ascending channel, which will take some time.
Best regards CobraVanguard.💚
80% drop into the abyss for Solana? - July 2025** The months ahead **
Examination of the 3-week chart for SOLANA reveals several compelling technical signals that suggest a potential bearish trend reversal. This analysis highlights crucial patterns traders and investors of Solana should consider.
1. Formation of a 3-Week Death Cross:
A notable bearish signal prints on the chart: a ‘3-week death cross’. This follows a ‘2-week death cross’ that preceded a significant downward movement, just as in early 2022. The death cross, where a shorter-term moving average crosses below a longer-term one, is a strong indicator of a shift towards a bearish trend, especially on higher timeframes like this 3-week chart.
2. Broken Market Structure:
The chart clearly indicates a “broken market structure.” This typically occurs when the price fails to create higher highs and higher lows during an uptrend, or in this case, breaks below a significant support level that had previously held. It is absolutely possible price action backtests past support for a resistance confirmation, however on looking left, such a test never occurred on the last death cross.
3. Resistance from Previous Peaks (Head and Shoulders Pattern):
Price action leading up to the recent highs resembles a potential ‘Head and Shoulders’ pattern. The three distinct peaks, with the middle peak being the highest, suggest a classic reversal pattern. A subsequent break below the ‘neckline’ (implied support level below the peaks) would confirm the bearish outlook.
4. RSI Oscillator (bottom of chart) resistance
The lower panel of the chart displays an RSI oscillator indicator, which shows a clear pattern of "resistance." following a period of support since 2023. The RSI has clearly confirmed resistance from almost 3 years of support.
5. Solana vs Bitcoin
All the bearish observations made on the SOL-USD trading pair can be observed on the same 3 week time frame for the SOLANA - BITCOIN trading pair:
6. Potential for Significant Downside Target:
Based on the measured move from the previous death cross and breakdown and Fibonacci extension, the chart illustrates a potential downside target of approximately -70% from current levels toward the $30-40 area. While this is a projected target and not guaranteed, the historical precedent following similar bearish signals provides a context for the potential severity of the downturn if the bearish momentum continues.
Conclusion:
Considering the confluence of a 3-week death cross, broken market structure, resistance from previous peaks (suggesting a potential Head and Shoulders pattern), and the confirmation of RSI resistance, the outlook for SOLANA on the 3-week timeframe appears distinctly bearish.
Is it possible price action continues upwards after a 3200% rally? Sure.
Is it probable? No
Ww

Bitcoin is experiencing a major collapse!Bitcoin will fall further from August 8th and crypto will officially end.

Eliot ABC correctionThe theory maintains that markets move in repetitive fractal patterns, where each complete cycle consists of eight waves: five in the direction of the main trend (impulsive) and three in the opposite direction (corrective). Wave C, being the last component of the ABC correction, offers opportunities to enter positions favorable to the resumption of the major trend.

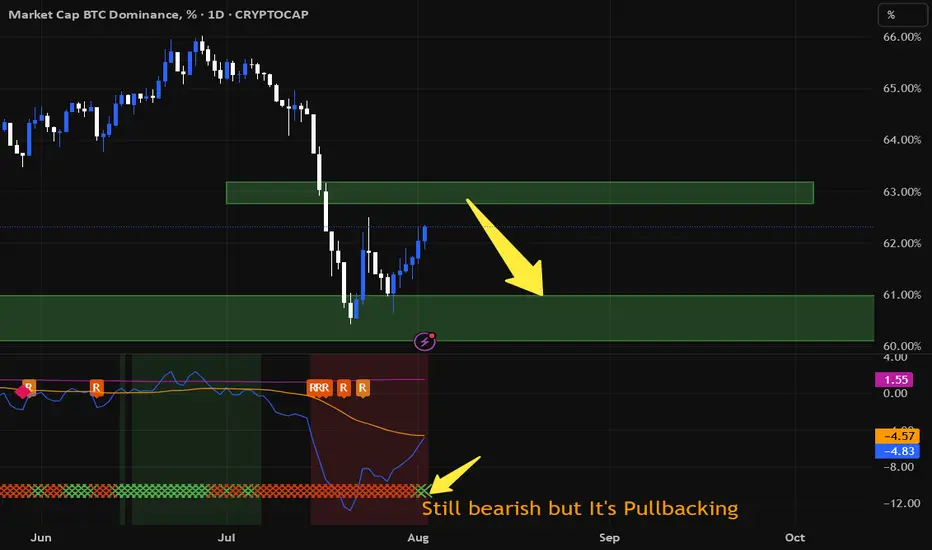
#Bitcoin DominanceWhat I said before is that Bitcoin dominance is in a pull back and the "NEW RSI" indicator also shows it on the daily time frame. Probably, considering the Fibonacci levels at 63%, this pull back is over and after the Bitcoin dominance continues to fall, the pump of altcoins like Ethereum and Ripple will continue.
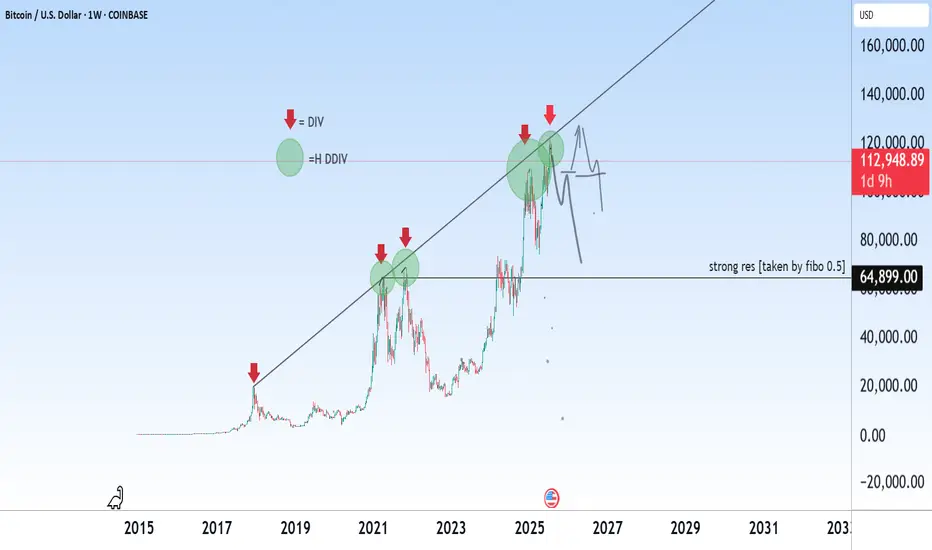
Bitcoin is experiencing a major collapse!BTC/USD – Historical Cycle Analysis & Mid-Term Outlook (1W)
Exchange: Coinbase
Timeframe: Weekly (1W)
Key Observations:
Long-Term Trendline Resistance
The black ascending trendline has historically acted as a major resistance zone since 2017.
Every touch of this line in the past has been followed by a significant correction.
Bearish Divergences (DIV / HDIV)
Red arrows indicate historical bearish divergences on RSI/MACD.
Each divergence marked a local or macro top before a sharp retracement.
Major Historical Resistance – $64,899
Derived from 0.5 Fibonacci retracement of the primary cycle.
Served as a key ceiling during previous cycles before new all-time highs.
Bitcoin Cycle Behavior
BTC historically forms parabolic tops followed by deep corrections.
The current cycle (2024–2025) mirrors 2017 and 2021 structures, suggesting we may be approaching a macro inflection point.
Mid-Term Scenario
Price near the trendline (~$120K) implies high risk of volatility and correction.
Primary support zone: ~$65K (historical + Fibonacci confluence).
Likely scenario: range-bound movement between $65K–$120K before any sustainable breakout or new parabolic leg.
Corection?Frankly, I'm confused. The 4-hour trend is broken, and there's a possibility of a bad weekly candlestick... A correction down to the lower channel is likely for a while. Of course, 2% fluctuations are possible.

THORChain Prepares New Bullish Wave · Trades at Bottom PricesLook at the period between June 2022 and October 2023. This is literally what we call "bottom prices," and this is exactly what we have now.
In this case, RUNEUSDT, the period starts January 2025 until this present day. THORChain is trading at bottom prices. The best time to buy before a major bullish wave.
Look back to October 2023, after a very strong and prolonged sideways period, the market turned extremely bullish, this is the exact same pattern we will have again. After months and months of sideways, the market will recover and turn, producing a new trend, an uptrend.
In late 2020, also around October, there was another consolidation period at bottom prices before a major rise. So this happens all the time. THORChain goes up and then hits bottom. Once at the bottom it lingers there for a while finally to recover and become super bullish. Each bullish period lasts anywhere between 6-12 months. Can be more or less depending on when you start to come but the project has been proven to move wild and big when the bulls are in. Which is what comes next.
Do not be deceived by the low prices or the short-term, everything can change in an instant and you already saw the preview, you already saw what is possible and to this market phase we are getting close. We are getting close to the next bullish wave and this wave will produce marketwide growth. Many more pairs will move compared to previous cycles and the advance will last that much longer.
It is already happening. The low was hit in January, almost 8 months ago. We are about to move higher, the highest prices since 2021.
Namaste.

ETHUSDTDISTRIBUTION +ACCUMULITON= RE ACCUMULITON
Accumulation begins and reaccumulation is being completed and the Wyckoff structure is completed
Composite Academy and Analysis
Professor Ramtia Siddiqui
Aram Pizbin Professor
BINANCE:ETHUSDT

GOAT / USDT : Watch closely for a breakdownGOAT/USDT - Watch Closely!
Currently testing the critical support trend line.
Bullish Scenario: If it holds here and bounces, we could see a potential upward move.
Bearish Scenario: A breakdown below this support would confirm further downside, and I'd be leaning bearish in that case.
Pro Tip: Wait for confirmation before entering – either a strong rejection off support for bullish entry or a clean break for a bearish setup.
Stay alert and trade wisely!

Cosmos 365 · Proof of Bullish · Bull Market Wave NextCosmos (ATOMUSDT) has been sideways for an entire year now. The current trading range is a long-term support, buy and accumulation zone. This zone is already proven to be a bullish launchpad based on late 2024. The same levels were active in August-October-November 2024 leading to a mild bullish wave. This is only the start.
The same support range is activated again in Febraury-March-April-May-June-July-August 2025 and this will lead to a major bullish wave. Notice that the first period of consolidation lasted only three months and thus we had a mild wave only. With now six full months of consolidation the next bullish wave will be at least twice as big. But the market and how participants act and react doesn't work linearly. A six months consolidation period can lead to a bullish wave that is 3-5 times stronger than the previous one.
What you are seeing right now is actually pretty good. ATOMUSDT is red, yes. Notice weeks of bearish action yet no new lows, no significant challenge of support. More sideways which is as bullish as it gets. We already saw many examples of a downtrend and how the market goes lower and lower always producing new lows. This scenario is far from being what is present on the chart.
ATOM has been dropping for weeks but its price isn't affected that much negatively because this is only a minor retrace. An intermediary pause. The positive side of this type of market behavior is how it tends to unravel. It goes from quiet and shy to fast, surprising and unexpected. The market can change any day.
You can start seeing bullish action tomorrow just as it can start next week or the week above. The retrace has been going long enough and it lacks volume and momentum, sellers are running dry; when momentum dies down, the market turns.
Look at Bitcoin, it isn't dropping anymore. It stopped at the previous high and so far this is a strong support. Even if it moves lower, we continue bullish above $100K long-term. It is normal for a small pause before additional growth. $15 is an easy target, ATOM can grow much more in the coming months. Late 2025-early 2026 are the best dates for higher prices. Buy now and hold.
Namaste.

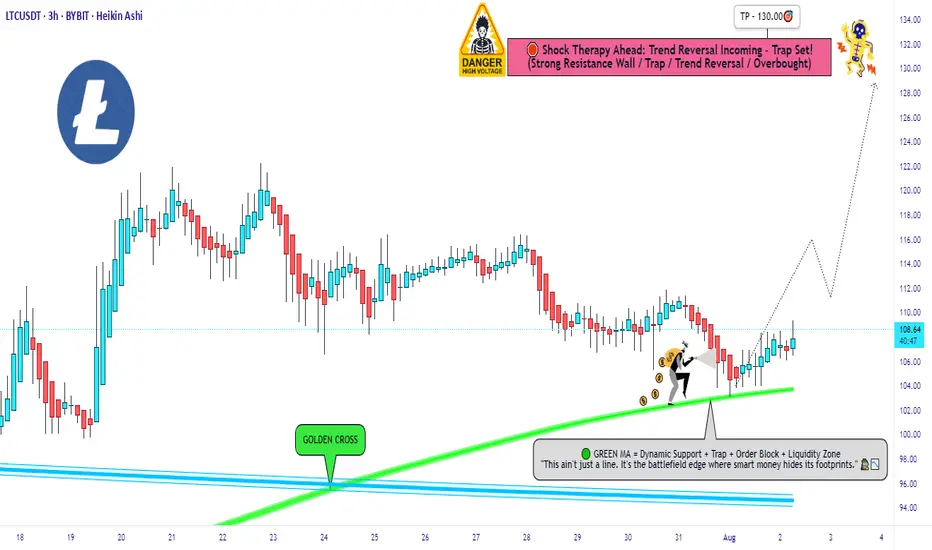
LTC/USDT Robbery Underway | Bullish Setup, Get In Now!🔥💎 LTC/USDT HEIST PLAN: ROB AT ANY PRICE! 💎🔥
🚨 Bullish Move Incoming | Layered Entries | Thief Trader Exclusive 🚨
🌟Hi! Hola! Ola! Bonjour! Hallo! Marhaba!🌟
Dear Money Makers & Market Robbers, 🤑💰💸✈️
The time has come for another high-stakes Thief Trading heist, and this time we're lockin' in on LTC/USDT – aka "Litecoin vs Tether" 💣💸
🎯 Thief’s Mission Plan: BULLISH AT ANY PRICE LEVEL!
We're going full stealth mode with a layering strategy — stacking multiple limit orders like a true pro thief preparing for a clean escape! 🔪📉📈
🚪 ENTRY: "Anywhere, Anytime" 🚪
📈 Buy from any price level — but for optimal entry:
🟢 Use Buy Limit orders near recent lows (15-30 min TF)
🔔 Don’t forget to set alerts for breakout confirmation!
🛑 STOP LOSS: Strategic Defense 🛑
🗣️ "Listen up, team! Stop loss ain’t a maybe — it’s your armor. Place it smart, or prepare for pain." 🔥
📍Recommended SL: 100.00
🔐 Adjust based on your lot size & how deep you stack your orders.
🏁 TARGET: 130.00 🏁
💸 But always Escape Early if the plan gets too hot!
Use a Trailing SL to lock in gains and slip out clean 😎🧨
🧠 PRO TIPS from the THIEF:
🔎 Only Buy. No Shorting!
💣 Scalpers: Jump in with the trend, not against it.
🧲 Swing Traders: Stay patient, and execute the full heist.
🚀 Use Trailing Stops – Let profit ride, but stay protected!
📢 MARKET INSIGHT:
🔥 Bullish Bias backed by:
✅ On-Chain Metrics
✅ Sentiment Shifts
✅ Macro Flows
✅ COT Reports
✅ Intermarket Divergence
⚠️ TRADING ALERT: Stay Sharp!
📰 News Events = Volatility.
💡 Avoid fresh entries during high-impact events.
📉 Use Trailing SL to secure your running trades.
💖 SUPPORT THE CREW 💖
🚀 Smash that Boost Button if you believe in the Thief Style Strategy
👑 Let's rob the market together, one level at a time.
🧠 Stay sharp, stay sneaky – and I’ll see you at the next target 🎯
— Thief Trader 🐱👤💰🚁🌍