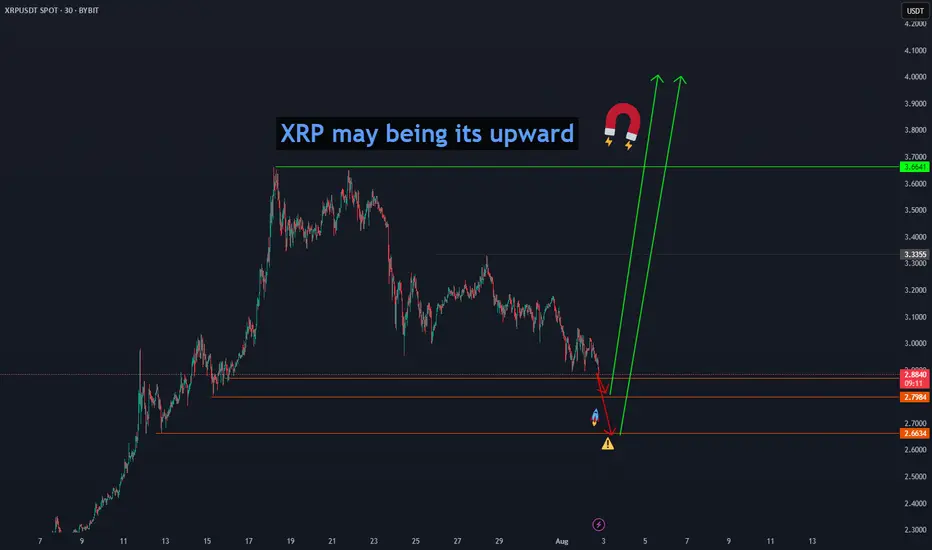
XRP may being its upward" Ripple (XRP) may begin its upward move from the price levels of 2.8865, 2.7984, and 2.6634, aiming for a first confirmed target at 3.6641 and then $4." BINANCE:XRPUSDT
Crypto market
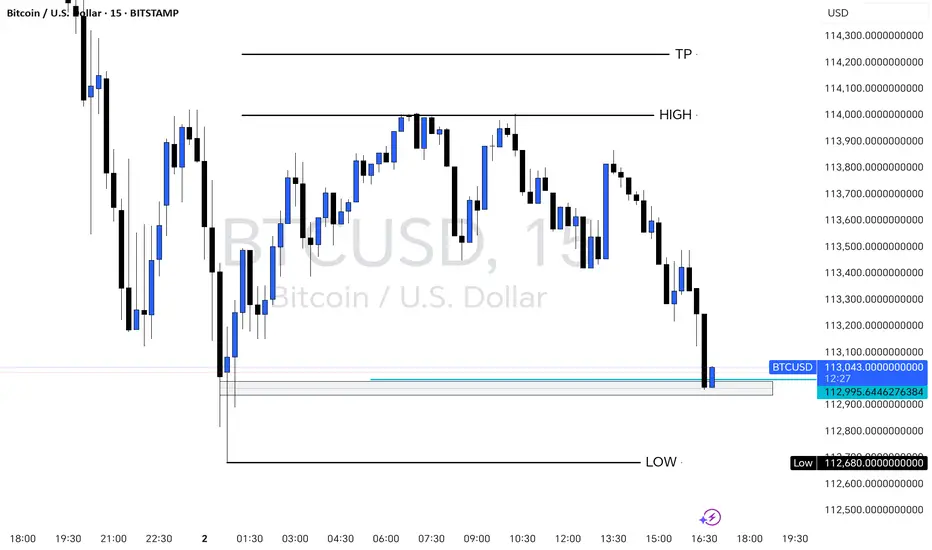
BITCOIN 15-Min Chart – Key Support Retest with Bullish PotentialThis 15-minute BTCUSD chart shows Bitcoin retesting a strong support zone near $112,680 after a clear downward move. The price is currently reacting at a previous demand area, marked in blue, just above the session’s LOW. A possible bullish reversal setup is forming if the support holds, targeting the previous HIGH around $114,000 and a potential TP at $114,200. Traders may look for confirmation signals (e.g., bullish engulfing, order block reaction) before entering long positions.
#MANTA/USDT – Bullish Setup Alert ?#MANTA
The price is moving within a descending channel on the 1-hour frame and is expected to break and continue upward.
We have a trend to stabilize above the 100 moving average once again.
We have a downtrend on the RSI indicator that supports the upward break.
We have a support area at the lower boundary of the channel at 0.190, acting as strong support from which the price can rebound.
We have a major support area in green that pushed the price upward at 0.186.
Entry price: 0.196
First target: 0.205
Second target: 0.214
Third target: 0.225
To manage risk, don't forget stop loss and capital management.
When you reach the first target, save some profits and then change the stop order to an entry order.
For inquiries, please comment.
Thank you.


Bitcoin Long: Completion of wave 4 (5-wave instead of 3-wave)In this video, I updated the wave counts for Bitcoin, primarily the change is in wave 4 where I believed that it has formed in 5-waves instead of 3-waves.
Because of the new low, both our stop loss and take profit are now lowered:
SL: $113,858.
TP: $124,000
Good luck!

#LINK/USDT targeting 17.77 $ ?#LINK
The price is moving within a descending channel on the 1-hour frame and is expected to break and continue upward.
We have a trend to stabilize above the 100 moving average once again.
We have a downtrend on the RSI indicator that supports the upward break.
We have a support area at the lower boundary of the channel at 15.60, acting as strong support from which the price can rebound.
We have a major support area in green that pushed the price higher at 15.30.
Entry price: 15.84
First target: 16.47
Second target: 17.00
Third target: 17.77
To manage risk, don't forget stop loss and capital management.
When you reach the first target, save some profits and then change the stop order to an entry order.
For inquiries, please comment.
Thank you.

The Power of Support, Resistance, and Moving Averages**Analyzing Ocean Protocol (OCEAN/USD): The Power of Support, Resistance, and the 21 EMA**
When trading or investing in the ever-changing world of cryptocurrencies, technical analysis tools offer vital insights into price action and market psychology. Let’s explore how these concepts play out in the recent price chart of Ocean Protocol (OCEAN/USD).
**Dynamic and Static Support/Resistance: A Quick Primer**
Support and resistance are foundational concepts in technical analysis:
- **Support** refers to price zones where a declining market tends to find a “floor,” often pausing or reversing losses.
- **Resistance** marks zones where rising prices tend to stall or reverse, acting as a “ceiling.”
On the OCEAN/USD weekly chart, I marked these static levels at price points where the market has historically reacted, reflecting the areas of repeated reversals or consolidation. Identifying these levels allows traders to anticipate potential moves and manage risk.
**The 21 Exponential Moving Average (EMA): A Dynamic Barrier**
A standout element on our chart is the 21-period EMA, plotted as a gently curving yellow line. Unlike static horizontal lines, the 21 EMA moves with price action, providing a dynamic measure of the prevailing trend. My analysis confirms that:
- In uptrends, the 21 EMA often acts as a support, helping price bounce higher during pullbacks.
- In downtrends, it acts as resistance, causing rallies to stall or reverse.
Repeated interactions between OCEAN’s price and the 21 EMA further validate its role as a crucial area to watch, where buyers and sellers contend for control.
**Descending Resistance and Support: Guiding the Trend**
I’ve also drawn descending (diagonally sloping) trendlines to highlight the broader bearish structure since mid-2024. These lines mark a channel where price has generally been contained, further defining the primary market trend and its boundaries.
**Conclusion: Clarity from Structure**
Through the combination of classic support and resistance lines and the dynamic 21 EMA—which both reliably reflect real market turning points—this analysis brings clarity to OCEAN’s current market structure. These tools not only offer traders a roadmap for likely reactions but also foster a disciplined approach to navigating crypto’s volatility.
*By combining proven tools like horizontal and diagonal support/resistance with the dynamic insight that moving averages provide, traders can approach complex charts like OCEAN/USD with greater confidence and objectivity.*
Please keep an eye for a breakout above the 21 EMA 0.33 price area for possible bullish action. Be cautious of fakeouts and liquidations.
(Some help with the AI Perplexity)

PUMPIMHO once we cross the level above EMA 200 there is launching area to this two zones. Be accurate this thing very active. NFA - DYOR

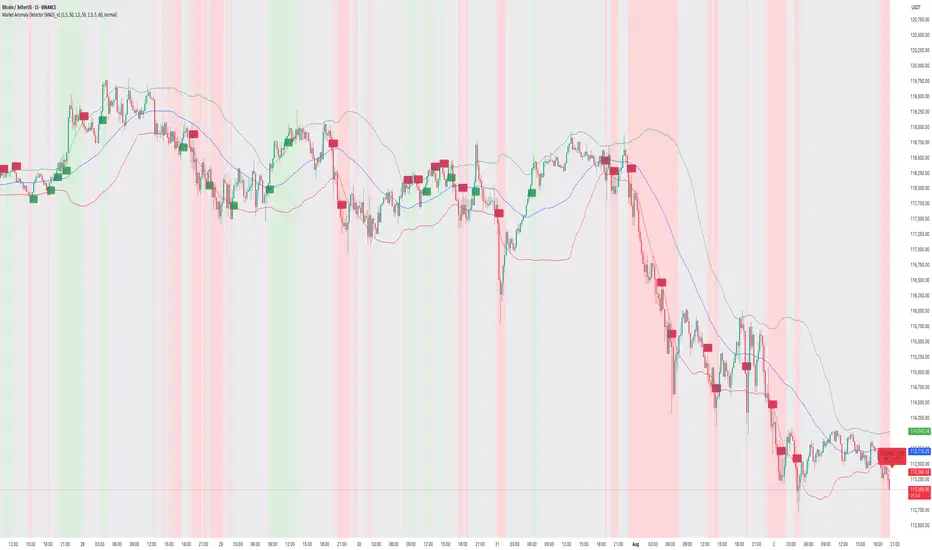
How to Capture Reversals/Breakouts with MAD IndicatorBTC/USDT 15M – Market Anomaly Detector (MAD) Captures Reversals & Breakouts
⸻
Description:
On this BTC/USDT 15-minute chart, the Market Anomaly Detector (MAD) is actively highlighting high-probability market turning points and anomaly zones.
Key Observations from the Chart:
1. Green & Red Zones = Expected Price Range
• Green Line (Upper Band): Expected top of the range.
• Red Line (Lower Band): Expected bottom of the range.
• Price usually travels green → red → green, forming a natural oscillation.
2. Buy/Sell Signals = Breakout + Reversal Detection
• Buy Signal: Triggered when price closes above the green line or recovers from below the red line.
• Sell Signal: Triggered when price closes below the red line or rejects from the green line.
• This reverse psychology logic helps catch false breakouts and stop-loss hunts.
3. Performance on This Chart:
• Signals aligned with key reversals during the sideways-to-downtrend transition.
• The strong downtrend in the second half of the chart shows multiple accurate sell signals, confirming trend continuation.
• Sideways movements had minimal false signals due to cooldown + volume filter.
4. Unique Advantage (USP):
• Statistical approach using Z-Score & Standard Deviation.
• Multi-filter confirmation with RSI, volume, and higher timeframe trend.
• Visually clear anomaly zones:
• Green background = Bullish anomaly
• Red background = Bearish anomaly
• Gray background = Neutral range
Takeaway:
MAD helps traders anticipate anomalies rather than react late, offering high-probability trade entries and reversals in trending and volatile conditions.
Brett short to $0.04751Just now opened up a short position on Brett. Aiming for prior weekly demand area.
Sl: $0.04751
Tp: $0.04751
DTT strategy applied
Roughly 2RR

#BONK/USDT About to Break Out !#BONK
The price is moving within a descending channel on the 1-hour frame and is expected to break and continue upward.
We have a trend to stabilize above the 100 moving average once again.
We have a downtrend on the RSI indicator that supports the upward break.
We have a support area at the lower boundary of the channel at 0.00002440, acting as a strong support from which the price can rebound.
We have a major support area in green that pushed the price upward at 0.00002372.
Entry price: 0.00002552.
First target: 0.00002694.
Second target: 0.00002882.
Third target: 0.00003118.
To manage risk, don't forget stop loss and capital management.
When you reach the first target, save some profits and then change the stop order to an entry order.
For inquiries, please comment.
Thank you.

Bitcoin Structure in Stillness, Power in Silence, Just Control?⊣
⟁ BTC/USD - BINANCE - (CHART: H1) - (Aug 02, 2025).
◇ Analysis Price: $113,869.77.
⊣
⨀ I. Temporal Axis - Strategic Interval - (1H):
▦ EMA9 - ($113,889.32):
∴ The price is trading just below the EMA9, which acts as immediate reactive resistance;
∴ The short-term slope remains negative, with no breakout signal;
∴ Buyers are unable to push the price above this threshold, indicating technical weakness.
✴️ Conclusion: Momentum remains capped; the EMA9 has not been reclaimed.
⊢
▦ EMA21 - ($113,896.52):
∴ The EMA21 stands as a tactical compression line in this range;
∴ The close proximity of EMA9 and EMA21 forms a technical knot - indecision zone;
∴ Past rejections in this region reinforce it as a powerful barrier.
✴️ Conclusion: Mid-range resistance holds; continuation is blocked unless breached with volume.
⊢
▦ EMA50 - ($114,128.22):
∴ EMA50 defines the current macro resistance on the 1H chart;
∴ The price has yet to test this level directly after the last drop;
∴ For structural recovery, this line must be broken cleanly with follow-through.
✴️ Conclusion: Primary obstacle on the path to reversal - decisive zone.
⊢
▦ BB (21 + EMA9) - Status: Compression:
∴ Bands are tightening around the price, signaling low volatility;
∴ Price action is contained within the central channel;
∴ Indicates upcoming volatility spike - direction still unknown.
✴️ Conclusion: Volatility compression is active; no directional bias confirmed.
⊢
▦ Volume + EMA21 - (3.84 BTC):
∴ Trading volume remains below the EMA21 period average;
∴ No surge of bullish commitment visible;
∴ Momentum lacks conviction without participation.
✴️ Conclusion: Absence of volume undermines the strength of any move.
⊢
▦ RSI (21, 9) - (42.37):
∴ RSI hovers in the lower neutral band - weak momentum;
∴ Slight upward curve suggests a modest rebound;
∴ No divergence or strength signal confirmed.
✴️ Conclusion: Minor relief rally underway - structurally weak.
⊢
▦ MACD (9, 21, 9) - (MACD: -238.89 / Signal: -340.58):
∴ Bullish crossover confirmed, histogram positive;
∴ Both lines remain in bearish territory - (below zero);
∴ Trend momentum is building but not strong enough to reverse.
✴️ Conclusion: Technical rebound in play - not a structural shift.
⊢
▦ Stoch RSI (3, 3, 21, 9) - (%K: 58.90 / %D: 52.70):
∴ Positive crossover established and advancing in neutral-upper zone;
∴ No overbought signal;
∴ Possibility of further upside if confirmed with price action.
✴️ Conclusion: Oscillator supports continuation - contingent on volume.
⊢
▦ OBV (21, BB2) - (26.35K):
∴ OBV remains flat, indicating market indecision;
∴ No divergence with price movement;
∴ No fresh buying pressure detected.
✴️ Conclusion: Neutral volume behavior - flow not favoring bulls.
⊢
🜎 Strategic Insight - Technical Oracle:
∴ The 1H chart of (BTC/USD) reveals a battlefield sealed in compression and anticipation.
The price is locked beneath converging exponential resistances (EMA9, EMA21, EMA50), forming a triple entrenchment zone. None have been broken - each rejection reinforces the stronghold;
∴ The Bollinger Bands constrict like a ritual binding. Volatility is silent - too silent - awaiting the spark. Yet no participant steps forward with force; volume remains suppressed, showing that neither side has declared war;
∴ Momentum oscillators (RSI, Stoch RSI) hint at an upward drift, but these are echoes, not proclamations;
∴ The MACD crossover is not a trumpet - it is a murmur in the underworld, below the zero line, concealed from the living trend;
∴ The OBV confirms it: no one is entering the field with conviction. This is not a battlefield - it is a waiting room;
✴️ And yet, amidst this silence, the Code speaks:
∴ If the zone between ($114.1K and $114.6K) is breached with volume and confirmation, this will mark the first true structural challenge to the prevailing descent. If it fails - the repique folds into another trap, devoured by gravity.
⊢
∫ II. On-Chain Intelligence - (Source: CryptoQuant):
▦ Exchange Inflow Total + EMA9 - (All Exchanges) - (6.2K BTC):
∴ The total Bitcoin flowing into centralized exchanges remains subdued, with no signs of aggressive sell-side pressure;
∴ The EMA9 confirms a flat, low-intensity behavior, distinct from capitulation spikes;
∴ The absence of major inflows during price compression implies a strategic wait state.
✴️ Conclusion: No incoming threat detected - institutions are not preparing to sell.
⊢
▦ Exchange Netflow Total + EMA9 - (All Exchanges) - (-644.5 BTC):
∴ Netflow remains negative, indicating Bitcoin is being withdrawn from exchanges rather than deposited;
∴ A negative netflow during a price downtrend reflects silent accumulation behavior or rotation into cold storage;
∴ The EMA9 shows a consistent drainage pattern, not episodic outflow.
✴️ Conclusion: This confirms defensive posture by large holders - supporting the technical compression.
⊢
▦ Spent Output Profit Ratio - (SOPR) + EMA9 - (1.003):
∴ The SOPR hovers just above 1.0, suggesting coins moved on-chain are being sold at or near cost basis;
∴ No signs of aggressive profit-taking or panic selling - rather, equilibrium behavior;
∴ The 9-period EMA confirms stability in this zone.
✴️ Conclusion: Market psychology is suspended - no one is winning or losing.
⊢
🜎 Strategic Insight - On-Chain Oracle:
∴ All on-chain signals reflect preparation without declaration;
∴ No pressure enters, and no blood leaves;
∴ The field is not empty - it is coiled;
∴ Withdrawals - (Netflow) - suggest protective accumulation;
∴ Low Inflow signals no new panic supply;
∴ SOPR near 1.0 says: (We're all waiting - and none are ahead);
∴ The technical compression in price is not betrayed by the chain;
∴ The silence is consistent;
∴ But silence is not peace - it is a veil.
✴️ Conclusion: If volume does not breach $114.6K - all remains a ghost echo beneath resistance.
If broken - the coil unwinds.
⊢
⧉ III. Contextvs Macro-Geopoliticvs - Interflux Economicvs - (Aug 02, 2025):
⟁ All movements of the market's breath are influenced not only by price, nor volume, but by the tides beyond the chart. Here begins the reading of the outer realm:
▦ EVENTVM I - (Wall Street Silent Accumulation) - (U.Today + Coindesk):
∴ Institutional actors are actively acquiring BTC and ETH through stealth operations - not OTC spikes, but ETF inflows and treasury balance shifts;
∴ Tom Lee (Bitmine/Fundstrat) confirms: Wall Street is not waiting for clarity, it is accumulating in silence;
∴ SEC’s Project Crypto and “in-kind” ETF mechanisms further reduce friction for institutional entry.
✴️ Conclusion: Price stagnation conceals power transfer - retail hesitates while funds consolidate control.
⊢
▦ EVENTVM II - (SEC’s “Project Crypto” Activation):
∴ Regulatory framing under “Project Crypto” unfolds in phases: transparency, compliance infrastructure, and institutional bridges;
∴ Despite its regulatory mask, the program facilitates liquidity channels into crypto markets;
∴ Legalized ETF's now serve as strategic vacuum points for Bitcoin supply.
✴️ Conclusion: What appears as regulation is in fact an alignment mechanism - structure over rebellion.
⊢
▦ EVENTVM III - (July ETF Flows (US) - $12.8B Inflow):
∴ U.S.-based crypto ETF's report record-breaking $12.8 billion inflows in July alone;
∴ Largest flows tracked in BlackRock, Fidelity, and VanEck vehicles - no signs of reversal;
∴ These flows occurred during price weakness, not during breakout - a signature of accumulation.
✴️ Conclusion: The public hesitates while custodians act - the veil of weakness conceals a new floor.
⊢
🜎 Strategic Interpretation - Macro Context:
∴ The charts compress. The flows retract;
∴ But the outer forces converge - Wall Street is no longer watching. It is acquiring;
∴ Through structure, silence, regulation, and engineering of access;
∴ This is no longer the market of peer-to-peer rebellion;
∴ This is the codification of power into institutional hands;
✴️ Conclusion: Price may appear static - but ownership is shifting.
⊢
𓂀 Stoic-Structural Interpretation:
∴ The chart does not lie. The data does not beg. The market does not care. Bitcoin remains trapped beneath resistance - not by force, but by inaction, by lack of intention, by silent contest;
∴ On-chain signals whisper: no one is selling in panic, no one is buying in euphoria;
∴ The macro realm reveals: the hands of power are moving beneath regulation, using silence as shield;
∴ Thus we see a paradox - the technical shell compresses, the on-chain bloodstream circulates without fever, the macro structure redefines.
⚖️ The Stoic mind recognizes this not as chaos, but as necessary stillness.
∴ The Arcane practitioner does not chase a move - he maps the pressure points and waits;
∴ He acts only when the veil thins;
∴ To act prematurely is to violate the structure;
∴ To wait blindly is to betray the will;
∴ The Stoic Arcane path demands this: know the boundary, seal the insight, then act - once - with clarity;
∴ At ($114.6K) the veil may part. If it does not - the silence continues.
⊢
✦ Structure Bearish.
▦ This is a bearish containment, not a breakdown.
∴ The market is not collapsing - it is being held below by absence of volume, of intention, of structural reversal;
∴ The EMA's are stacked above like iron gates;
∴ The price has failed to break $114.6K - the veil remains intact;
∴ On-chain data confirms neutrality, not optimism;
∴ Macro signals suggest accumulation by institutions - but not defense for the public.
⊢
🜎 Therefore:
∴ Technically Bearish - (structure not yet reversed);
∴ Tactically Neutral to Bearish - (fragile repique);
∴ Strategically in Transition Phase - (institutions buying beneath silence).
✴️ Conclusion: Until ($114.6K) is broken with conviction, the structure remains bearishly biased - wrapped in stillness.
⊢
⧉
· Cryptorvm Dominvs · MAGISTER ARCANVM · Vox Primordialis ·
⚜️ ⌬ - Silence precedes the next force. Structure is sacred - ⌬ ⚜️
⧉
⊢

#PEPE/USDT or Breakdown? PEPE Eyes 0.00001166 Target !#PEPE
The price is moving within a descending channel on the 1-hour frame and is expected to break and continue upward.
We have a trend to stabilize above the 100 moving average once again.
We have a downtrend on the RSI indicator that supports the upward break.
We have a support area at the lower boundary of the channel at 0.00000980, acting as a strong support from which the price can rebound.
We have a major support area in green that pushed the price upward at 0.00000990.
Entry price: 0.00001030.
First target: 0.00001075.
Second target: 0.00001120.
Third target: 0.00001166.
To manage risk, don't forget stop loss and capital management.
When you reach the first target, save some profits and then change the stop order to an entry order.
For inquiries, please comment.
Thank you.

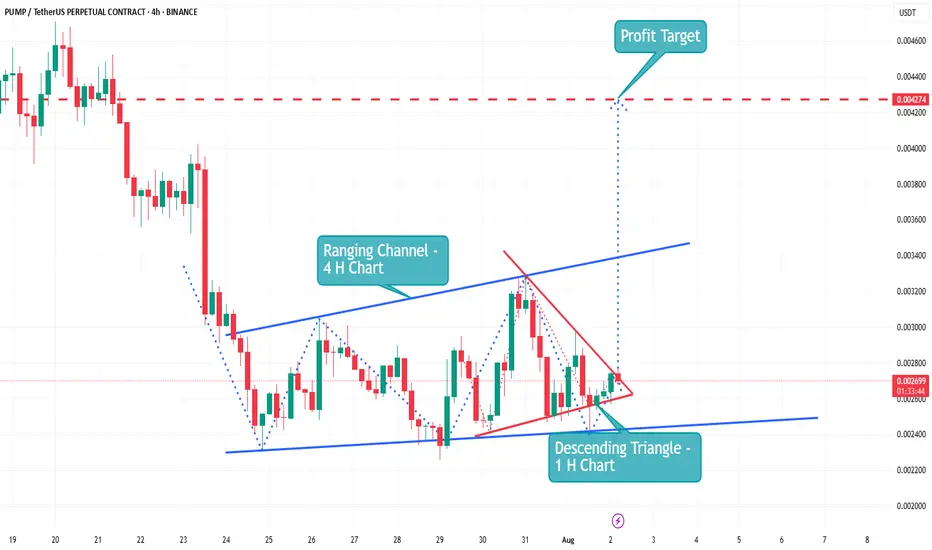
The Pump coin is now showing an upward trend | Live AnalysisPump ▶️
The Pump coin has now touched its All Time Low.🕯
The coin is now showing an upward trend.👀
🛫 a Descending Triangle is currently forming a breakout on the 1H chart.
🛫 Making a Ranging Channel on the 4 H Char
🛫 Make A CHoCH (1H)
🛫 Bullish OB (1H)
🛫 Buy Tag (1 H)
🛫 Making Golden Cross (1 H
XRPUSDT 4H – Pullback Into Support, But Will This Bounce Stick?XRP has retraced nearly 25% off its local highs after a powerful +90% move in July. Price is now pulling back into a well-defined demand zone around 2.85–2.88, which previously triggered the breakout impulse.
📌 What’s notable:
Clean retest of demand + price hovering above the final bullish structure
EMAs are overhead, but not yet fully bearish — a reclaim could flip short-term bias
The lower demand zone (~2.15–2.25) still stands as a last line of defense from the original rally base
This bounce attempt is key — a strong push from here could send price back toward the $3.30–3.50 region. But if bulls fail to hold, there’s room for a deeper retracement.
Trade Planning Notes:
Aggressive Long: Entry on wick into support with tight invalidation
Conservative Long: Wait for EMA reclaim confirmation
Bearish Case: Breakdown = target $2.25 zone
The path from here decides whether this is a healthy pullback — or the start of a reversal. What’s your play? 👇

Ethusd $2500 I suspect may be the last dipTechnical analysis on ethusd .
Whilst everyone is bullish from current level, my technicals is telling me $2500 region which is key for upward movement or a break makes it want to go lowet
