Crypto market

BTC accumulates, slightly adjusts down💎 BTC PLAN UPDATE – START OF THE WEEK (04/08)
🔍 1. Current Technical Structure
Price Pattern: The chart shows BTC is forming a falling wedge pattern, with converging support and resistance lines.
False Break: There was a false break below the strong support zone around ~112,000, followed by a sharp rebound. This indicates buyers are actively defending this level, showing potential buying pressure.
Fibonacci Retracement: From the recent low to high, the 0.5 (115,559) and 0.618 (116,361) Fibonacci levels are acting as key resistance zones.
Key Price Levels:
• Strong support: 111,800 – 112,300
• Near resistance: 115,500 – 116,500
• Next resistance: downtrend line and previous high around 118,000 – 119,000
🔄 2. Possible Trend Scenarios
✅ Main scenario (bullish):
BTC made a false break below the wedge → rebounded toward Fibonacci resistance → potential:
• Continue rising to the 115,500 – 116,500 zone
• If it breaks and holds above this zone, BTC could break out of the wedge pattern and target 118,000 – 120,000
• A longer-term target could be the 1.618 Fibonacci Extension around ~123,159
❌ Alternative scenario (bearish):
If BTC fails to break above 116,000 and gets rejected:
• It may retest the 112,000 support zone again
• A breakdown below this support would bring back the downtrend
🔄 3. Bullish Supporting Factors:
• The false break signals a shakeout of weak sellers.
• A potential inverse head-and-shoulders pattern is forming, supporting a bullish reversal.
• Moving Averages (MA): Price is nearing the 200 MA (red) – a possible bullish crossover with shorter-term MAs may occur, signaling a buy.
🧭 Suggested Trading Strategy
• Safe buy zone: Around 113,500 – 114,000 if there’s a pullback.
• Take profit in stages: 116,500 – 118,000 – 120,000
• Stop-loss: Below 112,000 in case of a confirmed breakdown

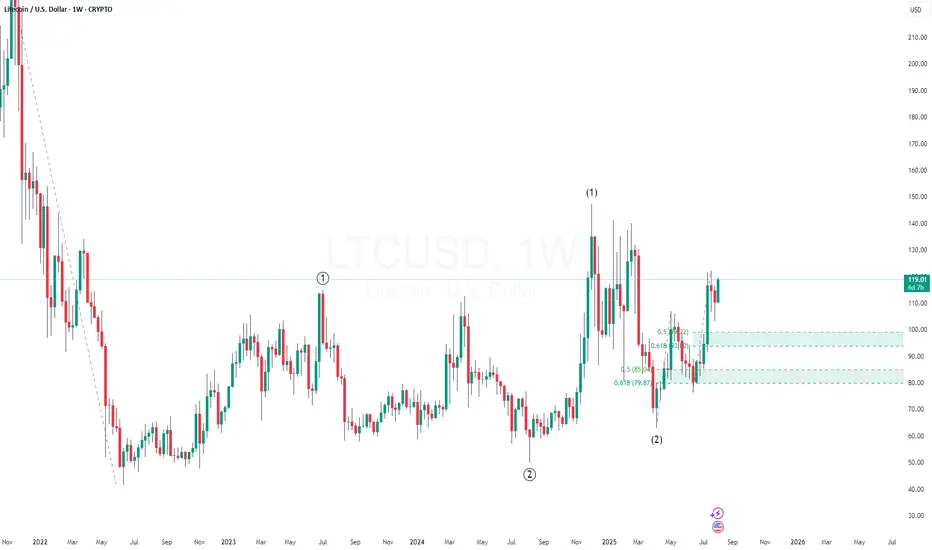
LTC Could Be Gearing Up for a Massive Wave 3 post 1-2, 1-2 Litecoin (LTC) appears to have completed a 1-2, 1-2 wave pattern, a classic bullish setup in Elliott Wave theory that often precedes an explosive move.
This nested formation signals strong internal momentum, where both the higher and lower degree structures are aligned for upside. If the count holds, LTC is now positioned to launch into Wave 3 of the larger Wave 3 — typically the most powerful and extended rally in the entire wave cycle.
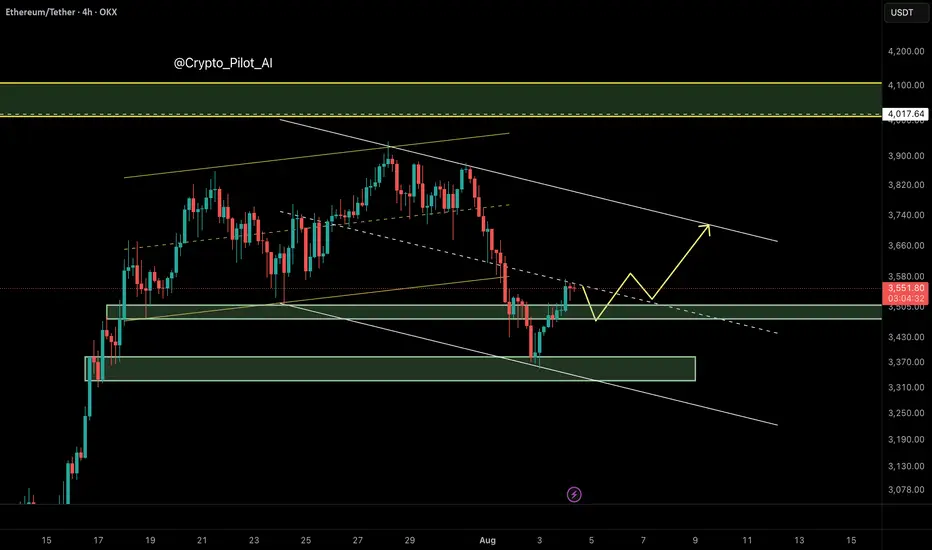
ETH Looks Bearish (3D)Ethereum approached the weekly trendline and experienced a correction. It seems likely that we may see one more push upward to create a false bullish sentiment on this coin. There is even a possibility of a fake breakout above the descending trendline. However, before any major move, a significant correction toward the green zone appears likely | after which the main bullish move is expected to occur.
On higher timeframes, this is currently our outlook on Ethereum.
A daily candle closing above or below the invalidation levels would negate the current buy or sell bias.
For risk management, please don't forget stop loss and capital management
Comment if you have any questions
Thank You

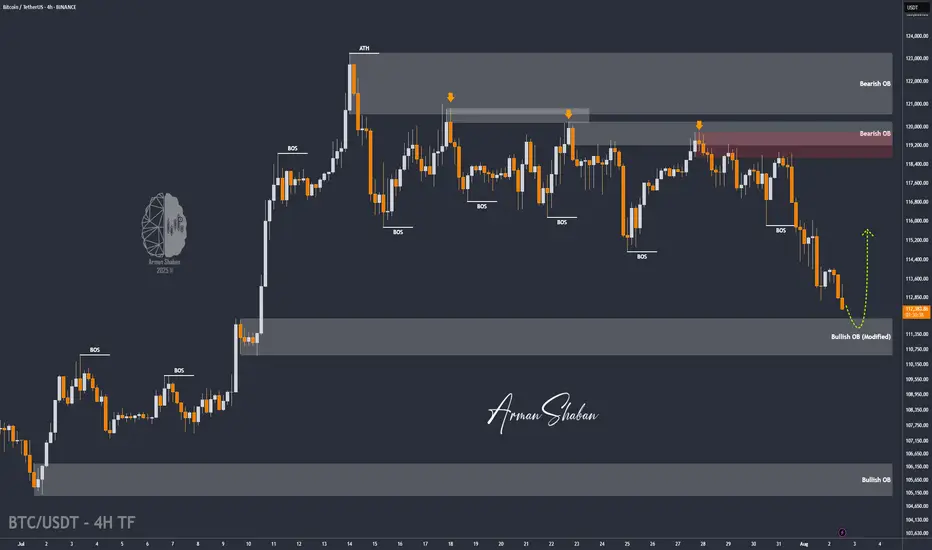
BTC/USDT | Bitcoin Eyes Rebound from $110K Support Zone! (READ)By analyzing the Bitcoin chart on the 4-hour timeframe, we can see that after reaching a new high at $123,218, the price began to pull back and has now corrected down to around $112,500. I expect the current volatility to ease soon. The next critical support zone lies between $110,500–$112,000 — watch price action closely here, as BTC could bounce from this area and push back toward $116,000+. Other key demand zones are located at $109,000, $107,900, and the $105,000–$106,000 range.
Please support me with your likes and comments to motivate me to share more analysis with you and share your opinion about the possible trend of this chart with me !
Best Regards , Arman Shaban
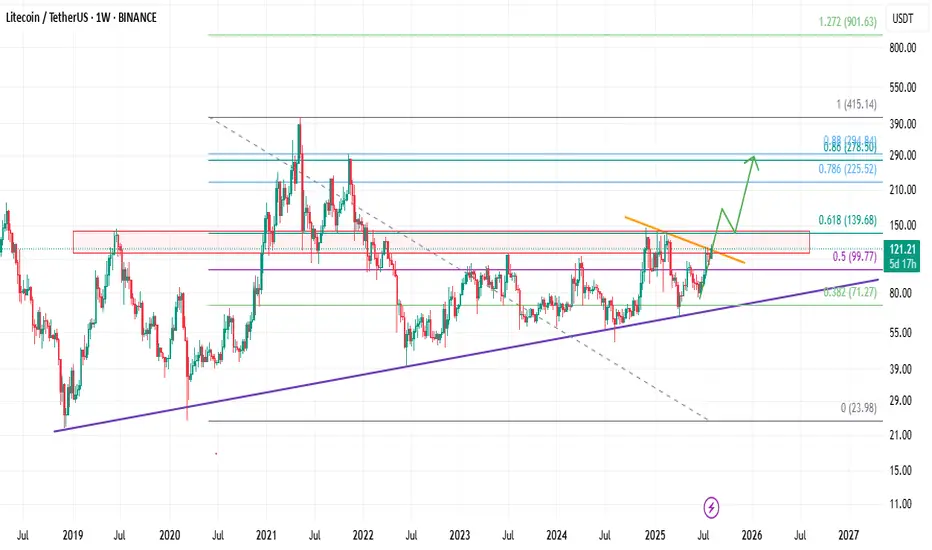
Is Litecoin a free ride to $400?Taking a look at what I believe may be the most undervalued asset in the market as it has broken out of a trend line and is headed towards another test of a monthly level. This level has proven multiple times to be very rewarding. I think this may end up being one of the easiest trades in the market right now.

Litecoin Looks Ready – Breakout or Fakeout!Hello Traders 🐺
As you can see on the weekly chart, price is trying to break above the resistance line, which is in alignment with the red weekly resistance box and the 0.618 Fibonacci level.
Long story short:
If price manages to push above the 0.618 level — which is a very important resistance — we could expect a higher price target around the all-time high level at the 0.786 Fib zone.
And as always my friend, remember:
Discipline is rarely enjoyable, but almost always profitable.
Ethereum (ETH/USDT) – Bearish Channel Structure Developing
⸻
🔍 Technical Overview
Ethereum has broken down from its ascending channel, invalidating the earlier bullish projection toward $4,000. After failing to hold the channel midline around $3,577, price dropped sharply to $3,360, forming a new bearish descending channel.
Currently, ETH is trading near the midline of this bearish channel, which typically acts as a decision point — not a buying zone — in smart money models.
⸻
🧠 NEoWave Interpretation
We may be inside a Complex Corrective Wave, possibly a Running or Contracting Flat evolving after the March top. The current structure resembles a B-wave trap, where price fakes out the upside before shifting momentum sharply downward. The break below the ascending channel midline confirms this bearish shift.
⸻
📊 Smart Money Summary
• 🟥 BOS confirmed on 1H and 4H (lower highs and lower lows)
• 🔻 Midline failure acted as a smart money trap, followed by a liquidity sweep below $3,490
• 📦 Bullish Order Block around $3,490–$3,520 has been tapped, prompting a minor reaction
• 🟡 Current resistance sits near the channel top ~ $3,715
⸻
🎯 Trade Scenarios
📌 Bearish Continuation:
If price fails to reclaim above $3,715, a retest and rejection from the channel top could trigger continuation toward $3,300–$3,250.
📌 Bullish Reversal (less likely for now):
Only a clean break and hold above $3,720 would suggest that bulls are regaining control, opening path toward $3,900–$4,000 — though this scenario is weakened after structural damage.
⸻
⚠️ Trader Tip:
Avoid buying into midline reactions in weak channels. Better long setups form after stop-hunts, ideally near bullish OBs + internal BOS confirmations.
⸻
✅ Conclusion
Ethereum remains under bearish pressure after losing its ascending structure. Unless price reclaims the $3,715 resistance zone with momentum, downside continuation remains likely.
⸻
📌 Save this analysis
💬 Share your thoughts or alt wave counts in the comments.
XRP Settlement August 15th, 2025 $33.00 & $1,031 May 23, 2026XRP is positioned for a major move on August 15th, 2025
when XRP reaches $30.00 - $33.00, it has two algorithmic delivery paths:
Path 1 (blue): Targeting $300 by August 23, 2026.
Path 2 (red): Parabolic extension to $1,031 by May 23, 2026.
“By the time you hear about it, it’s already too late.”
"News is the excuse for the moves."

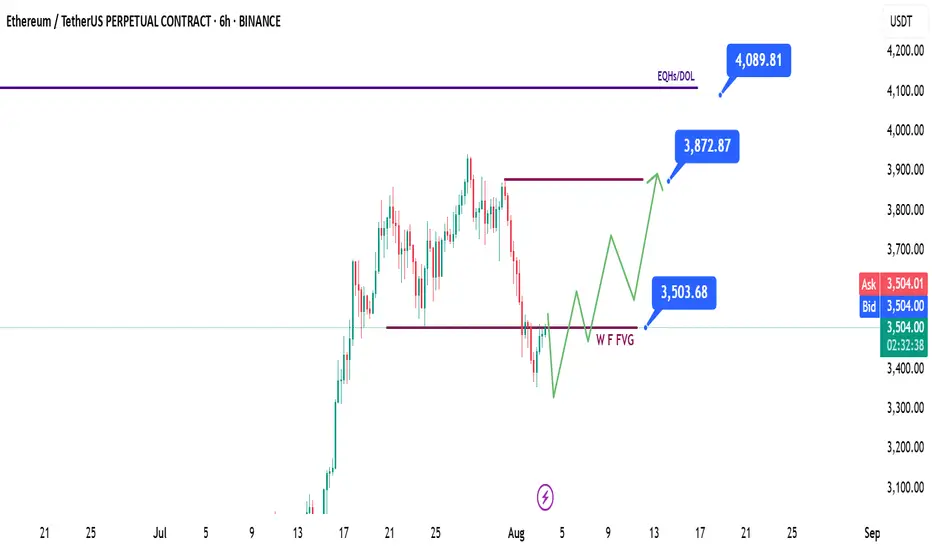
ETH | Ethereum - Weekly Recap & Gameplan - 03/08/25📈 Market Context:
Traders are currently anticipating a potential 0.25% rate cut at the September FOMC meeting, which continues to support the broader bullish outlook.
While the market pulled back following weaker-than-expected Non-Farm Payroll data, overall sentiment remains optimistic.
Greed has cooled off into a more neutral stance. Historically, August often brings some consolidation or pullbacks — but the structural bias for crypto market remains bullish.
🧾 Weekly Recap:
ETH started the retracement movement after building a bullish trend over the past couple of weeks.
It’s mainly being affected by Bitcoin's bearishness, so we’re closely following BTC’s price action.
ETH has tapped into the Weekly Fair Value Gap, which is a key level for me.
We may see a bounce from here.
📌 Technical Outlook & Game Plan:
I expect to see another low on ETH before we go up — as I’m also anticipating one more leg down on Bitcoin.
So I’ll wait for a final bearish expansion and a trap for late sellers before positioning for longs.
After that, I want to see price closing above the purple line at $3500.
🎯 Setup Trigger:
A candle close above the $3500 level will be my signal to look for long setups.
📋 Trade Management:
Stoploss: Below the swing low that breaks above $3500
Take Profit: Targeting $3870, but will trail and lock in aggressively in case of deeper downside expansion.
💬 Like, follow, and comment if this breakdown supports your trading! More setups and market insights coming soon — stay connected!
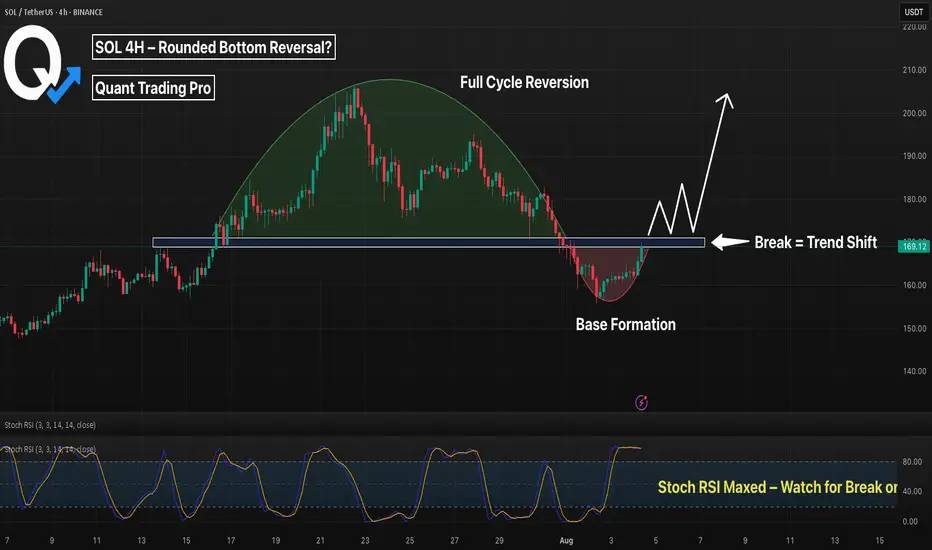
SOL 4H – Rounded Bottom Forming, But Will It Break the Neckline?Solana may be completing a rounded bottom formation on the 4H chart — a classic reversal pattern that often signals a shift from distribution to accumulation. After a deep pullback from July highs, SOL has carved out a smooth base with clear curvature, now pressing into the neckline resistance around $169–$171.
The structure resembles a full cycle: a rounded top leading into a rounded bottom — a potential "cup" formation. With Stochastic RSI pushing into overbought territory, we’re approaching a key decision point.
🔍 Key Factors:
– Rounded bottom structure shows controlled re-accumulation
– Neckline acting as current resistance (watch for breakout)
– Break + retest could trigger the next leg toward $185–$190
– Failure to break may lead to chop or retrace toward $158–$160
This pattern often precedes explosive continuation if volume confirms the breakout.
Will SOL confirm the reversal — or is this just another trap?
👇 Comment your thoughts below.

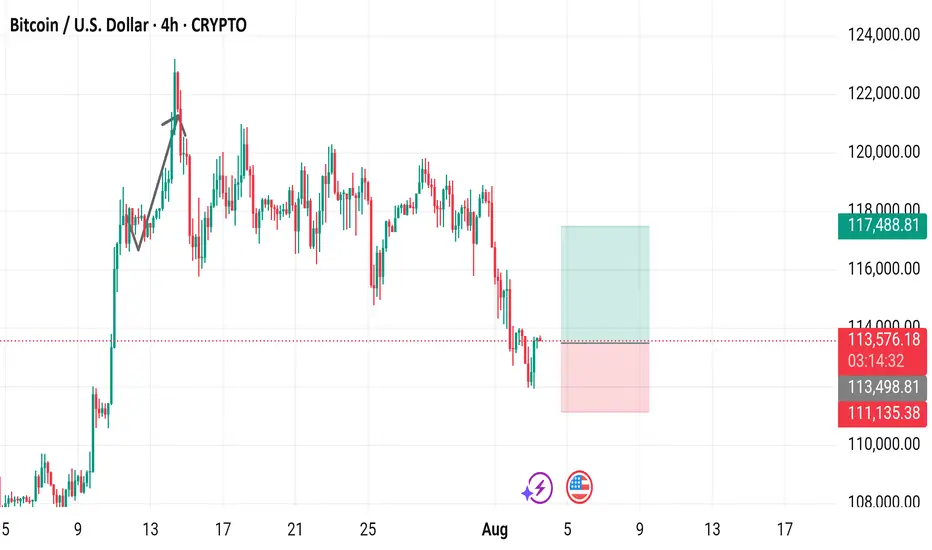
Bitcoin / U.S. Dollar 4-Hour Chart (BTCUSD)4-hour chart displays the price movement of Bitcoin (BTC) against the U.S. Dollar (USD) from late July to August 3, 2025. The current price is $113,570.31, with a 24-hour change of +$1,064.77 (+0.95%). The chart shows a recent upward trend followed by a sharp decline, with key levels marked at $113,570.31 (buy/sell price) and $111,135.38 (support level). The trading volume and price range are highlighted, with a notable drop below the $113,570.31 level as of 03:16:00 on the chart.
SEI 8H – Same Fib Zone, Same Bounce… Same Outcome?SEI just tapped the exact same golden pocket zone that launched its last major breakout — and it’s already showing signs of a repeat performance. The 8H chart displays a nearly perfect mirror setup, with price double-tapping the 0.5–0.618 retracement zone and bouncing with momentum.
With Stoch RSI flipped up and price reclaiming the midpoint, this sets up a high-probability, high-RR trade targeting the upper range near $0.39.
📍 0.5 (0.2725): Midpoint reclaim underway
📍 0.618 (0.2447): Golden Pocket → exact reaction level
📍 0.786 (0.2051): Clear invalidation
📍 Target Zone (~$0.39): Range high from July rally
The structure is almost identical to early July — and if history repeats, we could be seeing another 30–40% leg higher.
This is how traders weaponize memory and structure.
👇 Are you taking this bounce or waiting for confirmation?

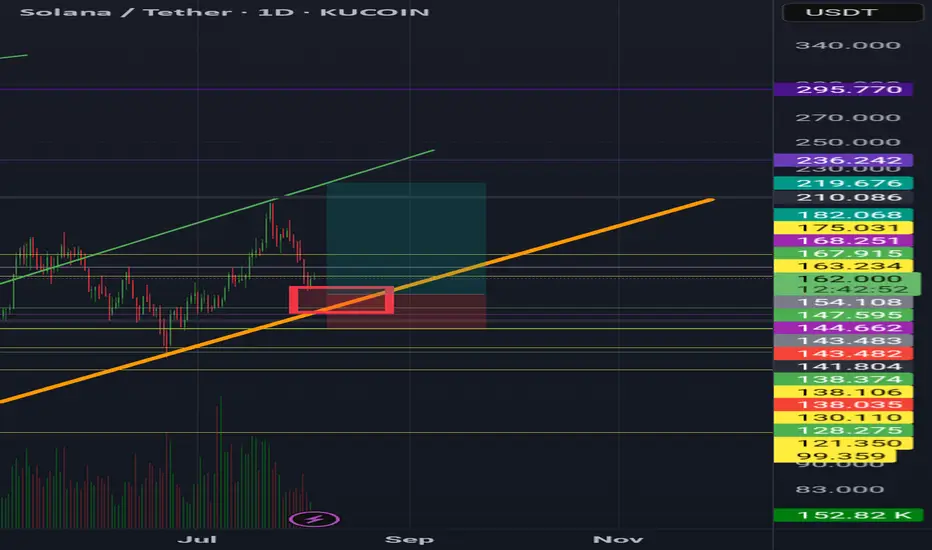
SolanaZol usdt daily analysis
Time frame daily
Position long
Target 219$
Risk rewards ratio >4 👌👈
Red box on the cart is the good erea to entrance long position
Orange uptrend line is a very strong support lines
I guess in this turn of upcoming, solana will reach my target
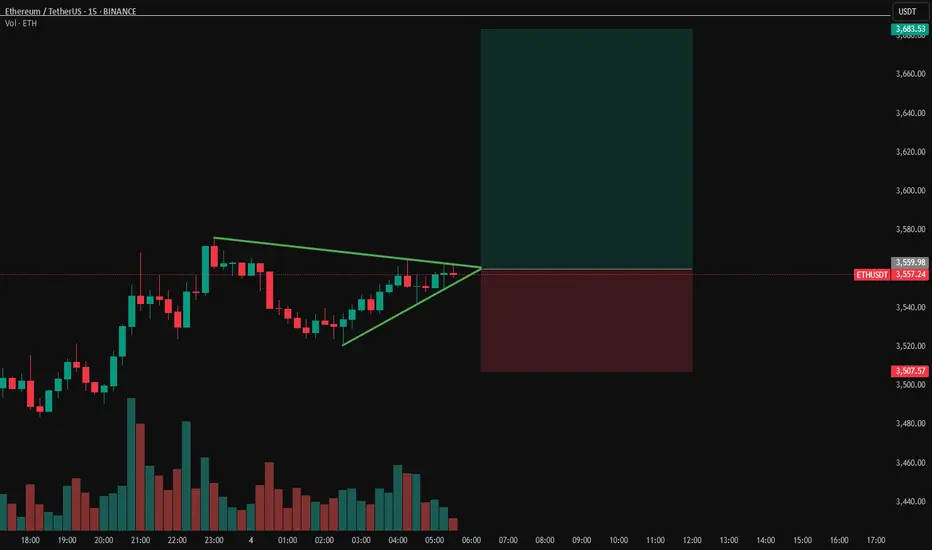
ETHUSDT Breakout ImminentETH sitting on $3500 support after reclaim
Price action is tight and indecisive.. lots of dojis and back-and-forth engulfing candles. Buyers and sellers clearly fighting it out.
We’re coiled in a symmetrical triangle, right on a key level that used to be strong support. It got broken but now reclaimed, im leaning bullish.
S&P and Nasdaq opened strong. If we break out of this triangle to the upside with volume, we could see a quick move toward $3650-3700.
ETH-----Sell around 3670, target 3600 areaAugust 5th ETH Contract Technical Analysis:
Today, the daily chart closed with a small bullish candlestick pattern, with consecutive bullish candlesticks and prices consolidating at high levels. The accompanying indicator formed a death cross. The price did not break through the previous high on the pullback, so the overall downtrend is still favorable. However, it should be noted that yesterday's pullback interrupted the ongoing downward trend, so this is important to note. The hourly chart showed continued gains during the European and American sessions, while prices came under downward pressure during the Asian morning session. The current candlestick pattern is a series of bearish candlesticks, with the accompanying indicator forming a downward death cross. This suggests a continued upward trend within the next few days, but the strength and impact of the European session remain important to monitor.
Today's ETH Short-Term Contract Trading Strategy:
Sell on pullbacks to the 3670 area, with a stop loss at 3700 and a target at 3600.

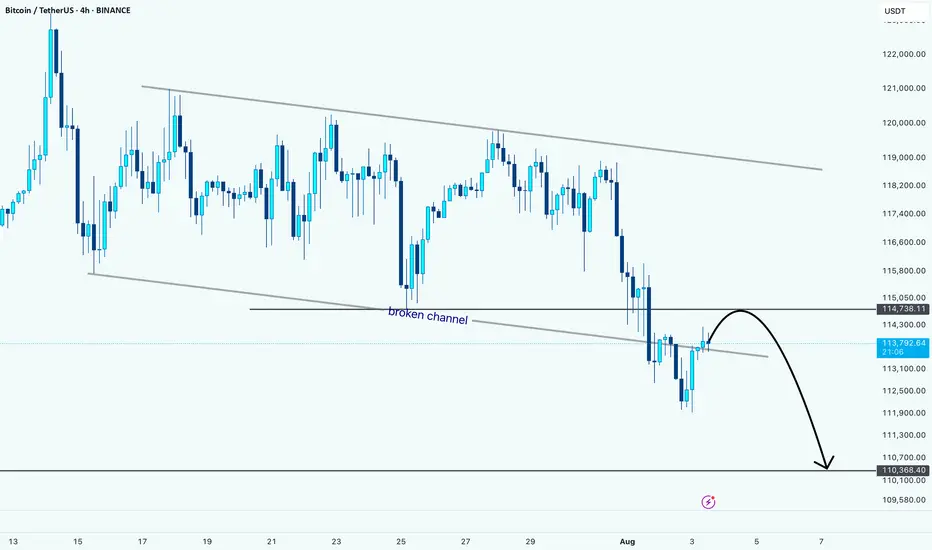
BTC Breaks Down: Retest Could Lead to More LossesHello guys!
Bitcoin has officially broken below the descending channel it was stuck in for weeks. Right now, price is pulling back to retest the broken channel, which is now acting as resistance around the 114,700 zone.
What I'm watching:
Broken channel = bearish signal
Retest zone around 114,700
Downside target near 110,400
So far, it looks like a clean setup for further downside, unless bulls manage to reclaim that broken trendline. Until then, the pressure remains to the downside.
Let’s see how price reacts here... Rejection = short opportunity.
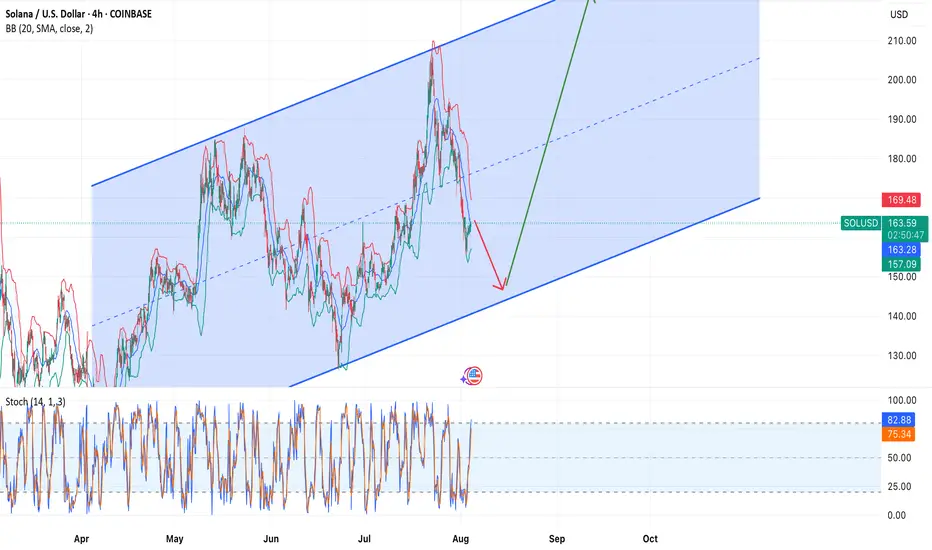
Solana — Buy Now or Wait for a Pullback to Channel Support?Overview:
The COINBASE:SOLUSD price is moving within a steady ascending channel. Currently, the asset is near the midline, and the trader faces a choice:
📌 Enter a long position now or
📌 Wait for a pullback to the lower channel boundary (~150–153) for a more optimal entry point.
Technical Setup:
• 🔵 Ascending channel has held since April.
• 🔴 Price is near the lower Bollinger Band.
• 🧭 Stochastic oscillator is in the overbought zone, but may indicate a reversal impulse.
Scenario 1 — Long from current levels:
• Entry: 163–164
• Stop: below 157
• Target: 180 / 200+
Scenario 2 — Wait for pullback:
• Entry: 150–152 (near channel support)
• Stop: <147
• Target: 170 / 190+
📌 The decision depends on your patience and strategy:
— Don’t want to miss the move? Consider partial entry now.
— Prefer a better risk/reward ratio? Wait for the dip.
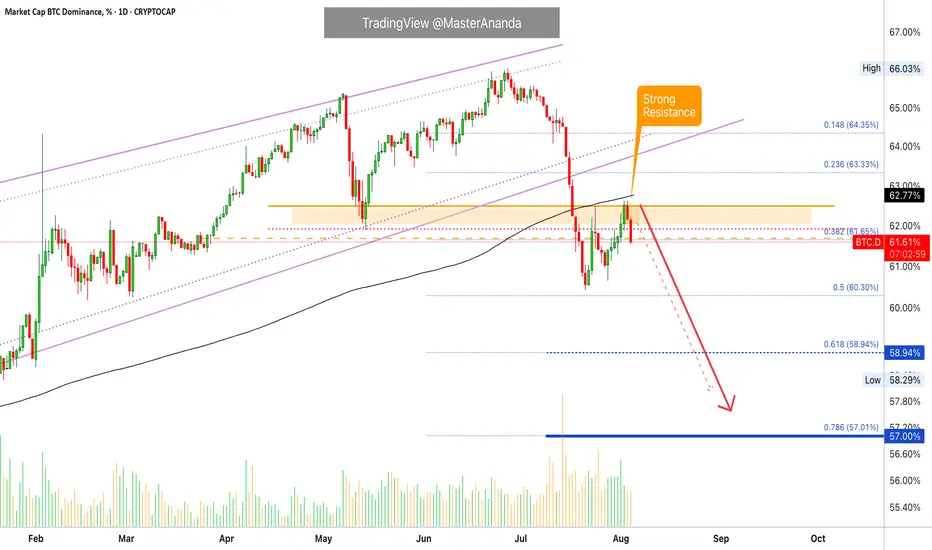
Bitcoin Dominance Update · Daily TimeframeThe rejection is happening right at "strong resistance." Notice that this is the same drawing from my previous update so it was drawn before the fact. Since resistance has been confirmed and the action is happening just as we expected, we can continue to follow our map as it is working.
The next logical move is a drop on Bitcoin Dominance Index (BTC.D), which translates into the resumption of the bullish wave for the altcoins, specially Ethereum and the big projects. It can also signal that Bitcoin will stop dropping and will either consolidate or move higher. This index reveals more than anything else the expected directions of the altcoins.
The retrace is over
The altcoins produced a retrace mainly between 21-July and the 2nd of August. In this period we saw many of the altcoins we are buying and holding move lower but only to produce a strong higher low. This higher low now will resolve into a very strong bullish wave, a bullish resumption.
Moving averages
Here MA200 daily has also been confirmed as resistance and trading below this indicator with a bearish bias, coming from a high point, gives out a very strong bearish signal. It means that long-term bearish action is now in place, the direction/trend. If the action was happening below MA200 but coming from a low point, this signal can have bullish connotations, right now it is bearish.
Bearish Bitcoin Dominance = Bullish Altcoins
The altcoins market will continue to grow, this is only the start. We are set to see growth long-term including now, next week, next month and until late 2025; maybe even for some portion of 2026, maybe even beyond.
Thank you for reading.
Namaste.
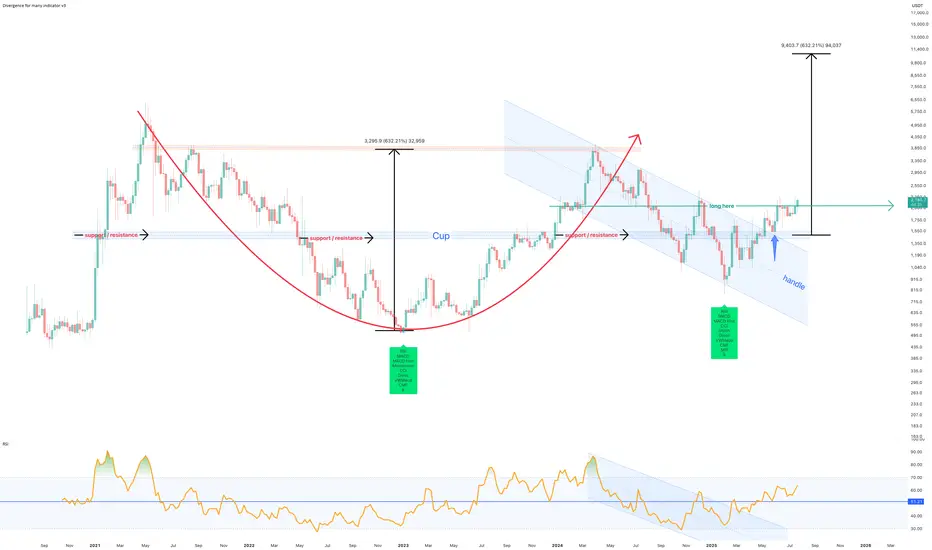
July 2025 - Marker DAO (MKR) to $10k before EthereumThe above forecast is predicted to strike before October 2025. Ethereum will never reach $10k in its lifetime, which a study for another post.
A 75% correction is shown on the above 6 day chart that began in March 2024. A number of compelling reasons now exist for a strong upward move.
Support and resistance
Look left, price action confirms support on past resistance, which follows a strong positive divergence. The resistance has held since May 2022. Incidentally on the topic of divergences, on the same time frame with the same settings, Ethereum prints a double negative divergence over the same period. (see below).
The trend
Both Price action and RSI resistances have broken out. RSI confirms a trend reversal on past resistance.
A Cup and Handle pattern confirmation
The forecast is derived from the Cup and Handle pattern topping out at around $10.5k, however it is not suggested to wait until this area before profits are taken.
Is it possible price action continues to print lower lows? Sure.
Is it probable? No.
Ww
Ethereum 6 day double negative divergencies
XRP Update · Support Confirmed · Not $4, Now $6 & HigherIt is true our next target is $4.5 but this isn't the final target anymore. Based on what I am seeing coming from the chart and what is happening marketwide, we have to continue to expand while aiming higher, each time, adapting to market conditions.
The next target for our XRPUSDT track and trade is now at $6.27, let's read the chart.
First, do what you need to secure profits, your trade, your position; and do your own thing. I you alert of the opportunity, great entry price and timing but it is up to you to plan, take profits and adapt your trading to your own individual conditions. All is good and we are doing great. Notice how the market continues to perform awesome just as expected and notice how we indeed are getting more; and more. This is not the start, XRP is already pretty advanced in its bullish cycle but this isn't the end either. There is plenty of room left available for much more growth.
Yesterday support was found exactly above 0.618 at $2.71. These levels were there before the retrace so we know based on what Fib. proportions XRP is moving. We know exactly where to find resistance and support.
As soon as support was activated the same day we got a full green candle and the break of another resistance. Today full green again. Normally, people would still say that it is early and wait for confirmation; not me, I told you the retrace would be fast and end within days. Seeing the action as it is today, we can confirm the resumption of the bullish move. This means higher prices and higher prices in the chart can translate into weeks of bullish action. Week after week after week. Some retraces and corrections will invariably show up, always small followed by additional growth.
This is the 2025 bull market. Still early, the best is yet to come.
Bullish momentum will grow and a massive force will take over the market. This force is likely to be with us for months and at this point everything will grow. This same energy will remain with us for years and we have to make the most of this cycle.
Be ready, be prepared, maximize profits and continue to buy, to hold and to trade long-term. The more we practice the more we learn.
The more we learn more money we can make. With more money, we can meditate more and with more meditation we can improve our results. The conclusion is abundance and with financial abundance we can materialize the type of life we want. It can be anything, but you will be rewarded based on your insistence, persistence and hard work.
Patience is key.
Thanks a lot for your continued support.
Namaste.

DYDX Approaching Make-or-Break Pivot for Major ReversalThe DYDX/USDT weekly chart outlines a complex corrective WXY structure with price currently approaching the Immediate Drop Target Zone (IDTZ) near $0.50. A failure here could lead to a drop toward the Extreme Demand Zone around $0.079. However, reclaiming $1.132 and breaking above the descending trendline could trigger a bullish reversal toward the Important Supply Zone ($4.42–$4.55).
