Ripening SellXrp had formed an M formation above, has retest current happen with a huge bullish candle upwards but, if you look to your immediate left-hand side you will see that the level 2.9635 is a point of reversal both with your immediate left-hand and further left.
Time will only tell with the way the candle will close. And if the setup is not invalidated, we project price movi g all the way to 2.2348
Crypto market

The key is whether it can rise above 115854.56
Hello, traders!
Follow us to get the latest information quickly.
Have a great day.
-------------------------------------
(BTCUSDT 1W chart)
The key is whether it can rise above the newly created DOM (60) indicator point of 119086.64.
If this fails and the price declines, we need to check for support near the previous all-time high (ATH) of 108,353.0.
Since the M-Signal indicator on the 1W chart is rising near 108,353.0, this area is expected to serve as important support and resistance.
-
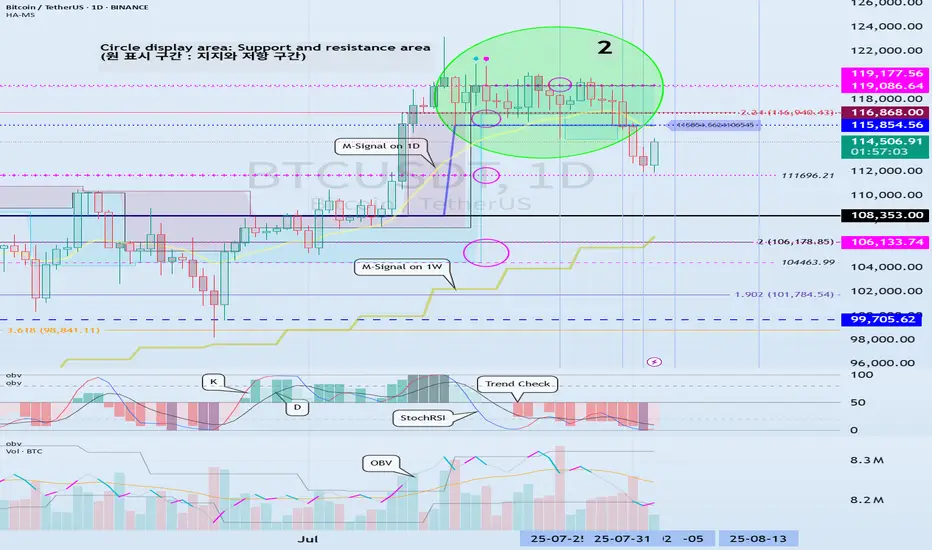
(1D chart)
This period of volatility is expected to continue until August 6th.
Therefore, the key question is whether the price can rise above 115,854.56 and maintain its upward momentum.
If not, further declines are likely.
-
To rise above 115,856.56,
- The StochRSI indicator must rise within the oversold zone and remain above K > D.
- The On-Bottom Volume indicator must continue its upward trend with OBV > OBVEMA. - The TC (Trend Check) indicator should maintain an upward trend. (If possible, it's best to rise above the 0 point.)
If the above conditions are met and the price rises above 115854.56, it is expected to attempt to rise above 119177.56.
This period of volatility is a significant period of volatility.
Therefore, if the price falls below the HA-High ~ DOM(60) range and encounters resistance during this period, you should prepare for further declines.
-
The basic trading strategy is to buy in the DOM(-60) ~ HA-Low range and sell in the HA-High ~ DOM(60) range.
However, if the price rises in the HA-High ~ DOM(60) range, a stepwise upward trend is likely, while a decline in the DOM(-60) ~ HA-Low range is likely to result in a stepwise downward trend.
Therefore, a split trading strategy is recommended as the basic trading strategy.
When executing a trade, appropriate profit taking secures the liquidity of your investment, giving you the opportunity to seize new opportunities.
To achieve this, you should consider your intended investment horizon before initiating the trade and divide the trade accordingly.
-
The HA-Low indicator on the 1D chart is currently at 89294.25.
Therefore, I believe the market believes it's in a position to take profit.
-
Thank you for reading to the end.
I wish you successful trading.
--------------------------------------------------
- This is an explanation of the big picture.
(3-year bull market, 1-year bear market pattern)
I will explain in more detail when the bear market begins.
------------------------------------------------------
Altcoins Recovering: TOTAL3 Bounces from Key Support ZoneIn my previous analysis on TOTAL3, I mentioned that I'm working with two possible bullish scenarios for altcoins. It now seems we're firmly in Scenario #2.
📉 The price dropped exactly into the highlighted support zone, then yesterday we saw a clean recovery and reversal starting right from that area — a textbook technical reaction.
📈 At the time of writing, TOTAL3 sits at $986B, and a break above the $995B–$1T resistance could trigger a new leg up for altcoins.
🎯 Short- and mid-term targets remain:
• $1.08T (recent top)
• $1.15T
• Potential for new all-time highs if momentum builds
✅ As long as price holds above the $920–$930B support zone, bulls remain in control. This keeps the door open for selective altcoin entries — ideally, projects with real structure, strong tokenomics, and clear momentum.

BTC PERPETUAL TRADE ,Short from $113,700
BTC PERPETUAL TRADE
SELL SETUP
Short from $113,700
Currently $113,700
Stoploss $116,800
Targeting $111,600 or Down
(Trading plan BTC go up to $115K
will add more shorts)
Follow the notes for updates
In the event of an early exit,
this analysis will be updated.
Its not a Financial advice

Initia · Higher Highs & Higher Lows, The Market GrowsI can see it moving. I can clearly see the end of a bearish move and trading conditions being 100% different to just a few months back.
I can see the difference between the down period and the sideways period. Initia is no longer going down, the bottom has become flat. I can see the change. Change implies something different will happen and this is the market going up. It is no longer down, it has been sideways and now looking to change. A major rise is upon us. This chart can be used as a short-term trade setup.
Here is another one, notice the low 2-August. We have a higher low compared 8-July and the action is already happening back above the 22-June low which was a main low. Some pairs produced a strong higher low two days ago and I mentioned that the possibility exists for lower prices before rising. Here you can see why lower prices is not the most likely scenario. The market already hit bottom and is recovering and the recent bottom was a higher low. For a lower low, we know this last low would have been pierced as support and then taken out. The fact that it wasn't even tested is a signal of strength.
We still have to wait, but market conditions are looking good and we experienced only a very small retrace. It is normal, the market will continue to rise but as it rises prices will continue to fluctuate. A retrace can last 3 days but it can also last 2-3 weeks. A correction can last 2-3 weeks but sometimes it can extend into several months.
What we need to know is that these fluctuations are temporary and for as long as the market is bullish, each time the drop stops we get a new wave of growth. Each wave will produce a higher high and in this way the market grows.
Namaste.

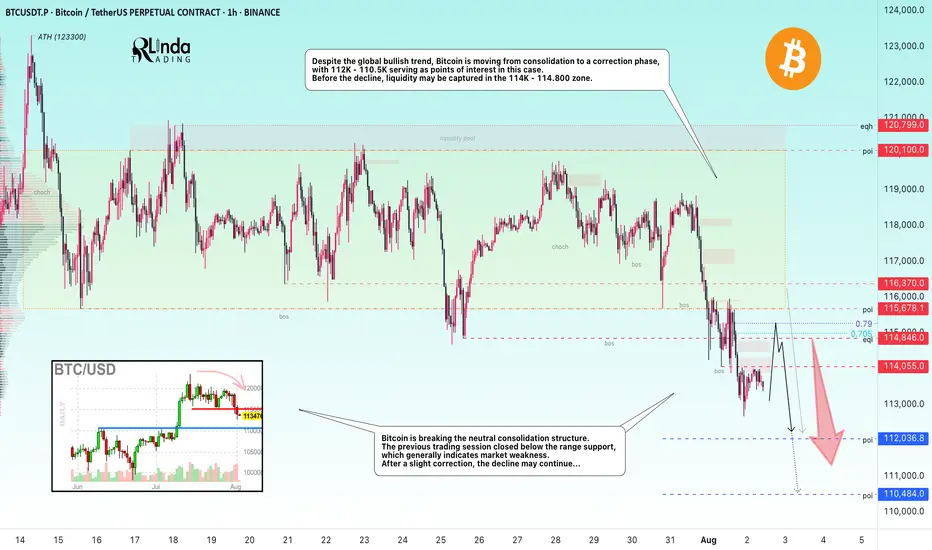
BITCOIN → From consolidation to distribution. Market weaknessBINANCE:BTCUSDT.P is moving from consolidation to a correction phase. The price broke through the support zone of 114.5–115.5, closing within the Friday trading session in the sell zone...
Previous idea from July 22: BITCOIN → Consolidation and compression to 116K. Correction?
The fundamental background is shifting to neutral, the hype has temporarily ended, and there are no bullish drivers yet. And for the health of the market, a correction is needed. Bitcoin is breaking the neutral consolidation structure. The previous trading session closed below the support range, which generally indicates market weakness. Despite the global bullish trend, Bitcoin is moving from consolidation to a correction phase, with 112K - 110.5K serving as points of interest in this case. Before the fall, liquidity may be captured in the 114K - 114.800 zone.
Resistance levels: 114.05, 114.85, 115.67
Support levels: 112.03, 110.48
After a strong movement, the market may enter a correction or local consolidation, during which it may test the specified resistance zones before continuing its downward movement to the zone of interest and liquidity at 112 - 110.5.
Best regards, R. Linda!
ETHUSD Long to 3700 BITSTAMP:ETHUSD Long trade, with my back testing of this strategy, ETHUSD need to touch 3700
This is good trade, don't overload your risk like greedy, be disciplined trader, this is good trade.
Use proper risk management
Looks like good trade.
Lets monitor.
Use proper risk management.
Disclaimer: only idea, not advice

Okay, Let's Take a Live Look Into the Market 📺⚡ Okay, Let's Take a Live Look Into the Market 💹🔥
Important levels across S&P 500, Bitcoin, and XRP are all flashing 🔴 right now. Here's what I'm seeing in real-time:
📈 S&P 500 Futures – 6,351 Is Everything
The 6,351 level marks the midpoint of the rising channel.
On Friday, I flagged 6,430 as critical resistance — price rejected perfectly.
Now we’re attempting a rebound, but we’re stuck at mid-channel.
⚠️ A confirmed breakout above 6,351 could reignite upside momentum.
👉 Yes, this is a 1-minute chart, but precision matters when watching key structural levels — especially in legacy indices.
💥 BTC – 115,700: The Grandmaster Level
Zoom out and see the massive yellow horizontal on the chart: 115,700.
It’s not just any number — this is the ultimate resistance-turned-support battleground.
We’re currently under it, which keeps pressure to the downside.
A reclaim flips the structure bullish and opens room for trend continuation.
📌 Until we’re above it, this remains the dominant resistance across the entire crypto macro framework.
🧩 XRP – Still Facing Rejection
On the 2H/3H chart, XRP continues to flirt with resistance but fails to confirm strength.
This aligns with both the S&P 500 stalling at 6,351 and Bitcoin being capped at 115.7K.
📉 When multiple assets respect key levels in sync, it signals market-wide hesitation.
🔄 Cross-Market Confluence
It’s fascinating to watch:
A TradFi index (S&P)
A macro crypto asset (BTC)
A mid-tier alt (XRP)
...all pivoting around hyper-precise structural resistance at the same time.
✅ These aren’t coincidences. They’re systemic correlations.
🔮 What’s Next?
If S&P 500 breaks above 6,351, it could act as a risk-on signal.
That momentum could help BTC flip 115,700 — a massive deal.
And if that happens, XRP could finally follow with a stronger move.
Until then? We respect resistance and wait for confirmation. 📊🔍
One Love,
The FXPROFESSOR 💙
Disclosure: I am happy to be part of the Trade Nation's Influencer program and receive a monthly fee for using their TradingView charts in my analysis. Awesome broker, where the trader really comes first! 🌟🤝📈

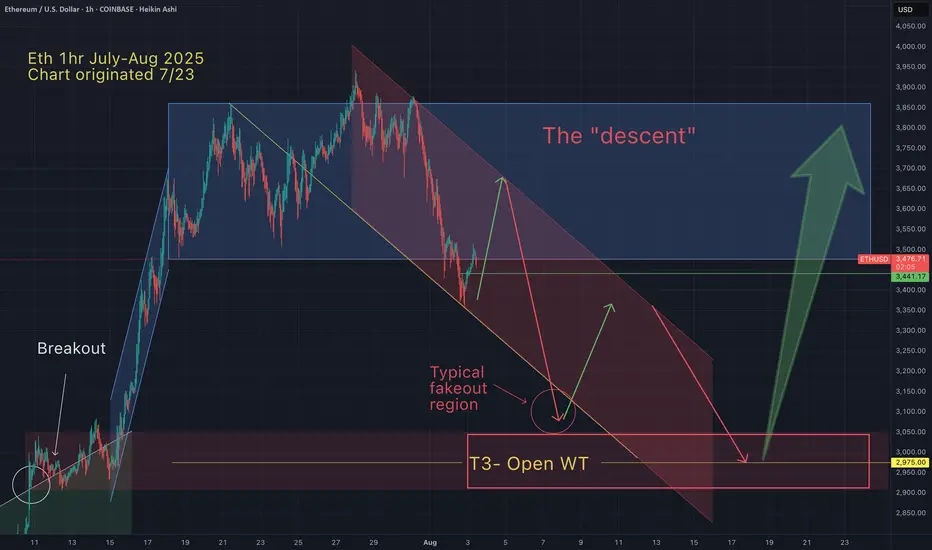
Eth - An aticipated path of continued downward price actionThis is just a thought eperiment based on years of watching patterns repeat.
I like to anticipate price action so I know if/when my trading ideas are being invalidated.
Regardless of the actual path downward, I'm still holding out for $3K or less.
May the trends be with you.
LTC/USDT- Mega classic box Litecoin (LTC) has spent the last three years forming a textbook accumulation pattern, specifically a classic horizontal box range, with key support around the $100 zone acting as a historical floor. This level has held through multiple bearish cycles, showing strong buyer defence and accumulation interest from long-term holders and institutions.
After a prolonged consolidation, bullish momentum is emerging, as evidenced by:
Breakouts above mid-range resistances with volume
Successful retests of the $100 level confirming it as solid support
Emergence of higher lows and bullish structure on the weekly chart

others \ btcOthers bitcoin pair has found support from the rising trend line since 2016 2017 and continues to recover

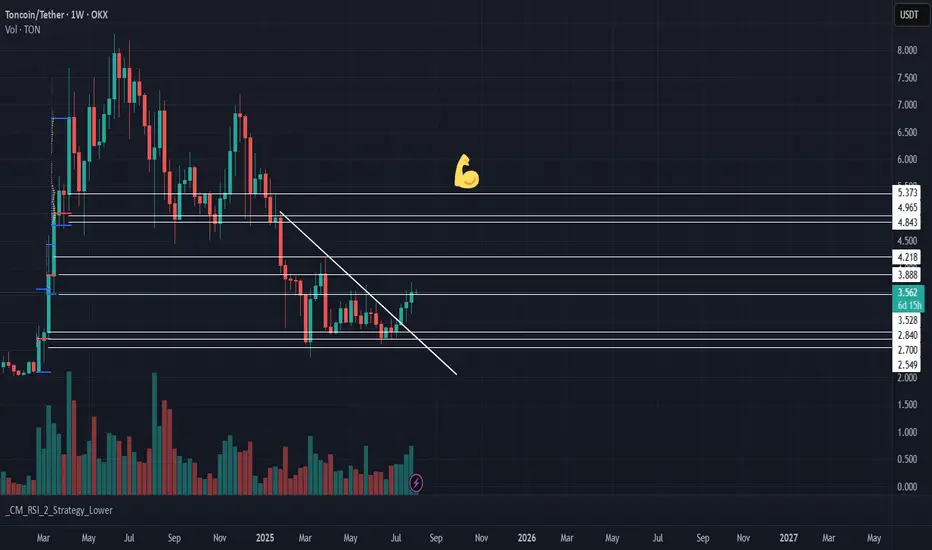
Title: TON Eyes $5.50 After Breaking DowntrendAfter breaking its downtrend, TON Coin has set its sights on the $5.50 target. Potential resistance levels have been identified using volume analysis.
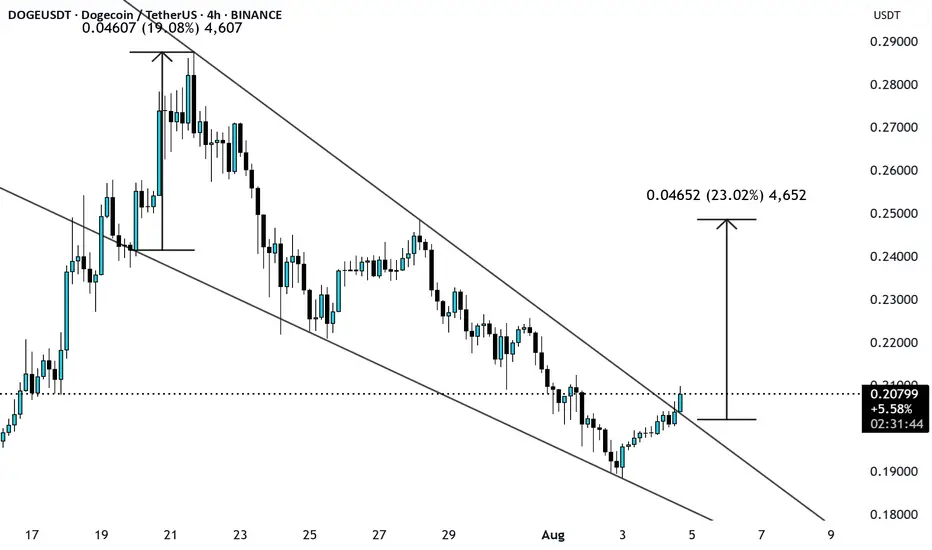
DOGEUSD bullish wedge BREAKOUT - wait for candle to close. DOGE/USD has broken out of the bullish wedge pattern. The 4-hour candle has not yet closed, so it's best to wait for confirmation. Consider entering the trade on a retest of the breakout level.
Target: Around $0.25
Stop Loss: Around $0.20
Let’s see how it plays out.
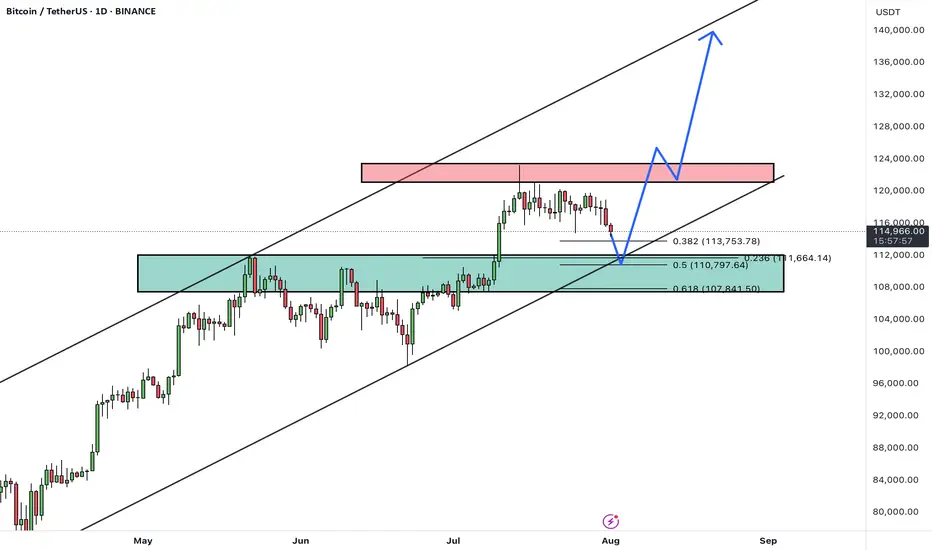
BTCUSDTHello Traders! 👋
What are your thoughts on BITCOIN?
After a strong rally, BTC is currently pulling back from the 124K resistance area, heading toward a major confluence support zone between 108,000– 110,000, which aligns with:
✅ Previous breakout zone
✅ 0.5–0.618 Fibonacci retracement
✅ Lower bound of the ascending channel
This level is expected to attract buyers and act as a base for a new bullish leg.
Scenario Ahead (Main Bias):
1. Price dips into the 108–110K support
2. Bullish reversal from the zone (watch for strong reaction candles or bullish divergence)
3. Target 1: 124K (retest resistance)
4. Target 2: 135K–140K (upper channel boundary upon breakout)
BTC remains in a healthy bullish structure. Current pullback is considered constructive, and the 107–110K zone offers a high-probability long setup. Watch for bullish signals before entering.
A confirmed daily close below 107K would invalidate this bullish structure and expose BTC to deeper correction levels.
What’s your take on this setup? Do you expect a bounce from support or a deeper correction? Share your thoughts below 👇
Don’t forget to like and share your thoughts in the comments! ❤️

It's time for tea and cake.The bull market is the best time to accumulate wealth. Cake is one of the best companions on this path.

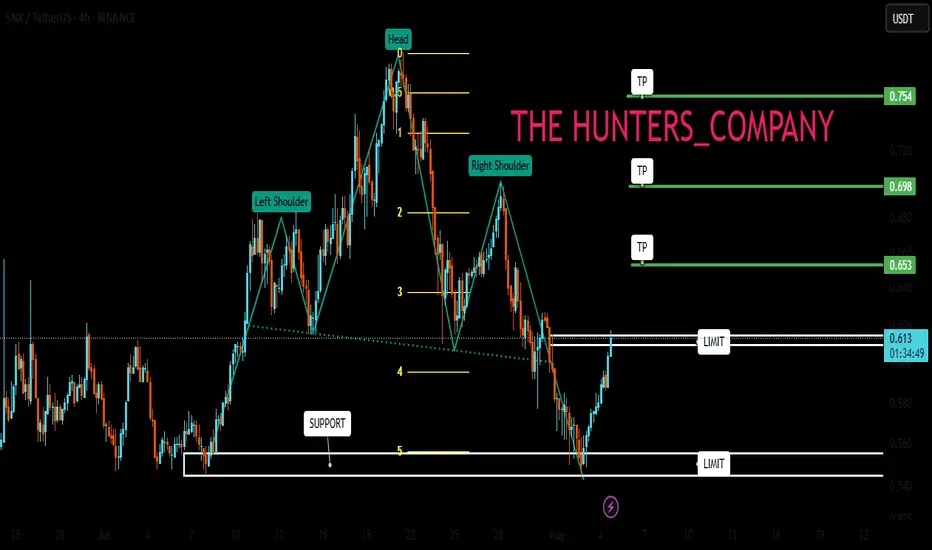
SNX : Has the climb started?Hello friends🙌
👀According to the shoulder and shoulder pattern that was formed and then the price fell in the support area that we identified for you with Fibonacci, buyers entered and provided good support for the price, which also broke our resistance, which creates a good opportunity to buy, of course with risk and capital management.
🔥Follow us for more signals🔥
*Trade safely with us*
MAGIC : Magic is neededHello friends🙌
📈Given the good rise we had, the price is now in the ascending channel, now in the specified support areas, you can buy in steps with risk and capital management and move to the specified targets.
🔥Follow us for more signals🔥
*Trade safely with us*

ETH 4H – Demand Ladder Holding Strong, Bullish Set Up?Ethereum has been climbing a ladder of demand zones on the 4H chart — with each major impulse followed by consolidation and a successful retest of prior support. This current pullback has once again tapped into a reclaimed demand area near $3,400–$3,500.
So far, every past structure has acted as a springboard for the next leg up — a pattern that’s held since April.
📊 Key insights:
– Multiple confirmed demand zones stacking higher
– Prior demand flips to support after each breakout
– Most recent pullback held structure with Stoch RSI bouncing from oversold
– Structure and momentum suggest potential continuation if $3,400 holds
A breakdown of this final zone could invalidate the staircase, but until then, structure favors the bulls.
Is ETH gearing up for $4,000+ or finally losing steam?
Drop your thoughts in the comments.

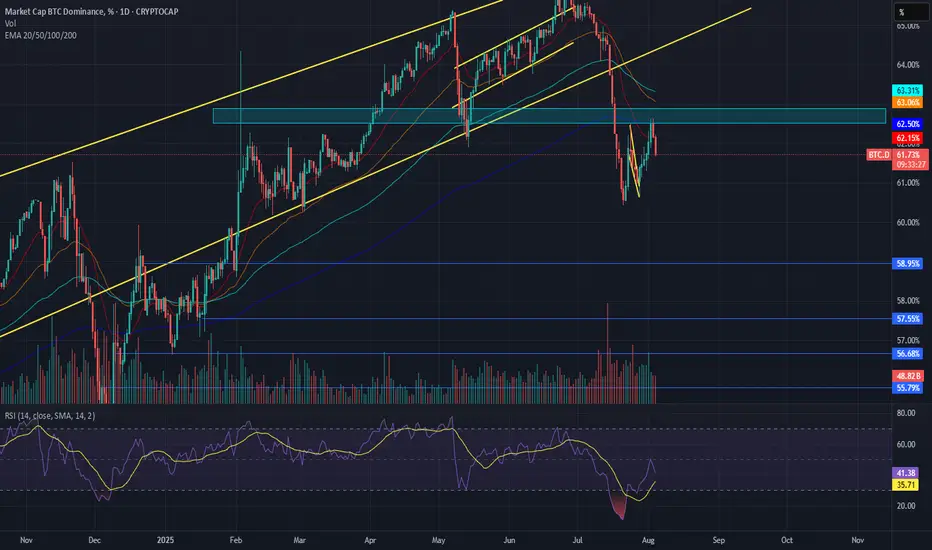
BTC.D trendBTC.D bounced from the support zone of 60% two times, this is a strong level which we have to break out to see altseason in near future. The BTC.D made a correction reaching 62% resistance zone and bounced back from this level, as a result we see how altcoins and ETH are started growing again, I expect to see a strong downfall and as soon as the BTC.D will breakout the support level of 60%, this will be a clear sign of bull run
Altseason Countdown: When Will Alts Explode? Hey traders,
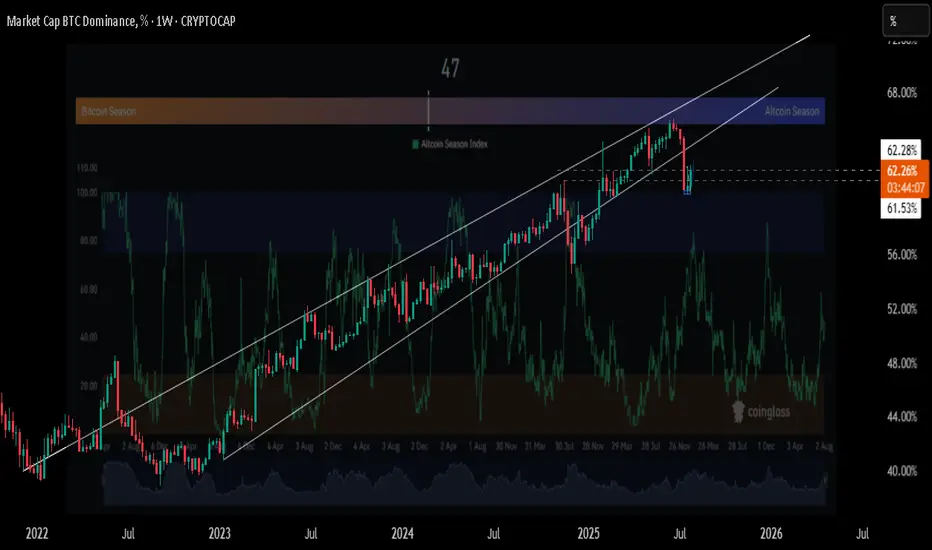
✅ Altcoin Season Index
Currently at 47, a neutral zone — not yet favoring altcoins
True altseason usually begins when the index rises above 75, showing consistent altcoin outperformance
Historically, transitions from this level to full altseason take around 1–3 months, assuming BTC dominance declines
✅ Bitcoin Dominance (BTC.D)
BTC dominance is rebounding from strong support near 61%, now around 62.25%
As long as Bitcoin holds dominance, capital remains concentrated, delaying altcoin rallies
If BTC dominance tops out near current levels and begins trending lower, it could trigger broad altcoin strength
✅ Macro Insight: Fed & Liquidity Outlook
Based on current macro conditions, I anticipate that the Federal Reserve may introduce rate cuts as early as September
A rate cut would inject more liquidity into markets, increase risk appetite, and historically benefit altcoins more than BTC
This potential shift in monetary policy aligns well with the technical setup for altseason acceleration
🧠 My Timeline Projection
If BTC dominance reverses within the next few weeks, altseason could begin around September–October 2025
If dominance remains strong or climbs above 63–64%, the shift may be delayed into late Q4 2025
📌 Final Thoughts
Altseason isn’t here yet, but multiple signals are aligning: a mid-level index, a possible BTC dominance top, and a favorable macro window.
Share your thoughts in the comments box.
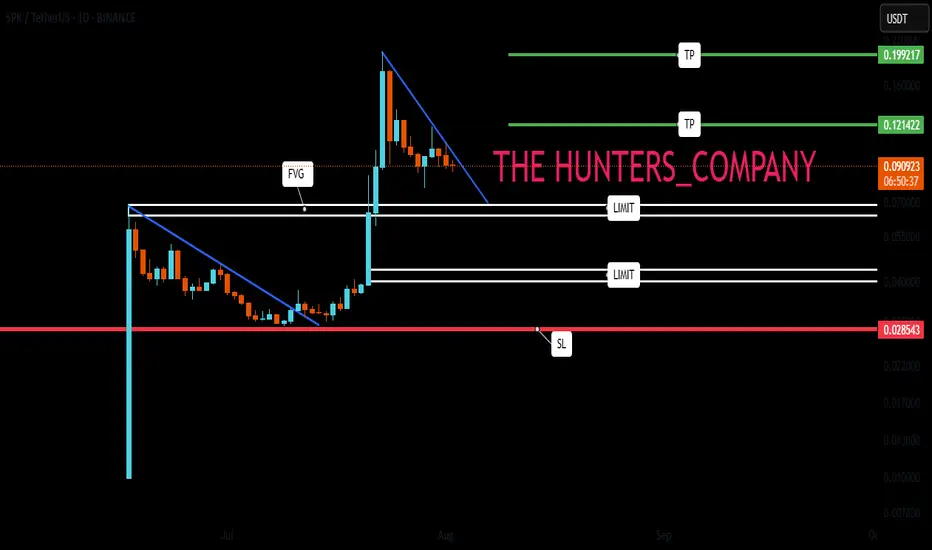
SPK : Does history repeat itself?Hello friends🙌
✅You see that once a pattern was formed and after the resistance was broken, we had a good growth.
✅Now the same pattern has formed again and the price is in the accumulation phase.
✅We have to see if history repeats itself and if the buyers support the price again or not.
✅We have obtained important support areas for you, so that if it falls, you can buy in steps and if the pattern breaks, you can buy in steps right here, of course with capital and risk management.
🔥Follow us for more signals🔥
*Trade safely with us*
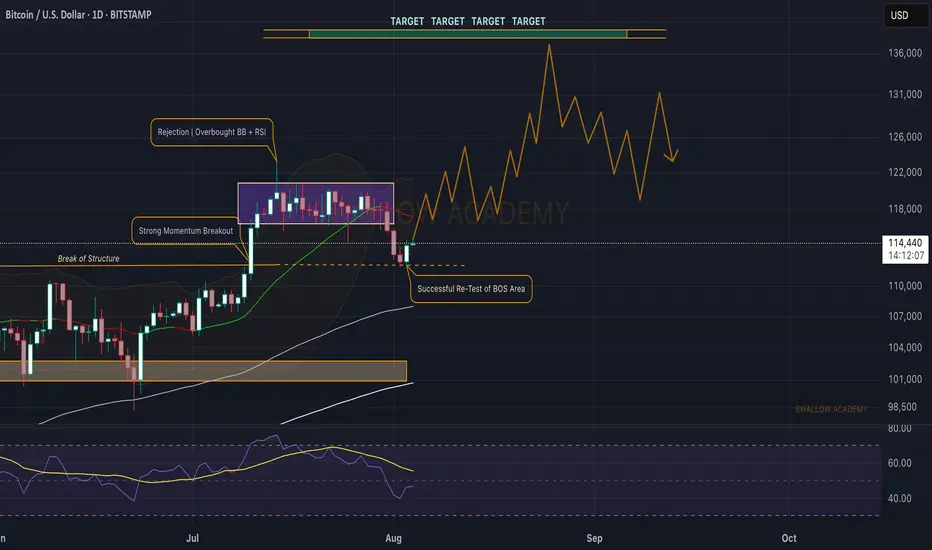
Bitcoin (BTC): Successful Re-Test on Break of Structure AreaBitcoin is showing a good start at the beginning of the week, where we are seeing a successful retest happening, which again might send the price back into the accumulation zone and then the breakout we have been looking for.
So as long as we are above the retest zone of BOS, we are bullish; if we break it, then 101,000-104,000 is going to be our next target!
Swallow Academy