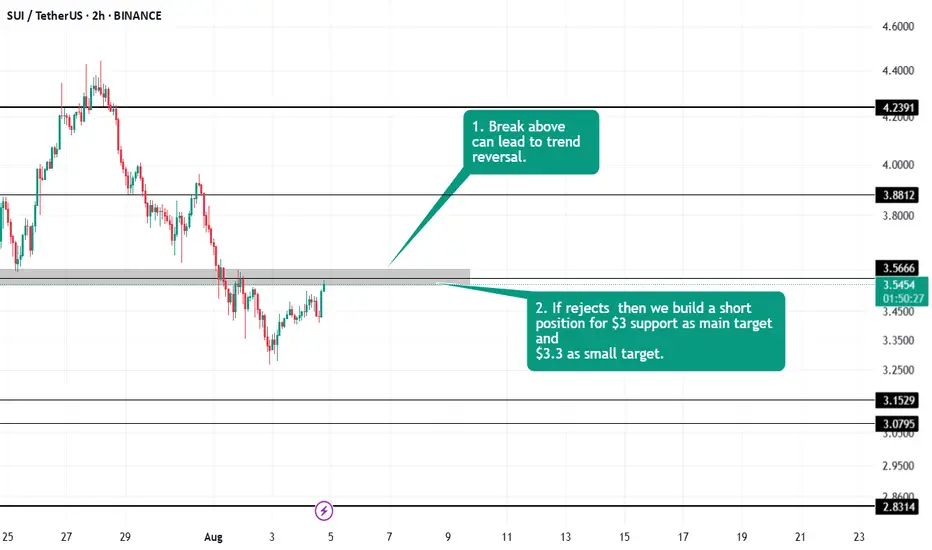
#SUI TRADE PLAN Closely monitoring the trade. Would update once a decision candle is formed.
Keep watching
Crypto market
Fartcoin price analysis. Wave -(5)- coming soon ?)📢 Almost 3 months have passed since our last #Fartcoin post
During this time, the #FartcoinUSDT price has corrected itself well.
📈 What do you think about making another wave up - (5) - the final one?
Well, at least looking at our interpretation of the wave analysis on this chart, it turns out that there is a chance for this !)
🚀 Growth to $2 and $2.37
ℹ️ The main and unshakable condition is that the #Fartcoin price cannot fall below $0.87 for this analysis and forecast to be relevant!
________________
📚 Follow us ❤️ for daily crypto insights & updates!
🚀 Don’t miss out on important market moves

Bitcoin confirmation of a pull back before the sell pressure Confirmation of a pull back before the sell pressure ..... so we are to hold all our sell positions
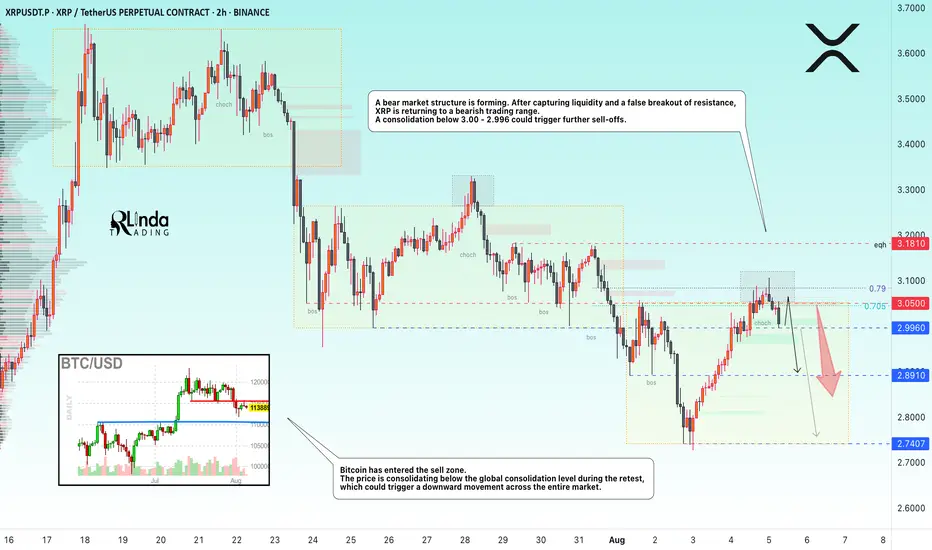
XRPUSDT → Hunting for liquidity ahead of a possible declineBINANCE:XRPUSDT.P is forming a downward market structure after a false breakout of global resistance. Bitcoin is in a correction phase and, after a slight rebound, may continue its movement...
Bitcoin has entered the sell zone. The price is consolidating below the global consolidation boundary of 115,500 during the retest, and if Bitcoin continues to decline, this could trigger a downward movement across the entire cryptocurrency market.
XRP is forming a bearish market structure. After capturing liquidity and a false breakout of resistance, the price is returning to a bearish trading range. There is no potential for continued growth at this time. A consolidation of the price below 3.00 - 2.996 could trigger further sell-offs.
Resistance levels: 2.996, 3.050, 3.181
Support levels: 2.996, 2.891, 2.74
The local bearish structure will be broken if the price starts to rise, breaks 3.050, and consolidates above it. In this case, XRP may test 3.181 before falling further.
At the moment, after a false breakout of resistance, the price is consolidating in the selling zone, and the downward movement may continue. I consider 2.74 - 2.655 to be the zone of interest in the medium term.
Best regards, R. Linda!
Artificial Alliance (FET): Good Opportunities For Trades HereBINGX:FETUSDT.P can provide us with favorable risk-to-reward trades in both directions. We are looking for now for a bullish outcome here, where we are targeting upper zones of $0.77 and $0.88, but this game plan will be active only as long as we are above $0.60.
As if sellers take over that $0.60 zone, we are going to see a steep movement to lower zones, where again we can take a short position!
Swallow Academy

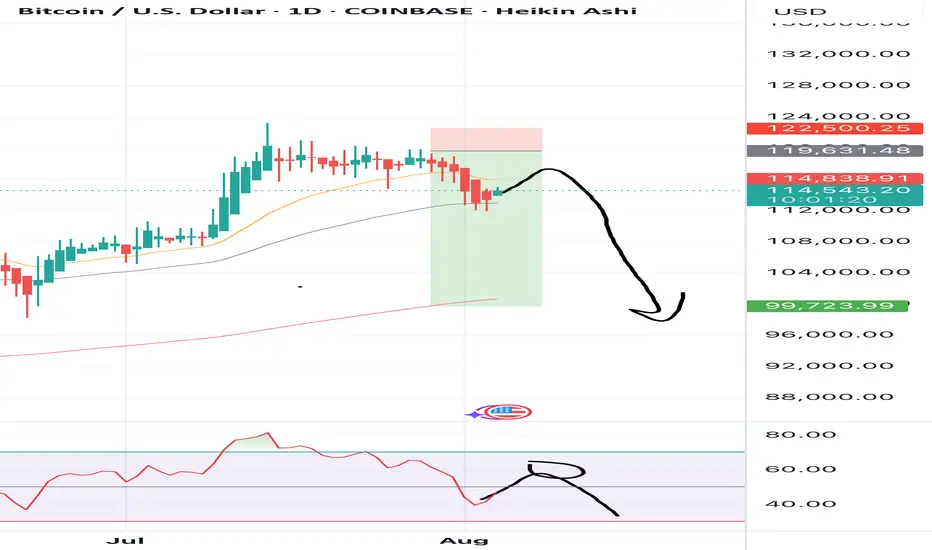
"BTC Moves Down — Scenario Confirmed"As expected, the market couldn’t sustain the overheating.
Over the past few days, Bitcoin has shown clear signs of weakness. The rally from $105K to $118K happened too quickly, without proper correction, and with noticeably declining volume toward the end of the move. In such situations, the market often loses footing — and that’s exactly what we’re seeing now: BTC has corrected down to $114,000.
If you've been following my analysis, you know I pointed out signs of overheating earlier: strong deviation from moving averages, weak reaction at key resistance levels, and upward wicks without volume confirmation. My indicator gave an early warning of trend weakening around the $117–$118K zone. That’s when it became clear momentum was fading.
This isn’t a crash or panic — it’s a normal, healthy market correction. Overleveraged long positions are getting flushed out, and late entries at the top are being shaken off. In such phases, it’s crucial not to react emotionally but to follow a clear system.
The key point: markets don’t reverse “suddenly.”
Everything happening now was visible in advance — if you were looking not just at price, but at the structure of the movement.

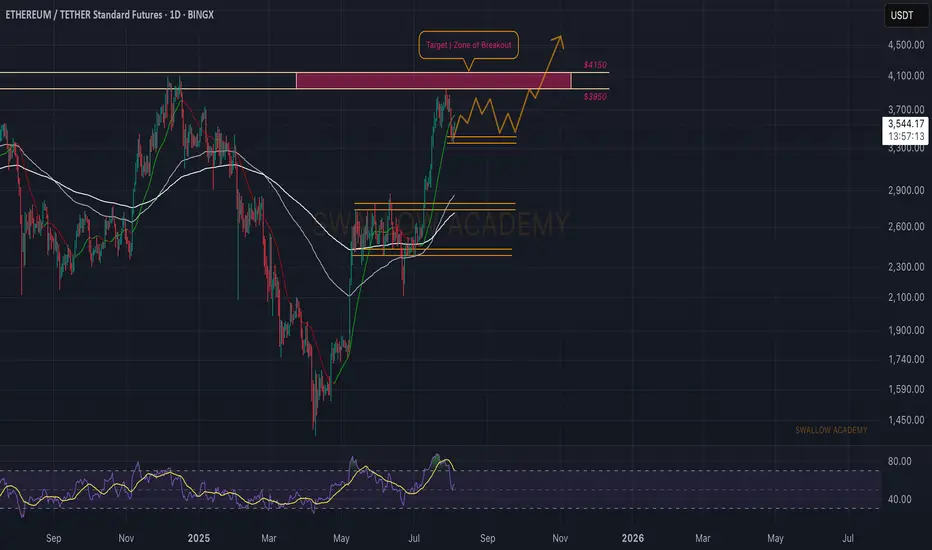
Ethereum (ETH): Zone of Rejection Turning Into Zone of BreakoutSince last time, we were looking for a zone of rejection, which happened as well, where price had a smaller pullback, and now upon the start of a new week, we might be seeing the start of recovery as well.
Which means, as long as we are above the $3,350 zone (which is the local low area), we are bullish; if we break that zone, this would be the ideal area for a short!
Swallow Academy
From Fakeout to Takeoff: How the V-Pattern REALLY WorksEver seen a support level break, only for the price to rocket back up in a V-shape? That’s the V-Pattern in action! In this post, Skeptic from Skeptic Lab breaks down the step-by-step mechanics of this powerful setup. From the fakeout that traps short sellers to the surge of buy orders from liquidations, you’ll learn exactly how buyers flip the script and create explosive reversals. Perfect for traders looking to spot high-probability setups. Join me to decode the markets—check out the steps and level up your trading game!

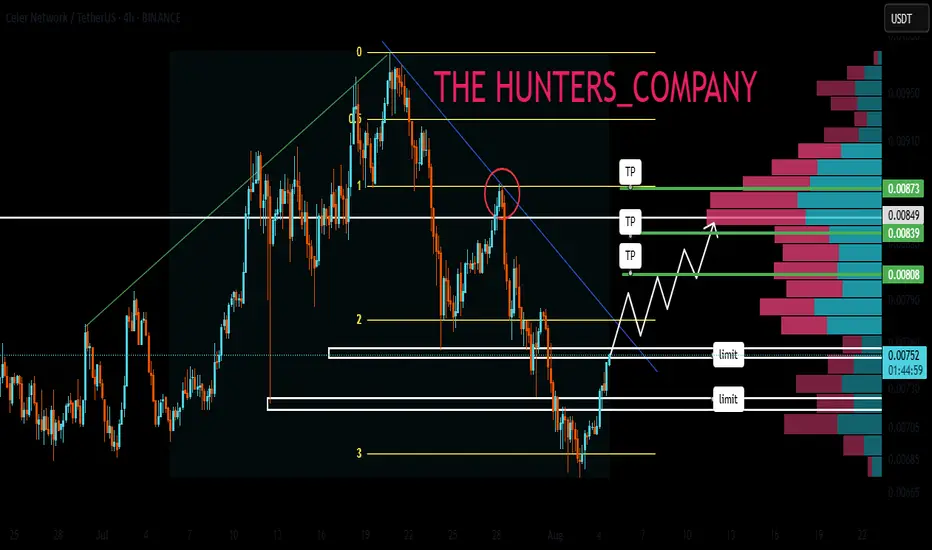
CELR : Sensitive areaHello friends🙌
✅Considering the decline we had, you can see that the price has been well supported in the support area drawn with Fibonacci and now it seems that it wants to go up to the specified ranges, which are also good and high-volume ranges, and these areas are like magnets for the price.
✅Don't forget risk and capital management.
🔥Follow us for more signals🔥
*Trade safely with us*
This is the same fractal for XLM from April 2017.The Fractal from April 2017 is repeating with the November Pump and the recent pump as well.
Next comes a dip and then another pump up to $1

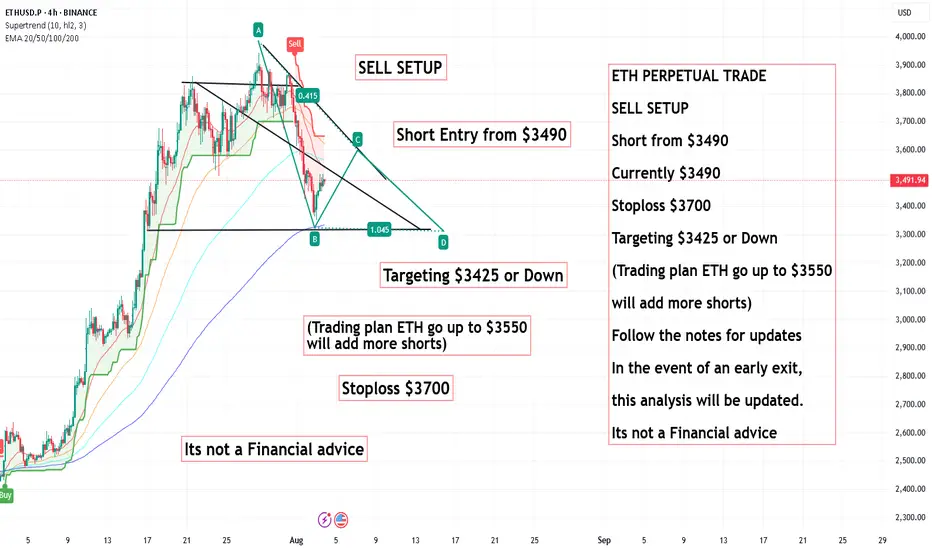
ETH PERPETUAL TRADE ,Short from $3490ETH PERPETUAL TRADE
SELL SETUP
Short from $3490
Currently $3490
Stoploss $3700
Targeting $3425 or Down
(Trading plan ETH go up to $3550
will add more shorts)
Follow the notes for updates
In the event of an early exit,
this analysis will be updated.
Its not a Financial advice
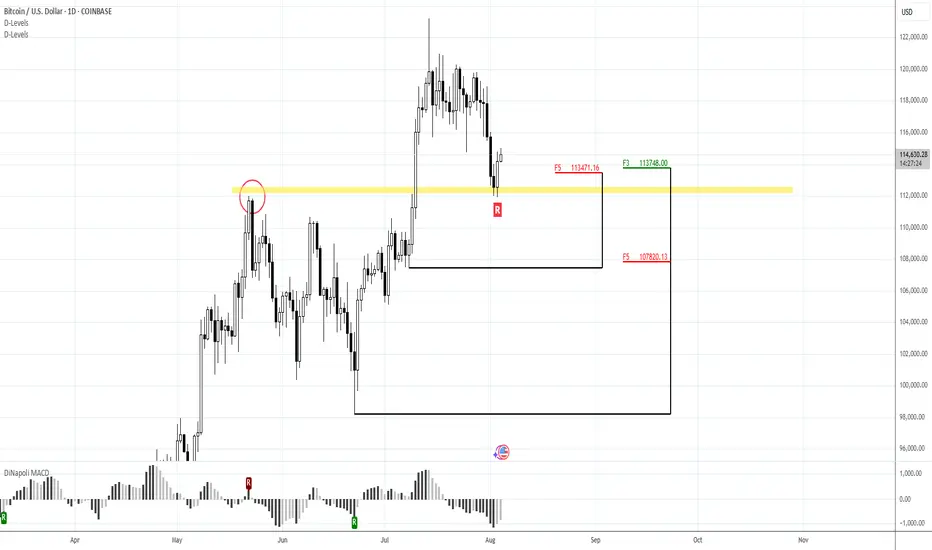
Watching for intraday BTC bounce firstMorning folks,
So, neither NFP data nor technical picture helped BTC to stay above 117. While US Treasury is started drain liquidity and borrow (they need 1 Trln this month), sending ~ 150 Bln to its TGA account with the Fed - BTC got hurt.
Now price stands at vital area - previous tops. If BTC will drop under 110K, collapse could start. Let's hope that this will not happen...
Meantime, we're at 112-113K support. We already talked about it before. Here we have reversal bar and bullish engulfing pattern, so maybe we could get a bit higher pullback on intraday chart. 113.8 and 113.1K support areas on 1H TF might be considered for long entry. Invalidation point for this plan is the low of engulfing pattern.
BTC DAILY - CUP & HANDLE BREAKOUT TARGETING $169KBitcoin just confirmed a macro Cup & Handle breakout with a strong push above the $112K neckline. The price is now consolidating above key moving averages – setting up for a potential explosive continuation. 🔥
🟢 Technical Highlights:
📈 Cup & Handle pattern – classic bullish continuation
💥 Breakout target: +32% move → $169,000
🟩 1D MA 50 / MA 200 acting as dynamic support
🔄 MACD bullish cross confirming momentum
🟦 Breakout above major resistance = new market structure zone
🧲 Psychological support near $99K and $112K
***********************************
🎯 Buy Signal Details:
Entry Zone (Pullback Valid): $112,000–$114,000
Take Profit: $169,000 🎯
Stop Loss: $99,000 🛡️
Buy Confidence: 95% ✅
📌 Not financial advice. This is pure chart-based technical analysis.

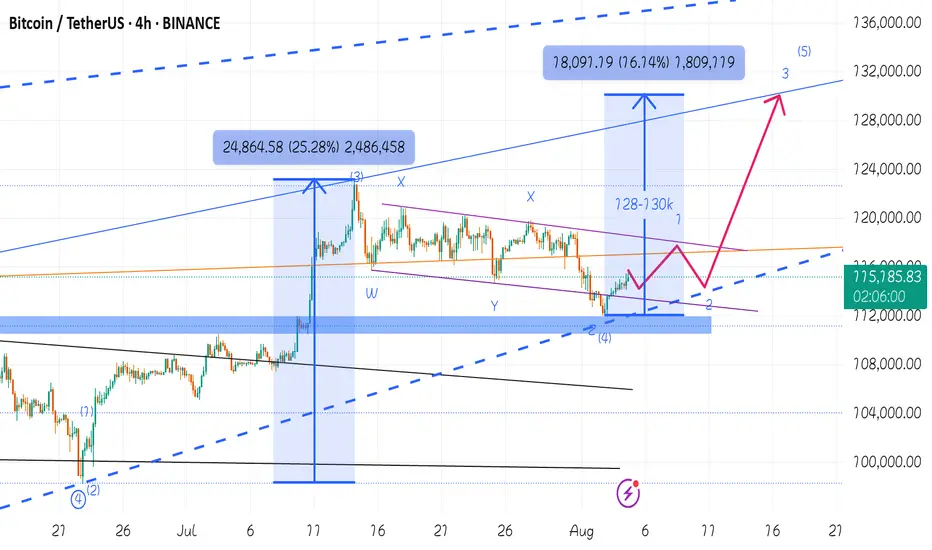
You don't know what's going on , 130K waiting for youI have shown in my previous post that Bitcoin is looking for a correction of wave 4 from wave 5 of the main wave 3 of Elliott waves, I said wait for 112k and then buy altcoins. It seems that the Elliott wave 4 micro-wave has completed its correction with the 50% Fibonacci percentage, I predict Bitcoin will touch the 128-130k levels at the end of Elliott wave 5. as I said before altcoins season is in the midway
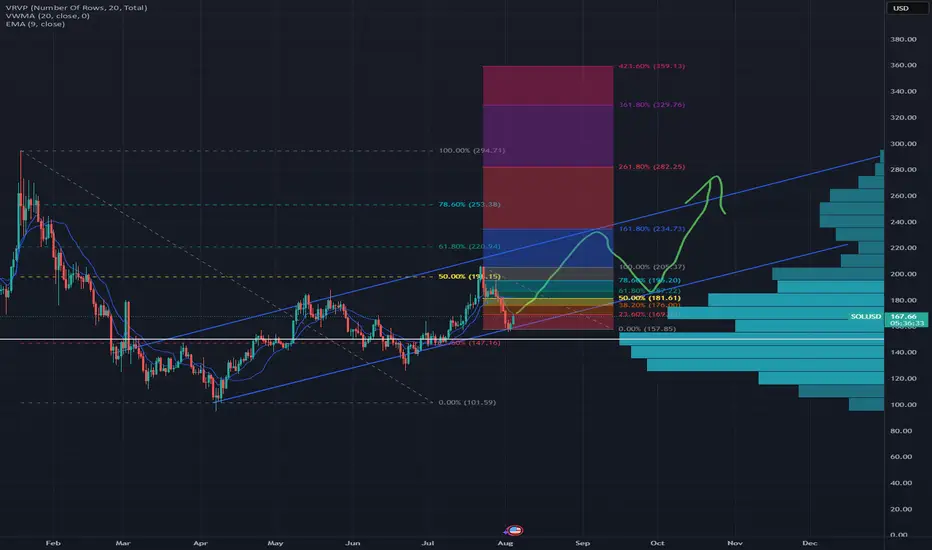
On our way to a new ATH for SOLUSD?This is a possible scenario idea I have in mind for SOLUSD that I want to share with everyone.
Keep in mind that this is not an advice to buy, it should be your decision to buy this specific asset.
There are 4 reasons I am thinking that we are (still) on our way to a new ATH for Solana and why I am extremely bullish on this specific crypto asset:
1. The orange man is pushing the FED for rate cuts for weeks: there already are some numbers (f.e. low inflation) out there that this might happen THIS week!
2. There is enough volume on 150$ & 170$ levels. We will are still on our way up!
3. The common crypto cycle is still happening: BTCUSD have bounced perfectly from the 112$k level and continued to move up, whales and other big guys are still buying BTCUSD at this time which is very bullish (another ATH is inevitable!) -> if the cycle repeats itself, BTCUSD will probably crash afterwards just like previous cycles -> this will be followed by a new ATH for ETHUSD -> after that, SOLUSD will be the next one to set a new ATH afterwards, just like back in Q4 2024 & Q1 2025. The higher ETHUSD will go the better it will be for alt coins like our baby Solana.
4. Solana is not even close to its former ATH: stepping in right now, will make larger profits later.
5. Last but not least: ETF approvals are still on the way!
The ATH I have in mind that will be set for Solana will be between 400$-600$ or with some luck, even higher.
Some people might not be happy in the way SOLUSD is performing right now, but I only learned one thing: that patience makes money when it comes to crypto. For everyone that is thinking about stepping in, I think there is still time to make profit from here on (but then again, of course at own risk, at all times!).
Another thing I want to add to this idea is to watch out for the first retracement/resistant level: this might be around 225$-234$ as shown in this Graph. Because there was more selling volume in Q1 2025 at that level.
Hope you liked my idea & graph about SOLUSD. Good day and happy trading everyone!
The Great BTC DumpI'm longterm bullish on BTC for generational wealth. I think it will keep going up, but not every year, we're approaching what should be the top this cycle or may have already hit it at 123k. I think the drawdown will come faster than previous cycles due to the nature of the cycle and preparedness of whales, institutions, and retail for it. Based on the 3 previous cycles and assuming 123k was the top on Aug 12th, using decay models the target is roughly 50k by December 9. That would be the bulk of the bear market move, but there would hypothetically be a little more drawdown afterward. I hope it's not this bad but just as a reminder to myself and anyone else that views this I thought this would help prepare for the worst.

KAITO/USDT: High-Reward Long Setup from BIG BANG THEORYFirstly, our Algo-based indicators are used to create this analysis. Follow me so you don't miss, Boost and leave your comments if you profited with our posts, so we may continue:
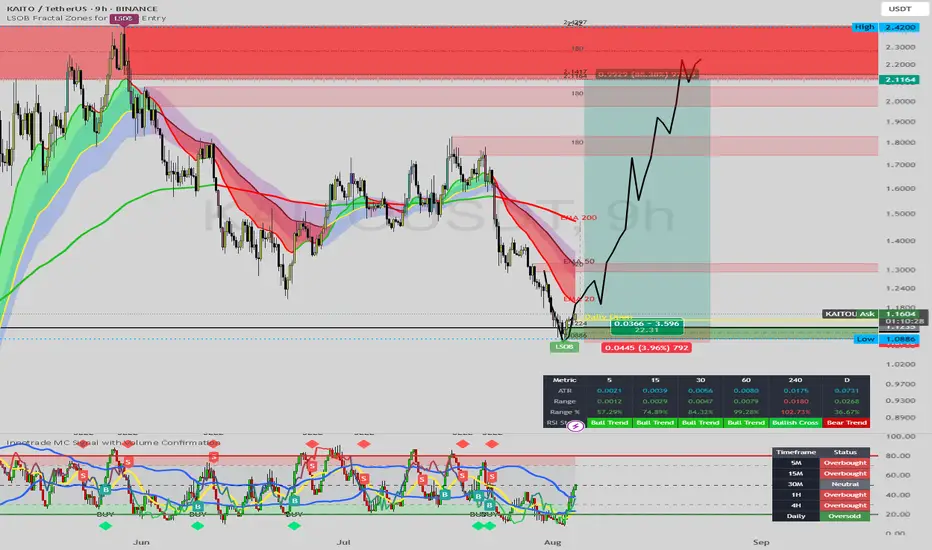
This 9-hour chart for KAITO/USDT highlights a compelling long trade setup originating from a critical support level, suggesting the potential for a significant rally.
Key Support Bounce: The price has found strong support and reversed from a key "LSOB" (Liquidity Sweep Order Block) zone, with the low established at $1.0886. This type of level often marks significant turning points where liquidity is hunted before a move in the opposite direction.
Indicator Confirmation: The custom indicator at the bottom of the chart strongly supports a bullish reversal. It shows the price moving sharply out of the deep oversold "BUY" zone. Furthermore, the "Daily" timeframe status is marked as "Oversold," adding significant weight to the potential for a strong bounce or trend reversal.
Entry: Around the current price levels (~$1.16).
Stop Loss: Tightly placed just below the recent low at approximately $1.0886.
Take Profit: The primary target is set at $2.1164, which aligns with a major resistance zone.
Risk/Reward: This setup presents an exceptional risk-to-reward ratio of approximately 22:1, with a potential gain of over 88%.
Strategy:
The illustrated black line projects a strong rally from the current accumulation zone. The move is expected to break through intermediate resistance levels around $1.30 and $1.80 before pushing towards the final target.
Conclusion:
The confluence of a bounce from a major liquidity zone, strong confirmation from oversold indicators, and a well-defined trade setup with a massive risk-to-reward ratio makes this a very compelling bullish scenario for KAITO/USDT.
Disclaimer: This analysis is for educational purposes only and should not be considered financial advice. Always conduct your own research and manage risk appropriately.
longI think the pullback is complete and the beat can grow, but I'm still paying attention to the Dominance Beat. Thank you for your attention.

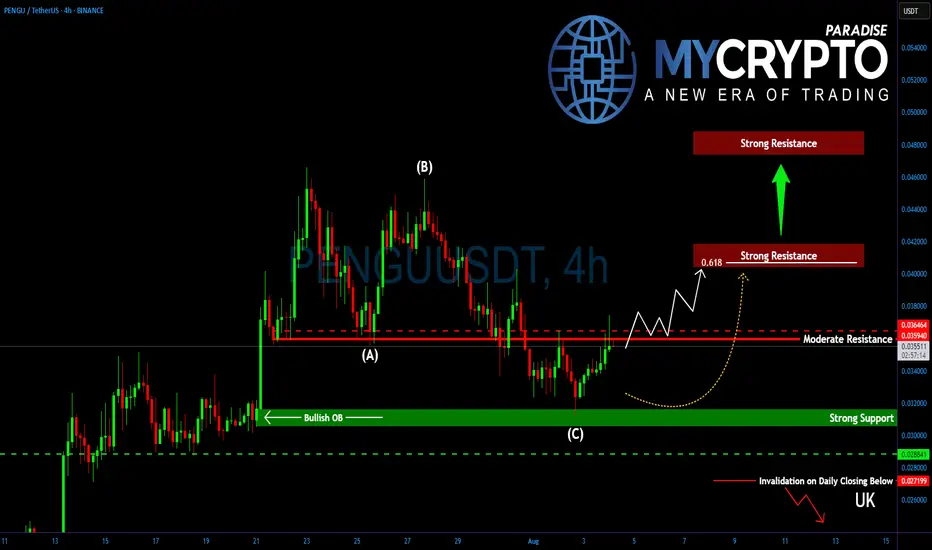
Is PENGU About to Explode or Fake Out Everyone Again?Yello, Paradisers! Have you been watching #PENGUUSDT after its recent dip? Because if you haven’t, you might be missing out on a potentially explosive setup forming right now…
💎After placing a major high around $0.0460, PENGU entered a textbook ABC corrective wave. But that correction looks to be over now, and what’s emerging could be the beginning of a powerful bottoming structure.
💎#PENGU is currently facing a critical short-term resistance at $0.0360–$0.0364, a level that bulls must flip to ignite a stronger recovery. If they succeed, all eyes shift toward the 61.8% Fibonacci retracement at $0.0405, a major confluence level that aligns with a key horizontal resistance between $0.0405 and $0.0415. Expect heavy action here. Bulls will likely face real pressure at this zone.
💎However, and this is where it gets interesting, if PENGU breaks above $0.0415 with strength, then momentum could pick up fast, paving the way for a fresh rally towards new yearly highs between $0.0480–$0.0494.
💎On the flip side, support remains solid between $0.0312 and $0.0302. This zone isn’t just an ordinary support, it also holds a bullish order block (OB), offering extra protection and confluence. This is where the market is quietly showing signs of strength while the majority are distracted elsewhere.
Paradisers, strive for consistency, not quick profits. Treat the market as a businessman, not as a gambler.
MyCryptoParadise
iFeel the success🌴
SYNUSDT: Breaking Long-Term Downtrend, Poised for a Major Rally?Firstly, our Algo-based indicators are used to create this analysis. Follow me so you don't miss, Boost and leave your comments if you profited with our posts, so we may continue:
This daily chart for SYNUSDT showcases a significant technical development as the price appears to be breaking out of a multi-month descending channel, signaling a potential major trend reversal.
Analysis:
Descending Channel Breakout: The price has been confined within a clear descending channel for most of the year. The recent price action shows a decisive push above the upper boundary of this channel. It is currently consolidating right above this broken trendline, which is a classic "breakout-and-retest" pattern.
Key Support: The current price is finding support at the 23.6% Fibonacci retracement level (around $0.1212). A successful hold above this level would reinforce the bullish breakout.
Momentum Indicator: The Innotrade MC Signal at the bottom provides strong confluence. The indicator is sharply rising from the oversold "BUY" zone in a pattern labeled "V-Band Rising," which suggests a powerful burst of bullish momentum from a bottom.
Price Projection and Targets: The illustrated price path anticipates a strong upward move following this retest phase.
The first major area of resistance to watch is the zone between the 61.8% Fib level (0.2147)
𝑎
𝑛
𝑑
𝑡
ℎ
𝑒
78.6, (0.2147). This area also contains a previous order block (LSOB) and the EMA 200.
Target 1: is explicitly marked at $0.2777.
Higher targets based on Fibonacci extensions are noted at $0.5709 and above for the longer term.
Strategy:
Position : Long (Buy)
Entry: The current price level, retesting the broken channel trendline (around $0.12 - $0.14), presents a strategic entry point.
Targets: The initial primary target is $0.2777, with further long-term potential if bullish momentum is sustained.
Conclusion:
The combination of a breakout from a long-term bearish structure, a successful retest of support, and powerful momentum indicators suggests that SYNUSDT could be at the beginning of a new, significant uptrend. The current price offers a favorable risk-to-reward entry for a move towards the identified targets.
Disclaimer: This analysis is for educational purposes only and should not be considered financial advice. Always conduct your own research and manage risk appropriately.

FIL Nears Support Within Falling Wedge Formation📆 LSE:FIL is trending inside a falling wedge on the daily chart — a classic bullish structure that often precedes strong reversals 📐
Price is now approaching the key support zone 🔽 where buyers have historically stepped in. This zone could trigger a bounce if defended well, but a clean breakdown would invalidate the wedge and shift momentum.
👀 Structure looks ripe for resolution — breakout or breakdown incoming?
Drop your view below.
Not financial advice.


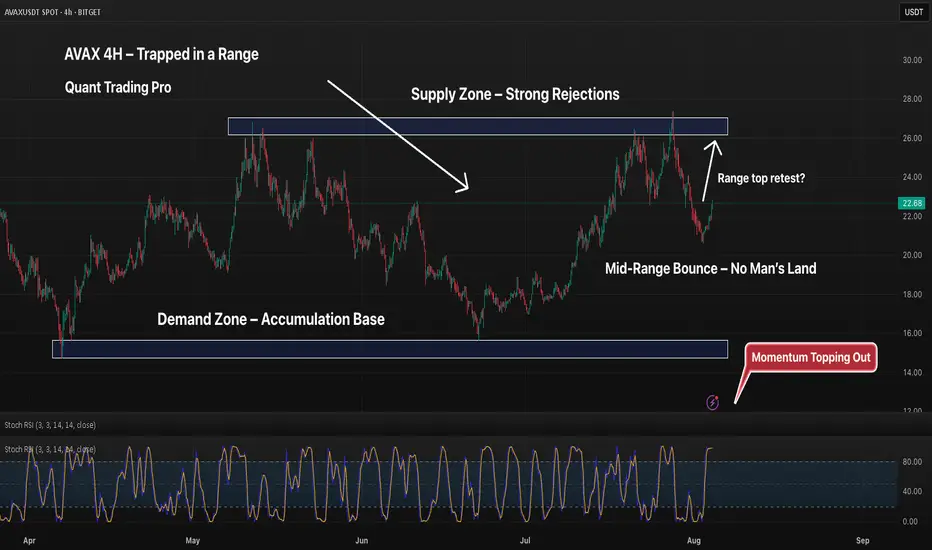
AVAX 4H – Range-Bound Between Supply and Demand, Can It Escape?AVAX has been locked in a well-respected range for months, bouncing cleanly between a strong supply zone around $26–$28 and a well-established demand zone near $15–$17. Each visit to either extreme has resulted in sharp reversals, signaling a balanced market stuck in accumulation/distribution.
Currently, price has bounced from mid-range and is approaching the upper half — but with Stoch RSI entering overbought, bulls may face short-term exhaustion.
📉 Key Levels:
– $26–$28: Heavy supply / previous double rejection zone
– $15–$17: Accumulation base that triggered two rallies
– $22.5–$23.5: Mid-range turbulence with no clear bias
⚠️ Until price breaks either extreme with conviction, range trading logic applies: fade extremes, avoid the middle chop, and wait for expansion.
Breakout traders: Stay patient.
Range traders: Eat well.
👇 Let me know if you're playing the bounce or waiting for the break.